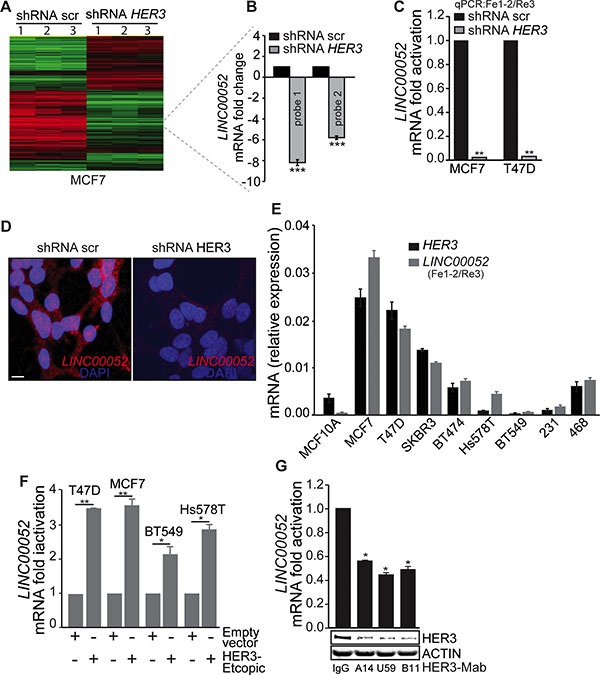
Figure 1. LINC00052 level correlates HER3 expression in breast cancer cells.

(A) Heatmap showing the clustering of gene expression for three independent microarrays (referred as 1, 2 and 3) for MCF7/HER3-knockdown and scramble (control-shRNA) cells. (B) Two independent probes for LINC00052 display significant (***p-value < 0.0001) down-regulation of LINC00052 in MCF7/HER3-knockdown cells compared to scramble-shRNA (control) cells. (C) qRT-PCR analysis (using Fe-1-2 and Re3 primers, locations are indicated in the Supplementary Figure S1A and Supplementary Table S1) for LINC00052 expression in MCF7 and T47D stably expressing shRNA HER3 or control constructs (shRNA scr). (D) RNA-fluorescence in situ hybridization (FISH) of LINC00052 in MCF7 cells expressing scramble or HER3-shRNA constructs. Expression is noted in both nucleus and cytoplasm, bar = 10 μm. (E) Breast cancer cells (MCF10A, MCF7, T47D, SKBR3, BT474, Hs578T, BT549, MDA-MB-231 and MDA-MB-468), grown to reach 80% confluence in 10% fetal serum bovine (FBS), were assessed for LINC00052 and HER3 RNA by qRT-PCR (reported as relative expression). (F) Levels of LINC00052, normalized GAPDH, assessed by qRT-PCR, in breast cancer cells (T47D, MCF7, BT549, and Hs578T) stably expressing ectopic HER3. (G) Evaluation of LINC00052, HER3, and ACTIN expression in MCF7 cells subjected for 24 hrs of treatment with 10 μg HER3 blocking antibodies (HER3-Mabs: A14, U59, and B11) or IgG isotype control. In each case, shown is mean ± S.D. of a representative of triplicate experiments *p < 0.05, **p < 0.001 and ***p < 0.0001 (Student's t-test, knockdown or ectopic-HER3 vs control cells).
