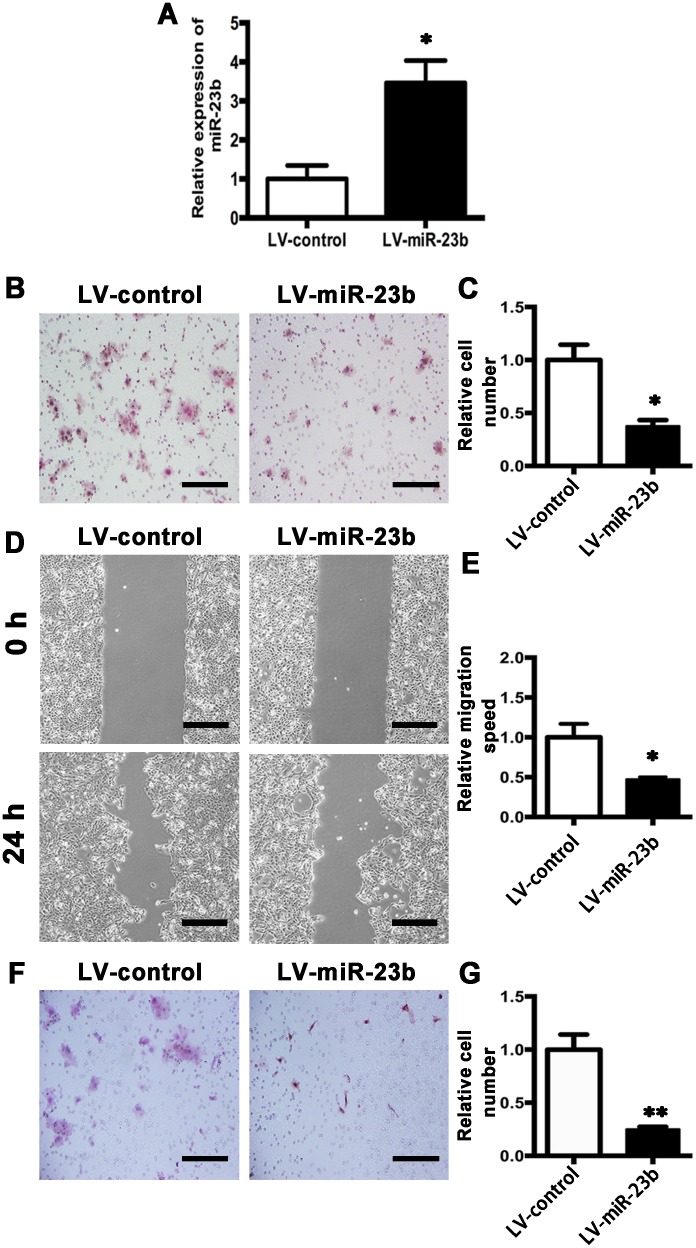
Figure 6. MiR-23b overexpression inhibits migration and invasion abilities of SCC15 cells.
A. Relative miR-23b expression of LV-control and LV-miR-23b cells. B. Representative images of cell migration at 24 h for LV-control and LV-miR-23b cells, respectively. C. Histogram showing cell migration expressed as relative number of the whole migratory cells on the bottom side of the membrane. D. Confluent cells of LV-control and LV-miR-23b were scratched and cell migratory behavior was captured. E. Histogram showing cell migration expressed as relative wound edges movement. F. Representative images of LV-control and LV-miR-23b cell invasion at 24 h. G. Histogram showing cell invasion expressed as relative number of the whole invaded cells on the bottom side of the membrane. Values were presented as mean ± SEM from three independent experiments. Scale bars: 200 μm, *P < 0.05 and **P < 0.01 compared with the LV-control cells.

