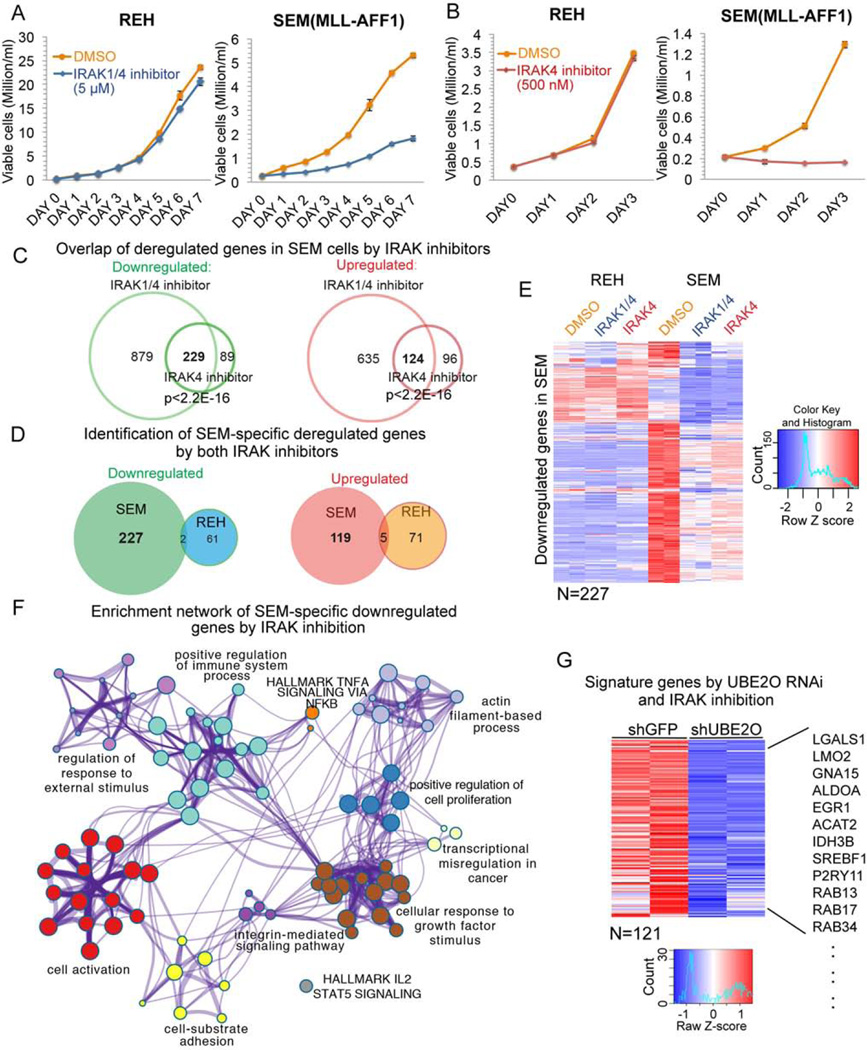
Figure 4. Stabilization of MLL through IRAK inhibition or UBE2O depletion impedes cell proliferation and deregulates a gene regulatory network in MLL leukemia.
(A) IRAK1/4 inhibitor treatment results in slower growth of MLL leukemia SEM cells but has no effect on non-MLL leukemia REH cells. Viable cells were seeded at 0.2 million/ml, and were monitored by trypan blue exclusion staining and counted using a Vi-CELL XR cell counter. Data are represented as Mean ± SD (n=3).
(B) 500 nM IRAK4 inhibitor treatment blocks SEM cell growth, but not REH cell growth. Data are represented as Mean ± SD (n=3).
(C) Venn diagram of deregulated genes in SEM cells by IRAK1/4 and IRAK4 inhibitors. 229 genes were downregulated and 124 genes were upregulated by both inhibitors.
(D) Venn diagram of deregulated genes in SEM and REH cells by both inhibitors. Little overlap was observed between REH and SEM cells.
(E) Hierarchical clustering of 227 genes specifically downregulated in SEM cells but not REH cells by both inhibitors. Heat maps of Z score-normalized values are displayed.
(F) Network enrichment analysis by Metascape (Tripathi et al., 2015) of the 227 genes downregulated only in SEM cells (Table S3). Each cluster is represented by different colors and a circle node represents each enriched term.
(G) UBE2O depletion and IRAK inhibition affect a common subset of genes in SEM cells. 121 out of 227 genes downregulated by IRAK inhibition are also decreased after UBE2O knockdown. Some examples of common downregulated genes are indicated to the right. Heat maps represent Z score-normalized values.
See also Figures S4.

