ABSTRACT
There is a significant demand for devices that can rapidly detect chemical–biological–explosive (CBE) threats on-site and allow for immediate responders to mitigate spread, risk, and loss. The key to an effective reconnaissance mission is a unified detection technology that analyzes potential threats in real time. In addition to reviewing the current state of the art in the field, this review illustrates the practicality of colorimetric arrays composed of sensors that change colors in the presence of analytes. This review also describes an outlook toward future technologies, and describes how they could possibly be used in areas such as war zones to detect and identify hazardous substances.
KEYWORDS: Colorimetric arrays, chemical detection, explosives, field testing, handheld devices, principal component analysis, smartphone technology, red green blue (RGB) analysis
Introduction
Chemical/biological/radiological/nuclear/explosive (CBRNE) (Kemp, 2016; Švábenská, 2012; Veerabuthiran and Razdan, 2011) agents pose significant threats in the 21st century, especially for armed forces and first responders such as police, firefighters, and other emergency personnel. These responders require quick, sensitive, and selective detection systems that can be used to identify and potentially quantify specific compounds. For example, law enforcement must be able to identify illegal substances as quickly as possible, in the most facile and precise manner (Marvin and Garabino, 1953), and military personnel and law enforcement must be able to detect explosives, their precursors (Schulte-Ladbeck et al., 2006), and weapons of mass destruction (Hill and Martin, 2002; Kellogg, 2010). The price per unit per field test of current technologies must be feasible for mass deployment. Furthermore, detection assays must be adaptable for miniaturization for field deployment and capable of continuously monitoring threat molecules (Amani et al., 2012; Chu et al., 2014; Williams et al., 2015). Herein, we will discuss the detection of chemical and explosive agents and the use of colorimetric arrays as potential new handheld detection devices.
In a warzone, the ability to detect toxic chemicals and explosives is imperative. Warfare agents include chemical and explosive compounds such as nerve agents like sarin, soman, and tabun, which are clear, colorless liquids without strong odors (Sidell, 2003), which can cause loss of consciousness, seizures, and eventual death (Sidell, 2003). Other chemicals of war include vesicants or poisons, such as mustard gas, lewisite, phosgene, phosgene oxime, cyanide, mace, ricin, pepper spray made of capsaicin, and explosives (Sidell, 2003). Structures of selected warfare agents are shown in Figure 1. Explosives include but are not limited to metal acetylides, organic peroxides, nitrated aromatic and aliphatic compounds, and fuel oxidizer mixtures (Sudweeks et al., 1992). Structures of selected explosives are shown in Figure 2. Since explosives and chemical weapons are necessarily reactive species, the active compound may degrade in the environment making the identification of their decomposition products important. In addition, the ability to identify reagents used to manufacture analytes of interest is also important in order to identify manufacturing sites or for forensic applications.
Figure 1.
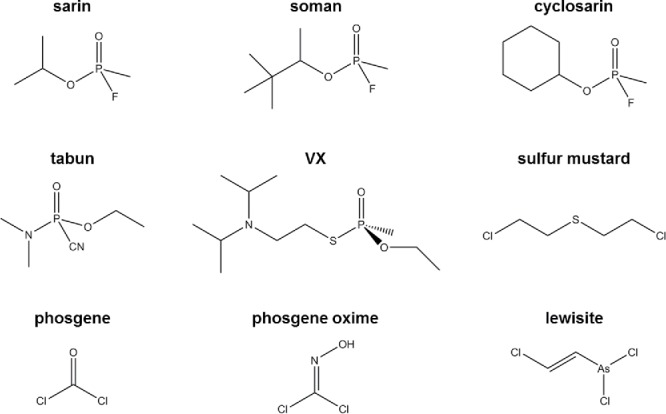
Structures of selected warfare agents.
Figure 2.
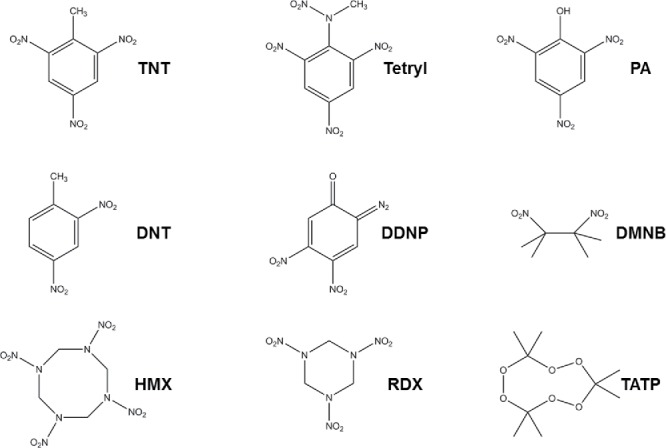
Structures of selected explosives. TNT (2,4,6-trinitrotoluene), DNT (2,4 dinitrotoluene), HMX (octahydro-1,3,5,7-tetranitro-1,3,5,7-tetrazocine), Tetryl (2,4,6-trinitrophenylmethylnitramine), DDNP (diazodinitrophenol), RDX (cyclotrimethylenetrinitramine), PA (picric acid), DMNB (2,3-dimethyl-2,3-dinitrobutane), TATP (triaceonetriperoxide).
To address these threats, various analytical tools have been deployed for field use, including hand-held assays (HHAs), Fourier transform infrared spectroscopy (FTIR), and radiation detectors. However, there is still a need to improve field-deployable instrumentation in order to make available techniques more user-friendly, sensitive, stable, reliable, light-weight, and cost-effective. Notably, besides HHAs, FTIR, and radiation detectors, there are many other methods available to detect warfare agents (Hill and Martin, 2002; Schulte-Ladbeck et al., 2006). Alert dogs are an effective, mobile method to detect threats; however, they are currently expensive (up to $20K for an untrained dog) and in short supply (Sickles, 2016). In addition, there can be variations in performance between dogs or with a single dog over time (Caygill et al., 2012). Detection tests based on liquid reagents are available; the chemicals are often repackaged into ampoules, spray cans, and other field-ready packaging. However, even with field-ready packaging, such tests still contain hazardous chemicals in containers that must be opened, which can subject users to various levels of injury and chemical exposure. For example, the Janovsky reaction, which is often used to detect nitroaromatic compounds, requires KOH, and the Griess reaction, which is used to detect RDX (cyclotrimethylenetrinitramine), requires the use of aromatic amines, many of which are potential carcinogens (Jenkins and Walsh, 1992). The Nessler reagent, which is used to detect ammonium nitrate, is corrosive and contains mercury-based compounds. The material safety data sheets of these chemicals indicate that the reagents are corrosive, irritants, oxidizers, flammables, and sensitizers. Storage requirements include cool, dry places away from combustible materials, which is impractical for field use. When the user comes into contact with these chemicals, skin inflammation and blistering can occur, and eye contact can lead to blindness. To increase field readiness and reduce hazardous exposure, chemical and explosive field tests should not rely on bulk liquid components, but instead shift to sensors that are immobilized on paper-like substrates. Furthermore, reducing the steps required for the analysis of an unknown as well as toxic and caustic waste is imperative in order to protect the user and environment.
Another issue with currently available field assays is false positives and negatives (Amani et al., 2012; Chu et al., 2014; Wing, 2015). HHAs include enzyme-linked immunosorbent assays (ELISA) and typically involve chromophore reporters that produce a color, fluorescent, or electro-chemiluminescent change to indicate the presence of a specific antigen, such as the human chorionic gonadotropin (hCG) that is detected in pregnancy tests (Kelly et al., 1979; Gan and Patel, 2013). However, this specificity hinders the identification of multiple analytes. Immunoassays are expensive, non-quantitative, water sensitive, and have limited shelf lives because they are protein-based. Immunoassays are relatively slow in comparison to colorimetric assays. In addition, some substances do not readily elicit generation of antibodies (McKone et al., 2000; Negrusz et al., 1999). Similar to ELISA, lateral flow assays (LFA), microfluidic (Peters et al., 2015; Sajid et al., 2015), and point-of-care (POC) devices such as paper substrates and dipstick assays (Costa et al., 2014; Hu et al., 2014; Li et al., 2011; Parolo and Merkoci, 2013; Yetisen et al., 2013) have been used to identify analytes. Notably, low cost POC detection systems were highlighted as one of the top 10 new technologies in 2009 (Griffatini, 2009). In addition to POC devices, colorimetric microfluidic “lab on a chip” methods have been developed for various analytes, including explosives such as nitrates and TNT (Peters et al., 2015). Although promising in high sensitivity, these techniques often involve antibody–antigen interactions to induce a color change, and protein based assays suffer of similar disadvantages as ELISA tests. Furthermore, the techniques have primarily been applied in diagnostic medicine and health care services as POC tests (Sajid et al., 2015) because of pressing needs to detect dangerous or communicable diseases in developing countries with large populations (Perkins and Kessel, 2015).
Detection of explosives
Among warfare chemicals, the detection of explosives is critical. Explosives are the most frequently encountered weapons by soldiers. Available methods for the detection of explosives involve techniques such as FTIR, nuclear magnetic resonance (NMR), mass spectrometry (MS), Raman, luminescence, ion mobility spectrometry (IMS), vapor pressure and gas analysis, and nanocomposite catalysts (Schulte-Ladbeck et al., 2006; Amani et al., 2012; Berezow, 2015; Burks and Hage, 2009; Caygill et al., 2012; Chu et al., 2014; Schulte-Ladbeck et al., 2006). Table 1 summarizes the advantages and disadvantages of various lab and hand-held detection methods that are commonly used for the detection of warfare chemicals.
Table 1.
Summary of common chemical detection methods.
| Technique | Advantages | Disadvantages |
|---|---|---|
| FTIR | Lab-based and portable instruments Ability to analyze solid, liquid, or gas phase samples | Cost |
| GC/MS and GC/IMS | Low detection limitsHigh selectivityAble to identify/quantify components of mixtures | CostLarge instrumentLab-based |
| Ion mobility spectrometry (IMS) | Low detection limitsHigh selectivityQualitative and quantitative resultsPortable and handheld devices | Radioactive Ionization SourceCost |
| Lateral flow devices | InexpensiveEasy to useSmall samplesNo power requirements | Usually qualitativeReproducibilityPre-treatments |
| Mass spectrometry (MS) | Low detection limitsHigh selectivity | CostLarge instrument |
| Nuclear magnetic resonance (NMR) | High selectivity | Lab-basedCostLarge instrument |
| Nuclear quadrupole resonance (NQR) | Detects nitrogen-containing compoundsCan detect buried compounds and/or those in sealed containers | Large instrument |
| Raman spectrometry | Lab-based and portable instrumentsAbility to analyze at a distanceAbility to analyze materials in sealed transparent containersGood for aqueous samples, as water has a low backgroundNon-destructive | Trouble with fluorescent or strongly absorbing materialsPotential for ignition of explosivesPossibly long collection timesLow SensitivityCostSpecific power requirements |
| Terahertz spectroscopy | Non-destructiveTerahertz radiation can pass through many materials such as cloth, plastic, etc.Gas phase and solid phase samplesPortable or lab-based instruments | Data collection timeLarge power consumptionCost |
Portable devices for analyte testing include chromatographs and spectrometers (e.g., gas chromatography–mass spectrometry; GC/MS) (Harris, 2002; Mach et al., 2015; Snyder et al., 2016), chemical agent monitors (Turner, 2002), and optical probes (Martinez-Olmos et al., 2011). However, the price of many of these devices precludes their widespread use. For example, miniaturized MS detectors such as the one from 1stDetect are expensive, costing up to $100K. The Thermo Fisher Scientific AhuraFD Handheld Chemical Identification Scanner costs $34,000–48,000. ICXT has the ICX Fido Verdict, which is versatile and competitively priced at $16,000; notably, this is the standard scanner used by the US military (“ICx Technologies Introduces Fido™ Verdict™;” ICx Technologies, 2009).
S2 Threat Detection Technologies (2015) (Dry Explosive Test Kit) is a company in Australia that specializes in colorimetric test strips that can detect solid or liquid explosives such as nitrates, chlorates, and peroxides. Numerous other field testing kits are currently available, such as Cress kits (ECBC Public Affairs, 2014), Expray (Bjella, 2005), and the Mobile Field Kit (Asynchrony Labs, n.d.), among others.
Detection of analytes using colorimetric array techniques
Why use colorimetric arrays over conventional methods?
The examination of digital images in analytical chemistry has increased by more than 87% from 2005 to 2015 because the detection of analytes has improved with the increasing availability of imaging devices (Capitán-Vallvey et al., 2015). In particular, the detection of analytes using red, green, and blue colors (RGB) has led to state of the art of colorimetric and fluorometric sensor arrays often referred to as opto-electronic noses, which provide discriminatory power among analytes by using an array of sensors that change colors upon interaction with the tested substance, similar to the sense of smell (Askim et al., 2013). Specifically, these colorimetric arrays or optoelectronic noses respond to analytes in solutions, vapors, and even airborne particles (Alkasir et al., 2015). A recent Scifinder Scholar search (June 27, 2016) using the research topic “colorimetric arrays” led to 505 hits with the earliest report of a colorimetric sensor array coming in 2000 (Rakow and Suslick, 2000); the field has increased dramatically since the initial report. The search also revealed that the top five published authors in this field include Kenneth Suslick, Feng Liang, Lim Sung, Zhao Jiewen, and Eric Anslyn.
Colorimetric sensor arrays are an emerging technology for mobile chemical detection and identification because these spot tests would offer speed, simplicity of operation because of the use of solid test strips, portability, and affordability for the detection of unknown analytes (Carey et al., 2011; Faulstich et al., 2008; Morris, 2007; Musto and Suslick, 2010; O'Neal et al., 2000; Patton et al., 2007; Qian and Lin, 2015; Sharma and Lahiri, 2006; Skehan et al., 1990).
Colorimetric arrays offer an attractive alternative because many of the existing techniques are time consuming, presumptive, and require technical know-how as well as the use of specific instruments and chemicals. Some instruments can often not be utilized in the field for the rapid detection of unknown analytes because they require large or heavy instruments that require access to power outlets, solvents, chemicals, etc.
To put this in perspective, the U.S. Department of Justice published a manual of color tests and kits for preliminary identification of drugs (National Institute of Standards and Technology (NIST), 2000). The manual describes 12 colorimetric test solutions that can be prepared to identify drugs. The problem with these tests is that multiple analytes react positively, and thus the specificity is compromised. Furthermore, multiple tests are required to narrow down the possible substance in question. The reagents used in most tests in the manual are highly toxic, and the color changes are often times not clear enough for proper identification since the color changes are determined by the human eye, which varies from user to user.
In contrast, colorimetric arrays enable multiple analytes to be interrogated in a single test; with the colorimetric signature of the array color combination can lead to unique substance identification. Another advantage is that substance-specific sensors can be used for the colorimetric arrays. Therefore, the technology can be customized, and arrays of flexible dimensions can be created (e.g., 2 × 2, 4 × 4, 6 × 6, etc.) depending on the specific applications and quantity of sensors needed, such as detection of specific drugs for law enforcement, or chemical weapons for soldiers, or pesticides for environmental agencies. Since only a small drop of the sample is required, testing can be performed even when only a small amount of analyte is available. Furthermore, due to the small sample size, user exposure to dangerous chemicals is not an issue. Finally, colorimetric arrays are mostly examined using digital images, and RGB data is used for substance identification thus leading to objective automated analysis. This also allows for easy field use and data sharing when users can simply use a digital camera or smartphone. Table 2 summarizes some of the advantages that colorimetric arrays could offer over current detection methods.
Table 2.
Advantages and disadvantages of colorimetric sensor arrays.
| Advantages of colorimetric sensor arrays | Challenges |
|---|---|
| Fast | Reproducibility of printing |
| Inexpensive | Reproducibility of imaging |
| Light weight and portable | Difficult to determine individual components of a mixture |
| Small sample size | Stability/shelf-life |
| Minimal instrumentation and power needed | Large data sets of RGB values that need to be analyzed using chemometric methods |
| Ability to customize array for specific analytes | Sample application may vary |
| Respond to a wide range of analytes | |
| Many potential sensors to choose from | |
| Can be used for identification and quantification | |
| Devices can fabricated with simple methods such as inkjet printing | |
| With appropriate apps, data collection and analysis are user friendly | |
| Potential to analyze vapor or liquid samples | |
| Customization possible for specific analytes | |
| Flexible array sizes | |
| Integration with smart phone technology |
Overview of the current state of art of colorimetric arrays
Colorimetric arrays are available in liquid and solid forms. They are typically composed of multiple colored dyes arranged a two-dimensional grid and change color upon interaction with analytes. The pattern of color changes can be used to analyze and identify the substance in question. Pattern recognition is based on the combined response from numerous sensors.
Colorimetric arrays contain anywhere from 3 to 40 colorimetric sensors (dyes) depending on the application (Chulvi et al., 2012; Li et al., 2015a; Lyon et al., 2011; Salles et al., 2014). More sensors are required when multiple analytes must be detected to yield a unique color pattern, but if one is only interested in a particular analyte, such as a narcotic, fewer sensors can be used.
Many sensor arrays include pH indicators, because pH indicators are well known to react with acids and bases as well as other classes of compounds; for example, methyl violet is used as a sensor for cyanide ions (Afkhami and Sarlak, 2007; Bang et al., 2008; Capel-Cuevas et al., 2010;Chang, 2012; Cuéllar et al., 2011; Curto et al., 2012; Hong and Chang, 2014; Lopez-Ruiz et al., 2014; Martinez-Olmos et al., 2011; Safavi et al., 2007; Yetisen et al., 2014). In addition to pH indicators, other classes of sensors have been utilized in arrays, such as metalloporphyrins, solvatochromic dyes, redox indicators, metal salts, and nanoparticles (Askim et al., 2013). Moreover, some arrays include sensors that react with a specific class of molecules, such as nitrogen or sulfur-containing species (Salinas et al., 2014a). For organophosphorus nerve agents, molecules based on a triaryl methanol framework or molecules that can be cyclized to form quaternary amines have been shown to be effective colorimetric sensors (Chulvi et al., 2012; Costero et al., 2008; Gotor et al., 2011), and could easily be included in the colorimetric sensor array. Likewise sensors such as solvent red 5 (p-nitrophenylazo 2 and naphthylamine) have been used to detect various chemical weapons (Deiner and Vigus, 1981). Many colorimetric sensors have been reported for explosives which could also be incorporated in a colorimetric sensor array (Germain and Knapp, 2009; Salinas et al., 2012). However, specific sensors are not always needed as the colorimetric sensor array uses the pattern of color or no color changes from all sensors in the array for the analysis.
Some color changes are due to molecular interactions including hydrogen transfer reactions and π–π interactions (Okuom and Holmes, 2014). Other potential interactions between sensors and analytes include Lewis acids and bases, hydrogen bonding, and dipole–dipole interactions. Having a range of sensors that utilize different interactions towards analytes improves the versatility of the sensor array (Suslick, 2004). Selection of the sensors can also include criteria such as solubility, stability, cost, toxicity, and magnitude of the color change (Burks et al., 2010).
Liquid arrays
Liquid arrays are typically prepared in a 96-well plate. Figure 3 shows an in-house prepared liquid colorimetric sensor array (Lyon et al., 2011; Burks et al., 2010; Holmes, 2010; Lyon et al., 2012; Smith et al., 2012). Specifically, eight sensors are distributed across the columns that were used to detect changes in color and fluorescence when methamphetamine, hydrocodone, and hydromorphone were added. Although this liquid array approach has been used to detect over 200 analytes including drugs, explosives pesticides, food spoilage metabolites, the assays suffer of similar disadvantages as liquid colorimetric tests, requiring solvents and liquids to execute the test, making it less user- and field-friendly, and therefore not practical for field deployment.
Figure 3.
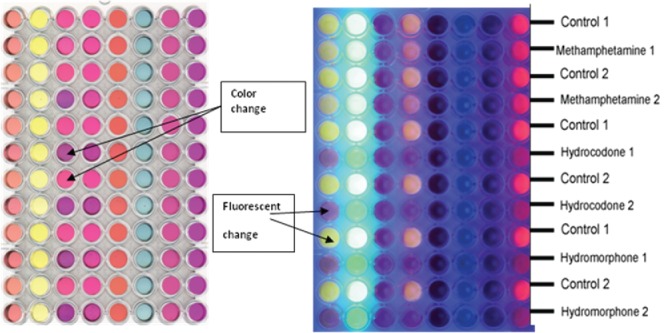
An in-house created liquid-based sensor array showing changes in color (left) and fluorescence in the image (right) in the presence of various narcotic samples. The color changes compared to a water control sample can be used to identify the analytes.
Solid arrays and array fabrication
Solid arrays are typically prepared by incorporating sensing dyes and pigments onto solid supports such as nylon, paper, and nitrocellulose. Since these assays do not require liquid handling and pipetting of sensors and analytes, they are more user- and field-friendly than liquid arrays.
Several deposition methods exist in the formation of colorimetric arrays. For example, arrays can be made by incorporating ink with slotted pins onto sensor sol–gel formulations and standard chromatography paper (Bang et al., 2008). Other methods of sensor immobilization onto solid supports include the use of polymer particles (Soga et al., 2013), sol–gel particles (Bang et al., 2008), gels (Curto et al., 2012), and polymer membranes and films (Bueno et al., 2015; Kannan et al., 2015). Immobilizing agents can provide several additional benefits including improved selectivity (Soga et al., 2013), protection from the environment, and extended shelf life (Kannan et al., 2015).
Commercially available high throughput printers can also be used to produce colorimetric arrays. Typically, high throughput printers that print microarrays that are generally associated with DNA or RNA arrays (biochips) where hundreds of thousands of DNA or RNA spots are printed over a small area for the expression levels of large numbers of genes. Arrayjet in Scotland, UK, provides in-house services for DNA and RNA array printing and sells or rents array printers to clients. However, even though these microarray printers could be used to print colorimetric chemical arrays, the cost per unit prohibits commercialization of the arrays due to the high cost of the printers. For example, Arrayit Corporation sells microarray printers for over $300K (Arrayit Corporation, 2016).
Automated contact printers (from GESIM) start at €75K for the basic model (GeSiM” 2015) with optional capabilities available, including cooling and heating print surfaces, amount of printing channels, etc. These printers provide arrays of high quality in terms of uniformity and consistency. However, the technicalities of the printing and plotting are complex (Cheng and Kricka, 2003).
Inkjet printing has been utilized to apply sensors to microfluidic devices (Cate et al., 2015; Sicard et al., 2015) and to prepare photosensors (Bernacka-Wojcik et al., 2010). A colorimetric array printed with an inexpensive, inkjet printer available at local office supplies stores is shown in Figure 4. Inkjet printing allows for printing on paper-like substrates including filter paper and functionalized nylon membranes. This maximizes array design capabilities via substrate selection for the most effective immobilization of sensor molecules (Liana et al., 2012). Inkjet printing can be carried out by inexperienced users and multiple sensors can be printed at once to provide multiplexing, the detection of various substances with one test. Given these advantages, inkjet printing seems to be an easy and effective method to deposit sensors and serves as an alternative to more expensive printing methods (Bernacka-Wojcik et al., 2010; Hossain et al., 2009; Mei and Zhang, 2012; Soga et al., 2013).
Figure 4.
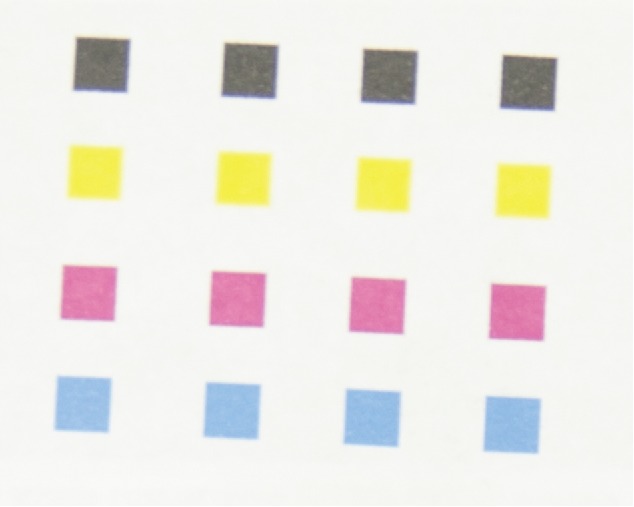
A colorimetric array printed with a commercially available inkjet printer showing four rows of four different sensors.
Detection of various analytes including chemical and explosive warfare agents using colorimetric arrays
Colorimetric arrays are such a versatile technique because of their ability to serve as effective detection tools for a diverse range of analytes including odorants and gases (Janzen et al., 2006; Suslick et al., 2007; Kemling and Suslick, 2011; Askim et al., 2013; Feng et al., 2010a, 2010b, 2010c; Janzen et al., 2006; Kemling and Suslick, 2011; Suslick et al., 2007), metal ions (Ariza-Avidad et al., 2014; Sener et al., 2014), nanoparticles (Mahmoudi et al., 2016), sugars (Musto and Suslick, 2010; Musto et al., 2009), amines (Bang et al., 2008; Bueno et al., 2015; Soga et al., 2013; ), anions (Feng et al., 2012; Palacios et al., 2007), organic compounds in water (Zhang and Suslick, 2005), narcotics (Baumes et al., 2010; Burks et al., 2010; Lyon et al., 2011; Smith et al., 2012), food spoilage (Huang et al., 2014; Salinas et al., 2014b), organic solvents (Rankin et al., 2015), fuels (Li et al., 2015b), and pesticides (Qian and Lin, 2015). Complex mixtures including beer, coffee, and soft drinks have also been characterized (Zhang and Suslick, 2007; Zhang et al., 2006; Suslick et al., 2010). Even biological targets such as proteins (Xu et al., 2014), fungi (Zhang et al., 2014), bacteria (Carey et al., 2011; Li et al., 2011), steroids and sport doping compounds (Batres et al., 2014), and specific molecules indicative of lung cancer in breath (Mazzone et al., 2012) have been detected.
However, explosives, nerve gases, nerve agents, and other toxic chemicals have received comparatively less attention. A 36 component sensor array able to identify ppm levels of vapors of 20 toxic industrial gasses including phosgene, hydrogen cyanide, and fluorine was recently reported (Feng et al., 2010a, 2010b; Lim et al., 2009). Chulvi et al. applied a 16 component sensor array for the discrimination of saturated vapors of nerve agent simulants from organic phosphates and phosphonates (Chulvi et al., 2012). Salles et al. reported a three sensor array that was able to distinguish solutions of 5 nitrate and peroxide-based explosives such as hexamethylene triperoxide diamine (HMTD), TATP, picric acid, 4-amino-2-nitrophenol, and nitrobenzene. In addition to identification, the quantification of analytes is possible on the microgram scale (∼1 to 10 mM) (Salles et al., 2014). Suslick et al. recently applied a 40 sensor colorimetric array to identify the vapors of 16 explosive analytes including nitrates, peroxides, and oxidizer/fuel mixtures (Askim et al., 2016; Li et al., 2015a). Furthermore, this method was used to identify improvised explosives TATP and HMTD, as well as reagents that were used to synthesize the material in question (Li et al., 2015a). The analytes were identified by sampling the vapors of the material (Li et al., 2015a). TNT has also been identified using an 8 component, liquid-based sensor array (Lyon et al., 2011), making this assay also possible option for detection of explosives.
Image capture of colorimetric arrays
Image capture technologies for colorimetric arrays are needed to analyze color changes and identify unknown substances. CCD cameras, desktop scanners, portable optical devices, and smartphones have been described to serve this purpose (Hu et al., 2014; (Bang et al., 2008; Capel-Cuevas et al., 2010; Cuéllar et al., 2011; Feng et al., 2010a; Lyon et al., 2012; Soga et al., 2013; Soldat et al., 2009). Readily available imaging software such as ImageJ (Schneider et al., 2012) can then be used to examine the RGB color space and color changes in the presence of an unknown substance (Smith et al., 2012), and thus identify the substance (Batres et al., 2014; Johnke et al., 2013; Lyon et al., 2012).
Due to the rapid expansion of the smartphone market in the general population, and because the armed forces have already started testing devices for field use, this approach for image collection may replace all currently available detection techniques (Horn, 2011). In addition, smartphones are user friendly, cost-effective, easy to carry, and do not require much technical know-how. Research groups have developed customized apps to collect and process images on smartphones without the need for a computer. Although many RGB apps for general color space analysis are available free of charge, custom apps for array RGB analysis are not readily available to date. However, considerable effort has been dedicated to develop color analysis apps and devices for the integration of colorimetric arrays with smartphones and tablets (Bueno et al., 2015; Hong and Chang, 2014).
Analysis of colorimetric arrays using chemometric methods
Colorimetric sensors generate a large dataset with many variables. For example, an array with 8 sensors has 24 variables (8 sensors ∗ 3 colors). However, handling this wealth of data can present a challenge. Various chemometric methods to analyze colorimetric data have been reported, including Euclidean distance, binary codes, principal component analysis (PCA), hierarchical cluster analysis (HCA), and linear discriminant analysis (LDA). PCA and HCA are the most common methods (Capitán-Vallvey et al., 2015).
In order to illustrate these chemometric methods, the experiments described in the following sections were carried out in-house and are unpublished results. A colorimetric array composed of acid and base indicators was prepared in a 96-well plate (Lyon et al., 2012, 2011). Various concentrations of hydrochloric acid and sodium hydroxide were applied to the array, which was then scanned with a commercially available flat-top scanner. After subtracting a water control sample from each plate, the resulting RGB values formed the data set for chemometric analysis that was performed in R, a free software environment for statistical computing and graphics (R Core Team, 2015). Detailed procedures for obtaining PCA, HCA, and LDA results from the dataset in R will not be presented in this review, but can be found in the cited literature.
Euclidean distance
Euclidean distance is the geometric distance between two points, often before and after sample addition to an array (Lim et al., 2009; Qian et al., 2016). It is simple to calculate and reduces the high dimensional data to a single number that can be easily analyzed. However, the Euclidean distance may not make use of all of the information in the data set. For example, a positive or negative change in color would yield similar results. Likewise, changes of equal magnitudes on different sensors could give the same response. It has been utilized to identify toxic gasses (Lim et al., 2009), for quantification of analytes (Salles et al., 2014), and to analyze the effects of potential interferants (Qian et al., 2016). In Figure 5, the Euclidean distances for several concentrations of hydrochloric acid (HCl) and sodium hydroxide (NaOH) are compared in a colorimetric array, and a simple number can be used to identify the samples.
Figure 5.
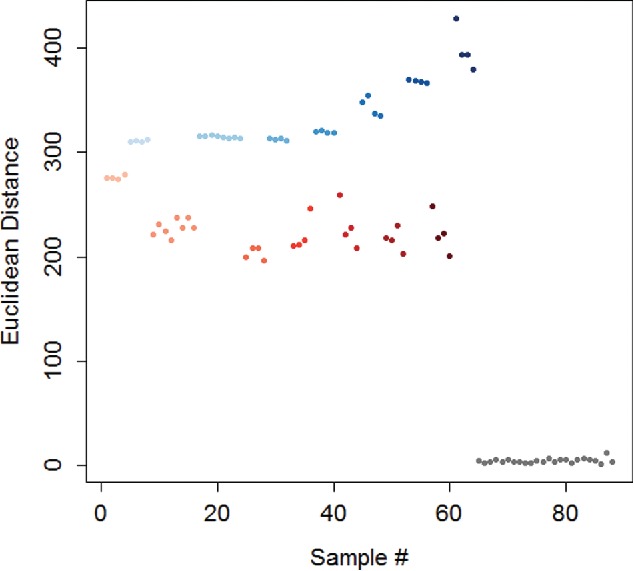
Euclidean distance for 0.5 – 10 M NaOH (blue) and HCl (red), and a water control (grey). For both analytes, the color is darker for higher concentrations.
Binary codes
Another method to detect analytes in colorimetric arrays is the generation of unique binary codes extracted from the color changes. For example, in Table 3, caffeine, cocaine, and nicotine were identified using a unique binary code specific to the analyte (Lyon et al., 2012). Binary codes are determined by statistical analysis to determine if a significant color change has occurred. If there is a color change, the binary number is 1, and when there is no color change, the binary number is 0. The resulting binary code is often unique for each analyte. This method has been successful utilized to identify a large range of molecules, including TNT, drugs, and biological molecules (Burks et al., 2010; Smith et al., 2012). In order to obtain binary codes, various methods for extracting RGB information from an image have been used, including pixel by pixel subtraction, a masking technique, and the use of macro to determine the average color of each sensor (Lyon et al., 2012). Although this method has been shown to be effective, it may also shrink the data more than desired to only two binaries for a color change or no color change instead of using the entire RGB color space.
Table 3.
Identification of caffeine, cocaine, and nicotine using a unique binary code specific to each analyte. Data obtained from (Lyon et al., 2012a).
| Analyte | Average Code | Error, % |
|---|---|---|
| Caffeine | 11-11-11-00-11-00-11-00 | 7.16 |
| Cocaine | 11-11-11-11-11-11-00-00 | 4.06 |
| Nicotine | 11-11-11-11-00-00-00-00 | 9.75 |
PCA
Unlike other statistical methods that work on each color component of each sensor independently, PCA can be used to analyze the entire multidimensional data set at once. PCA is a statistical algorithm that uses an orthogonal transformation to change a set of observable and possibly related variables into a set of linearly uncorrelated variables, which are called principal components (Graham, 1993). However, fewer components are needed to describe the data set, and patterns and trends in the data can be easily explored and visualized. Variables that are strongly correlated in the original data set remain closely related in the new components, and data points that were similar in the original data set are still similar in the components (Graham, 1993). PCA has been established as a viable tool to interpret data generated by sensor arrays and other methods (Bang et al., 2008; ; Bueno et al., 2015; Chulvi et al., 2012; Feng et al., 2010c; Mahmoudi et al., 2016; Matos et al., 2007; Ranft et al., 2015; Salles et al., 2014; Soga et al., 2013; Workman et al., 2009). PCA has been used for many unique applications, such as determining nanoparticle morphology (Matos et al., 2007) or correlations between metal concentrations in cosmetics (Batista et al., 2015). Salles et al. applied PCA to the identification of explosives, and all five analytes formed distinct clusters in a biplot of the data, indicating that the method could be used to clearly identify specific explosives (Salles et al., 2014).
To compare PCA to the other statistical methods, PCA was conducted with the colorimetric data set discussed previously. In the biplot, there was a clear distinction between the water control, and HCl and NaOH samples (Figure 6). In addition, the NaOH concentrations formed distinct groups along the component 2 axis, indicating that this method could be used to determine the concentration of NaOH. The acid samples were more closely clustered than basic samples, but in a three-dimensional plot of the first three components (Figure 7), the 0.5 M and 1 M HCl were separated from the other HCl concentrations indicating that low and high concentrations of acids could be discerned.
Figure 6.
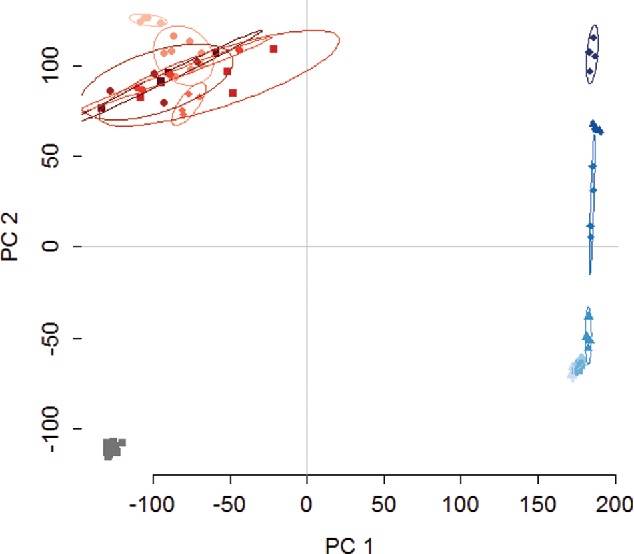
Biplot from principal component analysis (PCA). Water (grey), HCl (red), and NaOH (blue) each form distinct groups, and the NaOH concentrations form distinct groups. The cluster in the top left quadrant represents the HCl samples, while the cluster on the far right represents NaOH, and the cluster in the left lower quadrant represents the control samples (water). The ellipses represent 90% confidence intervals. PC1 and PC2 are the first and second components from PCA, respectively.
Figure 7.
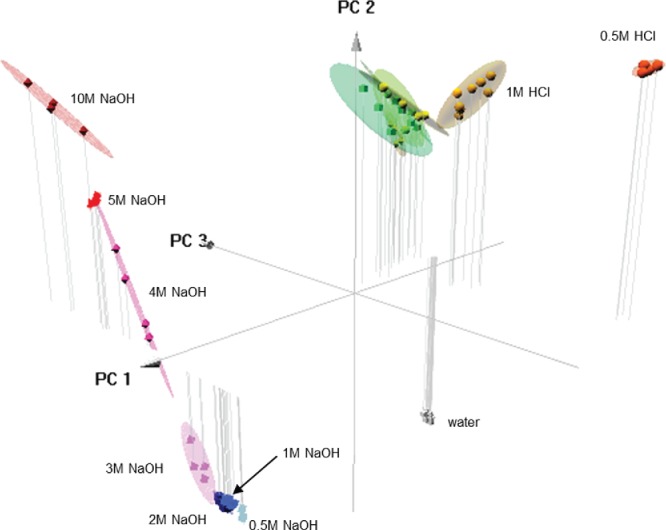
Three dimensional plot using PCA results based on the first three components. The 1.0 M (yellow) and 0.5 M (orange) samples are separated from the HCl samples at higher concentrations. The various concentrations are clearly separated, as the 10 M samples appear in the upper left quadrant, and the lower concentrations are aligned linearly downwards towards the bottom right. The lowest concentration (0.5 M) samples are the furthest (light blue) from the highest concentration (red) samples. The ellipses represent 90% confidence intervals.
HCA
Like PCA, HCA is a multivariate analysis technique as it produces clusters of data and is used to analyze colorimetric arrays (Bang et al., 2008Bueno et al., 2015; Feng et al., 2010a, 2010b; Mahmoudi et al., 2016; Salles et al., 2014; Soga et al., 2013). Hierarchical clustering generates clusters by iteratively joining the next most similar samples or clusters to an existing cluster. This results in a tree that shows clustering relationships from a set that contains all samples to individual samples. For example, Li et al. used HCA to cluster TATP and HMTD samples, and each analyte formed its own cluster; samples prepared via different methods were also clustered within the larger cluster for the analyte (Li et al., 2015a). An example of a dendrogram showing clustering results for water, HCl, and NaOH samples is shown below in Figure 8. Water, HCl, and NaOH each form distinct clusters indicating that this method can be used to form groups of similar samples.
Figure 8.
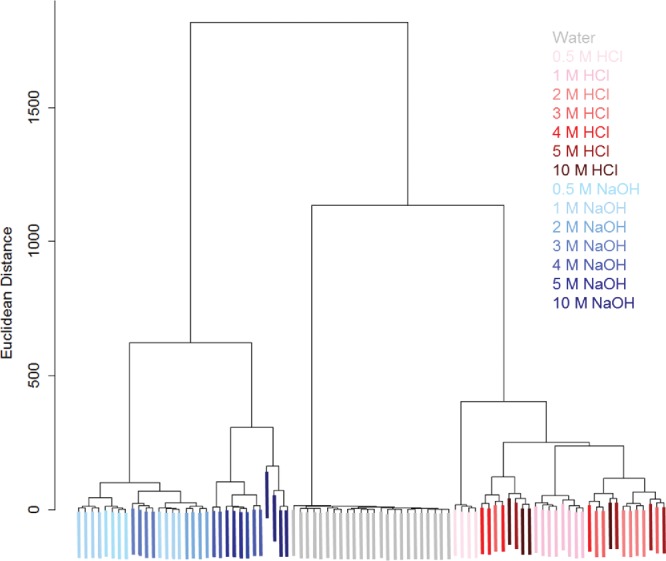
Hierarchical cluster analysis (HCA) for 0.5 – 10 M concentrations of NaOH (blue), HCl (red), and water control (grey). For both analytes the color is darker for higher concentrations. Distinct clusters are formed for water, NaOH, and HCl. Some misclassifications for concentrations are present, particularly in the acid samples. The y-axis shows the Euclidean distance squared (based on RGB units).
LDA
Linear discriminant analysis has also been applied to the analysis of colorimetric sensor arrays (Minami et al., 2013; Zhang et al., 2014). Analogous to PCA, LDA generates new variables are that linear combinations of the original variables. Unlike PCA, LDA is a supervised method and seeks to maximize the differences in the means between groups, and therefore, can often perform better than PCA (Askim et al., 2013). However, LDA requires more samples than variables in the original dataset, and some sources indicate that more samples per group are required than the number of variables in the data set (Wold et al., 1981). Like PCA, LDA is commonly used for dimension reduction, but LDA can also be used as a quantitative means of classifying unknown samples. Figure 9 shows a plot of the first and second dimensions from LDA analysis. In the plot, water, NaOH, and HCl samples form distinct clusters indicating that LDA is effective for analyzing and identifying these analytes. In addition to identifying the acid and base samples, LDA can also be used to determine the sample concentration, an important criteria in applications where extent of chemical exposure is necessary. The described chemometric methods are very reliable, easy to apply, and sensitive, and thus can serve as an excellent analysis tool for colorimetric detection of analytes and their concentrations.
Figure 9.
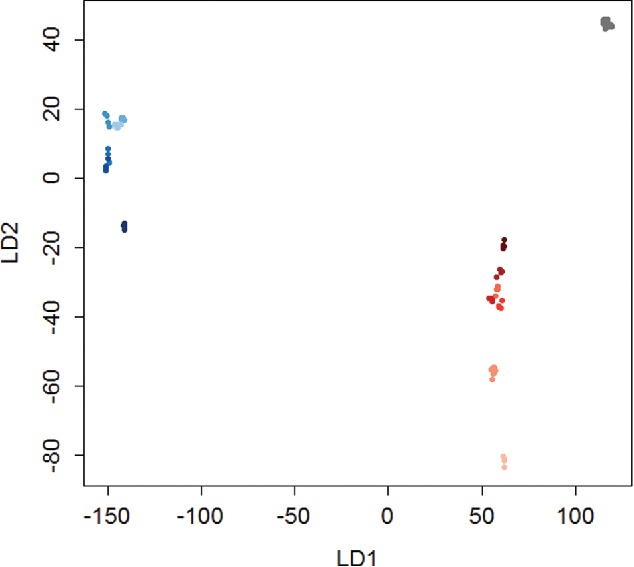
Linear discriminant analysis (LDA) for 0.5 – 10 M concentrations of NaOH (blue), HCl (red), and a water control (grey). For both analytes, the color is darker for higher concentrations. There is clear a separation between the water, HCl, and NaOH samples, and moderate separation between the concentrations of acid and base. LD1 and LD2 are the first and second directions from LDA, respectively (units are based on RGB values).
Chemical Biological Radiological Nuclear and Explosives (CBRNE) Reconnaissance Sampling Kit of the United States Army – Current state of art
In December 2014, the Department of Defense (DOD) requested submissions for SBIR proposals (A15-048) to redesign of the Chemical Biological Radiological Nuclear and Explosives (CBRNE) Reconnaissance Sampling Kit (ARMY 15.1 Small Business Innovation Research (SBIR) Proposal Submission Instructions; SBIR, n.d.). The DOD identified the need to detect, identify, and store data regarding CBRNE hazards (ARMY 15.1 Small Business Innovation Research; SBIR, n.d.). A unified deployable diagnostic assay sampling kit that can be used by personnel in the U.S. Army and Marine Corps in many different climates and landscapes is necessary in order for soldiers to test samples on site. Current field detection methods for soldiers are acceptable but simpler, more user-friendly, quicker, field-deployable, cost-effective, more sensitive, and selective methods are needed for presumptive testing in warfare environments. Currently, the US Army uses the Dismounted Reconnaissance Sets, Kits and Outfits (DRSKO) (Chemical, Biological, Radiological, & Nuclear Information Resource Center (CBRN IRC), 2014; Selby, 2014). DRSKO is composed of sensors for warfare hazards, protective clothing, and equipment to collect a sample, detect, identify, and mark CBRNE substances (McKone et al., 2000). Figure 10 shows the components that are included in the DRSKO kit. It includes a plethora of detection and analysis instruments, such as the Firstdefender RMX, TruDefender FT, IdentiFinder, FidoX, a power supply and compressor, various HAZMAT suits, and other relevant equipment.
Figure 10.
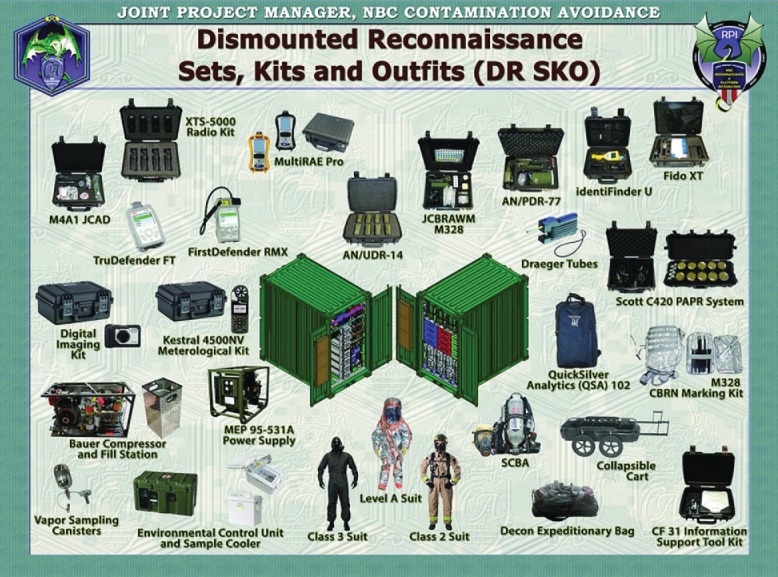
The Dismounted Reconnaissance Set that is currently used by the US Army. Figure obtained from Chemical, Biological, Radiological, & Nuclear Information Resource Center (CBRN IRC), 2014.
Many of the instruments that are used in tactical environments are based on mass or energy spectroscopy, such as Ion Mobility Spectrometry, Infrared Absorption Spectroscopy, Differential, Optical Absorption Spectrometry, Aerosol Mass Spectrometry, Raman Spectroscopy, Nondispersive Infrared Spectroscopy, Gas Chromatography, and Surface Acoustic Wave Technology (Barker, 1999; Institute of Medicine, 1999; National Research Council, 1991, 1997a, 1997b, 1999, 1997a, 1997b, 1991).
Mobile sampling vehicles, such as the FOX vehicle (US Department of Defense, 2001), contain detection kits including test papers, detectors, and/or sample detection tubes. Also included are chemical Detector/Alarm Systems. Many of these “visual or acoustic alarm only” systems do not provide much information about the identity of compounds detected or the concentration, but only indicate that the compound is above the sensitivity level. Also, the sensitivity is low (high millimolar) and the sampling analysis can take several minutes. Some of the systems are based on infrared spectroscopy and the analysis must be performed with the instrument on a stationary platform. Some of the improved chemical detectors do have faster response times and higher sensitivities, but require heavier accessories and processors. Other equipments includes gas chromatography, air monitoring, vehicle-mounted systems, and water testing systems, but most require long analysis times, certain voltage, batteries, extension cords, weigh several pounds, and are expensive.
Colorimetric papers (M8 papers) are also part of the detection kits. While they are simple to use, fast, inexpensive and can detect several chemical weapons, they can only be used for screening and the samples have to be verified and analyzed in the lab for confirmation. Another disadvantage is that the paper-based tests exhibit many false positives.
Theoretical example of how a colorimetric array could be deployed for field use
In this section, we will briefly describe how colorimetric arrays could potentially be used for field testing, thus, improving the current state of art of the CBRNE sampling kit for reconnaissance teams in the armed forces and first responders in emergency situations. A theoretical procedure that involves sample retrieval, image capture, image analysis, and data storage and dissemination will be presented.
Sample retrieval for a solid or liquid
A representative example of an array is shown in Figure 11. A plastic pouch containing a disposable pipette, detection array, and desiccator pack could be used to hold the entire kit. For sample retrieval, the suspected surface could be swabbed and the sample could be eluted from the swab with a non-toxic, field-appropriate solvent, such as phosphate buffered saline, to an appropriate container for long term storage. A disposable pipette can be used to retrieve a small drop of the liquid containing the analyte from the centrifuge tube and the drop can be applied onto the array. In the event of gas sampling, more complex mechanisms need to be applied, such as gas concentrators that continuously sample the atmosphere in order to concentrate the sample for detection (ACD-200 Bobcat; InnovaPrep LLC, 2013).
Figure 11.
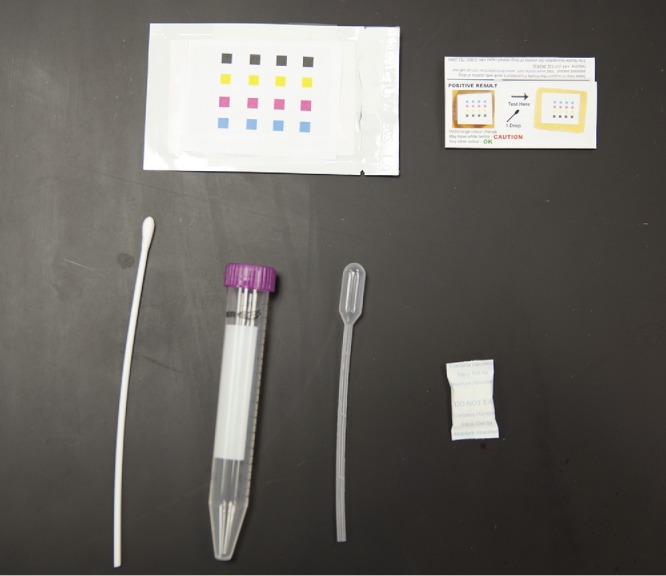
Prototype printed colorimetric array analysis kit. The kit contains the sensor array, disposable pipet, instructions, and silica gel desiccant sealed inside a protective foil packet.
Image capture
Image capture could be done with a smartphone, as described in the literature (Bueno et al., 2015; Mei et al., 2016; Chang, 2012; Hong and Chang, 2014; Lopez-Ruiz et al., 2014; Mei et al., 2016; Schaefer, 2014; Shen et al., 2012; Sicard et al., 2015; Smith et al., 2014; Yetisen et al., 2014). Custom hand-held colorimetric devices have also been designed and tested, and in some cases the custom devices outperform commercial smart devices based on signal to noise ratios (Askim and Suslick, 2015; Martinez-Olmos et al., 2011). In order to assure constant lighting conditions to maximize reproducibility, devices with LED lighting could be attached to attach to smartphones (Salles et al., 2014). The cameras on Android and iPhone devices could be used to collect images, process the RGB color data, perform statistical analyses, and identify the chemical analyte. The incorporation of grid-based sensor selections or pattern recognition software would allow for quick automated array analysis. Figure 12 shows an in-house designed smartphone app that automates image collection, image processing, and statistical analysis to identify the compounds in the sample.
Figure 12.
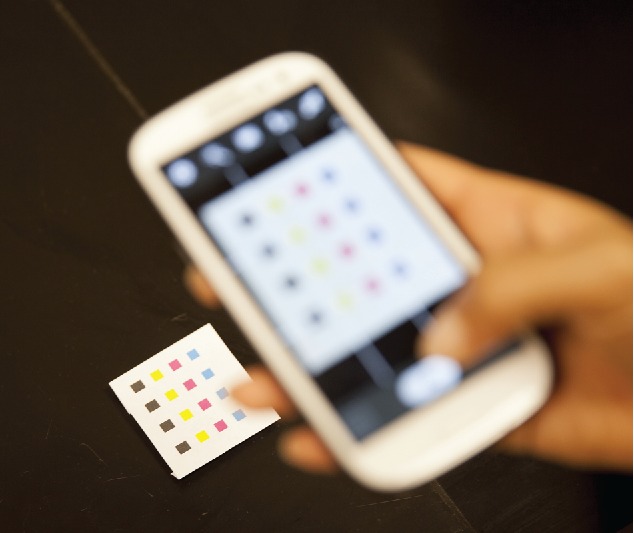
Image collection with a smartphone. With a built in camera and processing power, a smart device could easily be used as the basis for an inexpensive, portable chemical identification system.
Image analysis with smartphones
After the image is obtained, a smart phone app for RGB analysis for sensing arrays (Chang, 2012; Hong and Chang, 2014; Schaefer, 2014; Shen et al., 2012) could be used to apply preprocessing steps such as lighting/background corrections or subtraction of a blank or control sample (Yetisen et al., 2014). In addition, RGB data can be converted to another color space such as hue, saturation, and value (HSV), which has been successfully used for analyzing colorimetric data (Cantrell et al., 2010; Hong and Chang, 2014). The image analysis and identification of the analyte could be done using PCA or any other clustering/identification algorithms described previously.
Data storage and dissemination
The storage of experimental results and images would occur locally on the phone itself. The data could then be emailed, shared on a Google drive, or transmitted via a secure cloud to a web-based secure central server for storage and access by authorized personnel. Figure 13 shows how a typical array could be analyzed using an app on a smartphone, followed by data export using various modes, such as Wi-Fi, email, Bluetooth, or Google drive.
Figure 13.
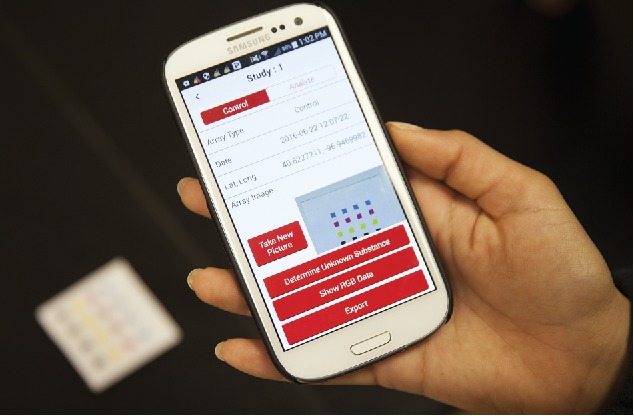
An example of a smartphone app for data collection and analysis. A smartphone with an appropriately designed app can automate the image collection, image processing, and sample identification steps and serve as a simple user-friendly device.
Important considerations for field testing of colorimetric arrays
Quality control
Inconsistent results can cause many problems including false positive and false negatives. To achieve reliable results, quality control is required during all steps of the analysis including printing arrays, image collection, as well as data processing and analysis. A quality control plan should be implemented in order ensure that the all printed arrays give consistent results and can be compared to a library of responses for known compounds. Control charting is an effective method to ensure there are no changes to a process over time, and this could be implemented by measuring the colors of the inks and printed arrays and plotting them on appropriate charts. The RGB values overtime should not change significantly. Figure 14 shows such a control chart for the red component values for bromophenol blue used in-house.
Figure 14.
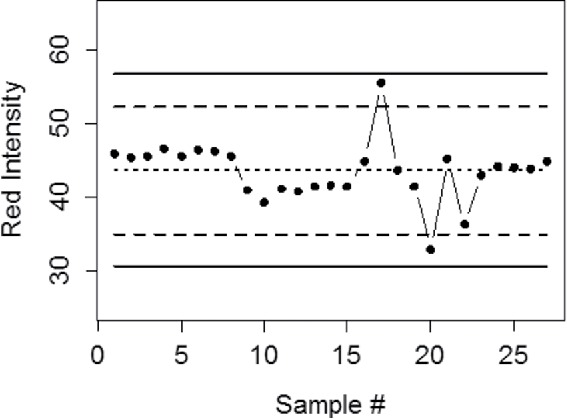
In-house created control chart for the red channel bromophenol blue. The points are measurements, and show that the sensor has not changed over many measurements. The solid lines are 3-standard deviation control limits, and the dashed lines are 2-standard deviation upper and lower warning lines.
The precision of the RGB values for the imaging device must be tested. Furthermore, in order to test the reproducibility of the imaging devices, multiple images of a single colorimetric array should be captured and analyzed for consistency. The performance depends on the imaging device, and deviations of approximately 1 RGB unit can be achieved with a smartphone. In order to test the reproducibility of printing, multiple duplicate sensors in one array and between multiple arrays must be compared, and the RGB ranges should be statistically the same. All tests with controls and analytes must yield consistent results when analyzed with PCA or any other statistical method.
Shelf life
A literature review of the shelf life of colorimetric arrays indicates that limited data has been published on this topic. However, the stability of colorimetric arrays, over a period of at least several months or years, is an important consideration for practical applications, and stability could be an important factor in developing sensor arrays. If sensors show color changes during a test range due to sensitivity to light, the selection of a proper storage container, such as, a foil packet stuffed with a desiccator would likely improve the shelf life of these sensors.
Conclusion
Improving the detection of explosives and chemical warfare agents in the field is a pressing need. A number of promising technologies currently exist, but many of these techniques require expensive and bulky instrumentation which makes them less than ideal for field applications. Herein, we examined the application of colorimetric sensor arrays for field deployment for the detection of explosives and chemical agents. Recent results have shown that these devices can effectively detect such analytes. The sensors can be efficiently fabricated on solid supports, and imaging/processing can be done with commercially available smart devices; therefore, this technology has the potential for mass production and deployment. In addition, the minimal instrumentation requirements allow colorimetric arrays to be lightweight and portable, meaning they could replace bulky, conventional equipment. Finally, since the currently used DRSKO kit contains numerous different types of detection systems to identify very specific compounds, colorimetric arrays could potentially reduce the number of instruments or replace them with just one test for many analytes.
Acknowledgments
The authors wish to thank Laramie Jameson and Andrew Mattson for assistance in preparing the manuscript.
Funding
The authors are also grateful to the National Institute for General Medical Science (NIGMS) (5P20GM103427), a component of the National Institutes of Health (NIH), and the National Science Foundation (NSF) NSF-EPSCoR-EPS-1004094, the Camille and Henry Dreyfus Foundation (AH-2015 Dreyfus Teacher Scholar Award), and the US Army W911SR-15-C-0027 SBIR Phase I - Chemical Biological Radiological Nuclear and Explosives (CBRNE) Reconnaissance Sampling Kit (A15-048).
References
- Afkhami A.; Sarlak N.. A Novel Cyanide Sensing Phase Based on Immobilization of Methyl Violet on A Triacetylcellulose Membrane. Sens. Actuators B: Chem. 2007, , 437–441. doi: 10.1016/j.snb.2006.06.012 [DOI] [Google Scholar]
- Alkasir R. S. J.; Rossner A.; Andreescu S.. Portable Colorimetric Paper-Based Biosensing Device for the Assessment of Bisphenol A in Indoor Dust. Environ. Sci. Technol. 2015, , 9889–9897. doi: 10.1021/acs.est.5b01588 [DOI] [PubMed] [Google Scholar]
- Amani M.; Chu Y.; Waterman K. L.; Hurley C. M.; Platek M. J.; Gregory O. J.. Detection of Triacetone Triperoxide (TATP) Using a Thermodynamic Based Gas Sensor. Sens. Actuators B: Chem. 2012, , 7–13. doi: 10.1016/j.snb.2011.11.019 [DOI] [Google Scholar]
- Ariza-Avidad M.; Salinas-Castillo A.; Cuéllar M. P.; Agudo-Acemel M.; Pegalajar M. C.; Capitán-Vallvey L. F.. Printed Disposable Colorimetric Array for Metal Ion Discrimination. Anal. Chem. 2014, , 8634–8641. doi: 10.1021/ac501670f [DOI] [PubMed] [Google Scholar]
- Arrayit Corporation [WWW Document]. http://shop.arrayit.com/ Accessed on June.17.16, 2016.
- Askim J. R.; Li Z.; LaGasse M. K.; Rankin J. M.; Suslick K. S.. An Optoelectronic Nose for Identification of Explosives. Chem. Sci. 2016, , 199–206. doi: 10.1039/C5SC02632F [DOI] [PMC free article] [PubMed] [Google Scholar]
- Askim J. R.; Mahmoudi M.; Suslick K. S.. Optical Sensor Arrays for Chemical Sensing: The Optoelectronic Nose. Chem. Soc. Rev. 2013, , 8649–8682. doi: 10.1039/C3CS60179J [DOI] [PubMed] [Google Scholar]
- Askim J. R.; Suslick K. S.. Hand-Held Reader for Colorimetric Sensor Arrays. Anal. Chem. 2015, , 7810–7816. doi: 10.1021/acs.analchem.5b01499 [DOI] [PubMed] [Google Scholar]
- Asynchrony Labs Mobile Field Kit (MFK) http://www.asynchrony.com/products/mobile-Field-Kit/ Accessed on January.08.16
- Bang J. H.; Lim S. H.; Park E.; Suslick K. S.. Chemically Responsive Nanoporous Pigments: Colorimetric Sensor Arrays and the Identification of Aliphatic Amines. Langmuir. 2008, , 13168–13172. doi: 10.1021/la802029m [DOI] [PMC free article] [PubMed] [Google Scholar]
- Barker J. Mass Spectrometry: Analytical Chemistry by Open Learning. John Wiley & Sons, Inc.: Chichester, 1999, 2nd . [Google Scholar]
- Batista É. F.; Augusto A. dos S.; Pereira-Filho E. R.. Determination of Cd, Co, Cr, Cu, Ni and Pb in Cosmetic Samples Using a Simple Method for Sample Preparation. Anal. Methods 2015, , 329–335. doi: 10.1039/C4AY02484B [DOI] [Google Scholar]
- Batres G.; Jones T.; Johnke H.; Wilson M.; Holmes A. E.; Sikich S.. Reactive Arrays of Colorimetric Sensors for Metabolite and Steroid Identification. J. Sens. Technol. 2014, , 1–6. doi: 10.4236/jst.2014.41001 [DOI] [PMC free article] [PubMed] [Google Scholar]
- Baumes L. A.; Buaki Sogo M.; Montes-Navajas P.; Corma A.; Garcia H.. A Colorimetric Sensor Array for the Detection of the Date-Rape Drug γ-Hydroxybutyric Acid (GHB): A Supramolecular Approach. Chem. Eur. J. 2010, , 4489–4495. doi: 10.1002/chem.200903127 [DOI] [PubMed] [Google Scholar]
- Berezow A. How Chemists Plan to Sniff Out Bombs. BBC. http://www.bbc.com/news/science-environment-35022731, 2015. [Google Scholar]
- Bernacka-Wojcik I.; Senadeera R.; Wojcik P. J.; Silva L. B.; Doria G.; Baptista P.; Aguas H.; Fortunato E.; Martins R.. Inkjet Printed and “Doctor Blade” TiO2 Photodetectors for DNA Biosensors. Biosens. Bioelectron. 2010, , 1229–1234. doi: 10.1016/j.bios.2009.09.027 [DOI] [PubMed] [Google Scholar]
- Bjella K. L. Pre-Screening for Explosives Residues in Soil Prior to HPLC Analysis Utilizing Expray. Technical Report No. ERDC/CRREL TN-05-2. U.S. Army Engineer Research and Development Center: Hanover, NH, 2005. [Google Scholar]
- Bueno L.; Meloni G. N.; Reddy S.; Paixão T. R. L. C.. Use of Plastic-Based Analytical Device, Smartphone and Chemometric Tools to Discriminate Amines. RSC Adv. 2015, , 20148–20154. doi: 10.1039/c5ra01822f [DOI] [Google Scholar]
- Burks R. M.; Hage D. S.. Current Trends in the Detection of Peroxide-Based Explosives. Anal. Bioanal. Chem. 2009, , 301–313. doi: 10.1007/s00216-009-2968-5 [DOI] [PubMed] [Google Scholar]
- Burks R. M.; Pacquette S. E.; Guericke M. A.; Wilson M. V.; Symonsbergen D. J.; Lucas K. A.; Holmes A. E.. DETECHIP: A Sensor for Drugs of Abuse. J. Forensic Sci. 2010, , 723–727. doi: 10.1111/j.1556-4029.2010.01323.x [DOI] [PubMed] [Google Scholar]
- Burstein D. D. Fast Future: How the Millennial Generation is Shaping Our World. Beacon Press: Boston, 2014. [Google Scholar]
- Cantrell K.; Erenas M. M.; Orbe-Payá I. de; Capitán-Vallvey L. F.. Use of the Hue Parameter of the Hue, Saturation, Value Color Space As a Quantitative Analytical Parameter for Bitonal Optical Sensors. Anal. Chem. 2010, , 531–542. doi: 10.1021/ac901753c [DOI] [PubMed] [Google Scholar]
- Capel-Cuevas S.; Cuéllar M. P.; Orbe-Payá I. de; Pegalajar M. C.; Capitán-Vallvey L. F.. Full-Range Optical pH Sensor Based on Imaging Techniques. Anal. Chim. Acta. 2010, , 71–81. doi: 10.1016/j.aca.2010.09.033 [DOI] [PubMed] [Google Scholar]
- Capitán-Vallvey L. F.; López-Ruiz N.; Martínez-Olmos A.; Erena M. M.; Palma A. J.. Recent Developments in Computer Vision-Based Analytical Chemistry: A Tutorial Review. Anal. Chim. Acta. 2015, , 23–56. doi: 10.1016/j.aca.2015.10.009 [DOI] [PubMed] [Google Scholar]
- Carey J. R.; Suslick K. S.; Hulkower K. I.; Imlay J. A.; Imlay K. R. C.; Ingison C. K.; Ponder J. B.; Sen A.; Wittrig A. E.. Rapid Identification of Bacteria with a Disposable Colorimetric Sensing Array. J. Am. Chem. Soc. 2011, , 7571–7576. doi: 10.1021/ja201634d [DOI] [PMC free article] [PubMed] [Google Scholar]
- Cate D. M.; Noblitt S. D.; Volckens J.; Henry C. S.. Multiplexed Paper Analytical Device for Quantification of Metals using Distance-Based Detection. Lab Chip 2015, , 2808–2818. doi: 10.1039/C5LC00364D [DOI] [PMC free article] [PubMed] [Google Scholar]
- Caygill J. S.; Davis F.; Higson S. P. J.. Current Trends in Explosive Detection Techniques. Talanta 2012, , 14–29. doi: 10.1016/j.talanta.2011.11.043 [DOI] [PubMed] [Google Scholar]
- Chang B.-Y. Smartphone-Based Chemistry Instrumentation: Digitization of Colorimetric Measurements. Bull. Korean Chem. Soc. 2012, , 549–552. doi: 10.5012/bkcs.2012.33.2.549 [DOI] [Google Scholar]
- Chemical, Biological, Radiological, & Nuclear Information Resource Center (CBRN IRC) Dismounted Reconnaissance Sets Kits and Outfits: DR SKO. https://jacks.jpeocbd.army.mil/Jacks/Public/FactSheetProvider.aspx?productId=447 Accessed on June.21.16, 2014.
- Cheng J.; Kricka L. J. (Eds.). Biochip Technology. Harwood Academic Publishers: Australia, 2003. [Google Scholar]
- Chu Y.; Mallin D.; Amani M.; Platek M. J.; Gregory O. J.. Detection of Peroxides Using Pd/SnO2 Nanocomposite Catalysts. Sens. Actuators B: Chem. 2014, , 376–384. doi: 10.1016/j.snb.2014.03.009 [DOI] [Google Scholar]
- Chulvi K.; Gaviña P.; Costero A. M.; Gil S.; Parra M.; Gotor R.; Royo S.; Martínez-Máñez R.; Sancenóna F.; Vivancos J.-L.. Discrimination of Nerve Gases Mimics and Other Organophosphorous Derivatives in Gas Phase Using a Colorimetric Probe Array. Chem. Commun. 2012, , 10105–10107. doi: 10.1039/C2CC34662A [DOI] [PubMed] [Google Scholar]
- Costa M. N.; Veigas B.; Jacob J. M.; Santos D. S.; Gomes J.; Baptista P. V.; Martins R.; Inácio J.; Fortunato E.. A Low Cost, Safe, Disposable, Rapid and Self-Sustainable Paper-Based Platform for Diagnostic Testing: Lab-on-Paper. Nanotechnology 2014, , 94006. doi: 10.1088/0957-4484/25/9/094006 [DOI] [PubMed] [Google Scholar]
- Costero A. M.; Gil S.; Parra M.; Mancini P. M. E.; Martínez-Máñez R.; Sancenón F.; Royo S.. Chromogenic Detection of Nerve Agent Mimics. Chem. Commun. 2008, 6002–6004. doi: 10.1039/B811247A [DOI] [PubMed] [Google Scholar]
- Cuéllar M. P.; Capel-Cuevas S.; Pegalajar M. C.; de Orbe-Payá I.; Capitán-Vallvey L. F.. Minimization of Sensing Elements for Full-Range Optical pH Device Formulation. New J. Chem., Cuéllar 2011, , 1042–1053. doi: 10.1039/C0NJ00951B [DOI] [Google Scholar]
- Curto V. F.; Fay C.; Coyle S.; Byrne R.; O'Toole C.; Barry C.; Hughes S.; Moyna N.; Diamond D.; Benito-Lopez F.. Real-Time Sweat pH Monitoring Based on a Wearable Chemical Barcode Micro-Fluidic Platform Incorporating Ionic Liquids. Sens. Actuators B: Chem. 2012, , 1327–1334. doi: 10.1016/j.snb.2012.06.048 [DOI] [Google Scholar]
- Deiner A.; Vigus E. S.. The Analysis of B-1 Dye (1,P- Nitrophenylazo 2, Naphthylamine) by Ultraviolet-Visible Spectroscopy and Thin Layer Chromatography. Technical Report No. ARCSL-TR-81057. ARMY Armament Research and Development Command: Aberdeen Proving Ground, MD, 1981. [Google Scholar]
- ECBC Public Affairs Explosives Detection Kit Ready to Enter New Acquisition Phase. Official Homepage of U.S. Army; http://www.army.mil/article/125449/Explosives_detection_kit_ready_to_enter_new_acquisition_phase/ Accessed on January.11.16, 2014. [Google Scholar]
- Faulstich K.; Haberstroh K.; Gruler R.; Eberhard M.; Wiest T.; Lentzsch D.. Handheld and Portable Test Systems for Immunodiagnostics, Nucleic Acid Detection and More. Proc. SPIE: Opt. Photon. Glob. Homeland Security IV 2008, , p. 69450H, doi: 10.1117/12.782171 [DOI] [Google Scholar]
- Feng L.; Li H.; Li X.; Chen L.; Shen Z.; Guan Y.. Colorimetric Sensing of Anions in Water Using Ratiometric Indicator-Displacement Assay. Anal. Chim. Acta. 2012, , 1–8. doi: 10.1016/j.aca.2012.06.041 [DOI] [PubMed] [Google Scholar]
- Feng L.; Musto C. J.; Kemling J. W.; Lim S. H.; Suslick K. S.. A Colorimetric Sensor Array for Identification of Toxic Gases Below Permissible Exposure Limits. Chem. Commun. 2010a, , 2037–2039. doi: 10.1039/B926848K [DOI] [PMC free article] [PubMed] [Google Scholar]
- Feng L.; Musto C. J.; Kemling J. W.; Lim S. H.; Zhong W.; Suslick K. S.. Colorimetric Sensor Array for Determination and Identification of Toxic Industrial Chemicals. Anal. Chem. 2010b, , 9433–9440. doi: 10.1021/ac1020886 [DOI] [PubMed] [Google Scholar]
- Feng L.; Musto C. J.; Suslick K. S.. A Simple and Highly Sensitive Colorimetric Detection Method for Gaseous Formaldehyde. J. Am. Chem. Soc. 2010c, , 4046–4047. doi: 10.1021/ja910366p [DOI] [PMC free article] [PubMed] [Google Scholar]
- Gan S. D.; Patel K. R.. Enzyme Immunoassay and Enzyme-Linked Immunosorbent Assay. J. Invest. Dermatol. 2013, , e12. doi: 10.1038/jid.2013.287 [DOI] [PubMed] [Google Scholar]
- Germain M. E.; Knapp M. J.. Optical Explosives Detection: From Color Changes to Fluorescence Turn-On. Chem. Soc. Rev. 2009, , 2543–2555. doi: 10.1039/B809631G [DOI] [PubMed] [Google Scholar]
- GeSiM Integrating Worlds Micro Macro Technol. About GeSiM. http://gesim-bioinstruments-microfluidics.com/about-us/ Accessed on June.17.16, 2015.
- Gotor R.; Costero A. M.; Gil S.; Parra M.; Martínez-Máñez R.; Sancenón F.. A Molecular Probe for the Highly Selective Chromogenic Detection of DFP, a Mimic of Sarin and Soman Nerve Agents. Chem. Eur. J. 2011, , 11994–11997. doi: 10.1002/chem.201102241 [DOI] [PubMed] [Google Scholar]
- Graham R. C. Data Analysis for the Chemical Sciences: A Guide to Statistical Techniques. VCH Publishers, Inc.: New York, 1993. [Google Scholar]
- Griffatini K. Paper Diagnostic Tests. MIT Technol. Rev. 2009, 112, 44–46. [Google Scholar]
- Harris C. M. Product Review: GC to Go. Anal. Chem. 2002, , 585A–589A. doi: 10.1021/ac0221536 [DOI] [PubMed] [Google Scholar]
- Hill H. H. Jr.; Martin S. J.. Conventional Analytical Methods for Chemical Warfare Agents. Pure Appl. Chem. 2002, , 2281–2291. doi: 10.1351/pac200274122281 [DOI] [Google Scholar]
- Holmes A. Detechip: Molecular Color and Fluorescent Sensor Arrays for Small Molecules. US Patent 2010/0197516 A1, 2010.
- Hong J. I.; Chang B.-Y.. Development of The Smartphone-Based Colorimetry for Multi-Analyte Sensing Arrays. Lab Chip 2014, , 1725–1732. doi: 10.1039/c3lc51451j [DOI] [PubMed] [Google Scholar]
- Horn L. Army Testing iOS, Android Tablets and Smartphones for Combat Use. http://www.pcmag.com/article2/0,2817,2386386,00.asp Accessed on March.02.16, PC Mag, 2011.
- Hossain S. M. Z.; Luckham R. E.; Smith A. M.; Lebert J. M.; Davies L. M.; Pelton R. H.; Filipe C. D. M.; Brennan J. D.. Development of a Bioactive Paper Sensor for Detection of Neurotoxins Using Piezoelectric Inkjet Printing of Sol−Gel-Derived Bioinks. Anal. Chem. 2009, , 5474–5483. doi: 10.1021/ac900660p [DOI] [PubMed] [Google Scholar]
- Hu J.; Wang S.; Wang L.; Li F.; Pingguan-Murphy B.; Lu T. J.; Xu F.. Advances in Paper-Based Point-of-Care Diagnostics. Biosens. Bioelectron. 2014, , 585–597. doi: 10.1016/j.bios.2013.10.075 [DOI] [PubMed] [Google Scholar]
- Huang X.; Zou X.; Shi J.; Guo Y.; Zhao J.; Zhang J.; Hao L.. Determination of Pork Spoilage by Colorimetric Gas Sensor Array Based on Natural Pigments. Food Chem. 2014, , 549–554. doi: 10.1016/j.foodchem.2013.08.101 [DOI] [PubMed] [Google Scholar]
- ICx Technologies ICx Technologies Introduces Fido® Verdict. http://www.businesswire.com/news/home/20090608005149/en/ICx-Technologies-Introduces-Fido%C2%AE-Verdict%E2%84%A2. Accessed on June.08.16, Business Wire, 2009. [Google Scholar]
- InnovaPrep LLC The Macro to Micro Interface. ACD-200 Bobcat. http://innovaprep.com/products/acd-200-bobcat-aerosol-collector/ Accessed on April.08.16, 2013.
- Institute of Medicine Chemical and Biological Terrorism: Research and Development to Improve Civilian Medical Response. The National Academies Press: Washington, DC, 1999. [PubMed] [Google Scholar]
- Janzen M. C.; Ponder J. B.; Bailey D. P.; Ingison C. K.; Suslick K. S.. Colorimetric Sensor Arrays for Volatile Organic Compounds. Anal. Chem. 2006, , 3591–3600. doi: 10.1021/ac052111s [DOI] [PubMed] [Google Scholar]
- Jenkins T. F.; Walsh M. E.. Development of Field Screening Methods for TNT, 2,4-DNT and RDX in Soil. Talanta 1992, , 419–428. doi: 10.1016/0039-9140(92)80158-A [DOI] [PubMed] [Google Scholar]
- Johnke H.; Batres G.; Wilson M.; Holmes A. E.; Sikich S.. Detecting Concentration of Analytes with DETECHIP: A Molecular Sensing Array. J. Sens. Technol. 2013, , 94–99. doi: 10.4236/jst.2013.33015 [DOI] [PMC free article] [PubMed] [Google Scholar]
- Kannan B.; Jahanshahi-Anbuhi S.; Pelton R. H.; Li Y.; Filipe C. D. M.; Brennan J. D.. Printed Paper Sensors for Serum Lactate Dehydrogenase using Pullulan-Based Inks to Immobilize Reagents. Anal. Chem. 2015, , 9288–9293. doi: 10.1021/acs.analchem.5b01923 [DOI] [PubMed] [Google Scholar]
- Kellogg M. Detection of Biological Agents Used for Terrorism: Are We Ready? Clin. Chem. 2010, , 10–15. doi: 10.1373/clinchem.2009.139493 [DOI] [PubMed] [Google Scholar]
- Kelly B. S.; Levy J. G.; Sikora L.. The Use of the Enzyme-Linked Immunosorbent Assay (ELISA) for the Detection and Quantification of Specific Antibody from Cell Cultures. Immunology 1979, , 45–52. [PMC free article] [PubMed] [Google Scholar]
- Kemling J.W.; Suslick K. S.. Nanoscale Porosity in Pigments for Chemical Sensing. Nanoscale 2011, , 1971–1973. doi: 10.1039/C0NR00963F [DOI] [PMC free article] [PubMed] [Google Scholar]
- Kemp R. S. Environmental Detection of Clandestine Nuclear Weapon Programs. Annu. Rev. Earth Planet. Sci. 2016, 44. doi: 10.1146/annurev-earth-060115-012526 [DOI] [Google Scholar]
- Li C.; Vandenberg K.; Prabhulkar S.; Zhu X.; Schneper L.; Methee K.; Rosser C. J.; Almeide E.. Paper Based Point-of-Care Testing Disc for Multiplex Whole Cell Bacteria Analysis. Biosens. Bioelectron. 2011, , 4342–4348. doi: 10.1016/j.bios.2011.04.035 [DOI] [PubMed] [Google Scholar]
- Li Z.; Bassett W. P.; Askim J. R.; Suslick K. S.. Differentiation Among Peroxide Explosives with an Optoelectronic Nose. Chem. Commun. 2015a, , 15312–15315. doi: 10.1039/C5CC06221G [DOI] [PubMed] [Google Scholar]
- Li Z.; Jang M.; Askim J. R.; Suslick K. S.. Identification of Accelerants, Fuels and Post-Combustion Residues Using a Colorimetric Sensor Array. Analyst 2015b, , 5929–5935. doi: 10.1039/C5AN00806A [DOI] [PubMed] [Google Scholar]
- Liana D. D.; Raguse B.; Gooding J. J.; Chow E.. Recent Advances in Paper-Based Sensors. Sensors 2012, , 11505–11526. doi: 10.3390/s120911505 [DOI] [PMC free article] [PubMed] [Google Scholar]
- Lim S. H.; Feng L.; Kemling J. W.; Musto C. J.; Suslick K. S.. An Optoelectronic Nose for the Detection of Toxic Gases. Nat. Chem. 2009, , 562–567. doi: 10.1038/nchem.360 [DOI] [PMC free article] [PubMed] [Google Scholar]
- Lopez-Ruiz N.; Curto V. F.; Erenas M. M.; Benito-Lopez F.; Diamond D.; Palma A. J.; Capitan-Vallvey L. F.. Smartphone-Based Simultaneous pH and Nitrite Colorimetric Determination for Paper Microfluidic Devices. Anal. Chem. 2014, , 9554–9562. doi: 10.1021/ac5019205 [DOI] [PubMed] [Google Scholar]
- Lyon M.; Groathouse J.; Beaber J.; Turner L. M.; Rouhier K. A.; Wilson M. V.; Symonsbergen D. J.; Sikich S. M.; Holmes A. E.. DETECHIP®: An Improved Molecular Sensing Array. J. Forensic Res. 2011, , 1000126. doi: 10.4172/2157-7145.1000126 [DOI] [Google Scholar]
- Lyon M.; Wilson M. V.; Rouhier K. A.; Symonsbergen D. J.; Bastola K.; Thapa I.; Holmes A. E.; Sikich S. M.; Jackson A.. Digital Image Analysis for DETECHIP® Code Determination. Signal Image Process. 2012, , 51–63. doi: 10.5121/sipij.2012.3405 [DOI] [PMC free article] [PubMed] [Google Scholar]
- Mach P. M.; McBride E. M.; Sasiene Z. J.; Brigance K. R.; Kennard S. K.; Wright K. C.; Verbeck G. F.. Vehicle-Mounted Portable Mass Spectrometry System for the Covert Detection via Spatial Analysis of Clandestine Methamphetamine Laboratories. Anal. Chem. 2015, , 11501–11508. doi: 10.1021/acs.analchem.5b03269 [DOI] [PubMed] [Google Scholar]
- Mahmoudi M.; Lohse S. E.; Murphy C. J.; Suslick K. S.. Identification of Nanoparticles with a Colorimetric Sensor Array. ACS Sens. 2016, , 17–21. doi: 10.1021/acssensors.5b00014 [DOI] [Google Scholar]
- Martinez-Olmos A.; Capel-Cuevas S.; López-Ruiz N.; Palma A. J.; Orbe I. de; Capitán-Vallvey L. F.. Sensor Array-Based Optical Portable Instrument for Determination of pH. Sens. Actuators B: Chem. 2011, , 840–848. doi: 10.1016/j.snb.2011.02.052 [DOI] [Google Scholar]
- Marvin B.; Garabino J. J.. The Identification of Barbiturates, Narcotics, and Patented Specialties by X-Ray Defraction. J. Crim. Law Criminol. Police Sci. 1953, , 525–530. doi: 10.2307/1140114 [DOI] [Google Scholar]
- Matos C. R. S.; Costa N. B. Jr.; Gimenez I. F.. Principal Component Analysis of X-ray Diffraction Patterns to Yield Morphological Classification of Brucite Particles. Anal. Chem. 2007, , 2091–2095. doi: 10.1021/ac061991n [DOI] [PubMed] [Google Scholar]
- Mazzone P. J.; Wang X.-F.; Xu Y.; Mekhail T.; Beukemann M. C.; Na J.; Kemling J. W.; Suslick K. S.; Sasidhar M.. Exhaled Breath Analysis with a Colorimetric Sensor Array for the Identification and Characterization of Lung Cancer. J. Thorac. Oncol. 2012, , 137–142. doi: 10.1097/JTO.0b013e318233d80f [DOI] [PMC free article] [PubMed] [Google Scholar]
- McKone T. E.; Huey B. M.; Downing E.; Duffy L. M. (Eds.). Appendix D: Detecting and Monitoring Chemical Agents In Strategies to Protect the Health of Deployed U.S. Forces: Detecting, Characterizing, and Documenting Exposures. National Academy Press: Washington, DC, 2000. [PubMed] [Google Scholar]
- Mei Q.; Huarong J.; Li Y.; Yisibashaer W.; Chen J.; Li B. N.; Zhang Y.. Smartphone Based Visual and Quantitative Assays on Upconversional Paper Sensor. Biosens. Bioelectron. 2016, , 427–432. doi: 10.1016/j.bios.2015.08.054 [DOI] [PubMed] [Google Scholar]
- Mei Q.; Zhang Z.. Photoluminescent Graphene Oxide Ink to Print Sensors onto Microporous Membranes for Versatile Visualization Bioassays. Angew. Chem. Int. Ed. 2012, , 5602–5606. doi: 10.1002/anie.201201389 [DOI] [PubMed] [Google Scholar]
- Minami T.; Esipenko N. A.; Akdeniz A.; Zhang B.; Isaacs L.; Anzenbacher P. Jr.. Multianalyte Sensing of Addictive Over-the-Counter (OTC) Drugs. J. Am. Chem. Soc. 2013, , 15238–15243. doi: 10.1021/ja407722a [DOI] [PubMed] [Google Scholar]
- Morris J. A. Modified Cobalt Thiocyanate Presumptive Color Test for Ketamine Hydrochloride. J. Forensic Sci. 2007, , 84–87. doi: 10.1111/j.1556-4029.2006.00331.x [DOI] [PubMed] [Google Scholar]
- Musto C. J.; Lim S. H.; Suslick K. S.. Colorimetric Detection and Identification of Natural and Artificial Sweeteners. Anal. Chem. 2009, , 6526–6533. doi: 10.1021/ac901019g [DOI] [PMC free article] [PubMed] [Google Scholar]
- Musto C. J.; Suslick K. S.. Differential Sensing of Sugars by Colorimetric Arrays. Curr. Opin. Chem. Biol. 2010, , 758–766. doi: 10.1016/j.cbpa.2010.07.006 [DOI] [PMC free article] [PubMed] [Google Scholar]
- National Institute of Standards and Technology (NIST) Color Test Reagents/Kits for Preliminary Identification of Drugs of Abuse NIJ Standard-0604.01. Technical Report No. NCJ 183258. US Department of Justice: Washington, DC, 2000. [Google Scholar]
- National Research Council Human Exposure Assessment for Airborne Pollutants: Advances and Opportunities. The National Academies Press: Washington, DC, 1991. [Google Scholar]
- National Research Council Technical Assessment of the Man-in-Simulant Test Program. The National Academies Press: Washington, DC, 1997a. [Google Scholar]
- National Research Council Energy-Efficient Technologies for the Dismounted Soldier. The National Academies Press: Washington, DC, 1997b. [Google Scholar]
- National Research Council Tooele Chemical Agent Disposal Facility: Update on National Research Council Recommendations. The National Academies Press: Washington, DC, 1999. [Google Scholar]
- Negrusz A.; Moore C.; Deitermann D.; Lewis D.; Kaleciak K.; Kronstrand R.; Feeley B.; Niedbala R. S.. Highly Sensitive Micro-Plate Enzyme Immunoassay Screening and NCl-GC-MS Confirmation of Flunitrazepam and Its Major Metabolite 7-Aminoflunitrazepam in Hair. J. Anal. Toxicol. 1999, , 429–435. doi: 10.1093/jat/23.6.429 [DOI] [PubMed] [Google Scholar]
- O'Neal C. L.; Crouch D. J.; Fatah A. A.. Validation of Twelve Chemical Spot Tests for the Detection of Drugs of Abuse. Forensic Sci. Int. 2000, , 189–201. doi: 10.1016/S0379-0738(99)00235-2 [DOI] [PubMed] [Google Scholar]
- Okuom M. O.; Holmes A. E.. Developing a Color-Based Molecular Sensing Device: DETECHIP®. Sens. Transducers, 2014, , 30–33. [Google Scholar]
- Palacios M. A.; Nishiyabu R.; Marquez M.; Anzenbacher P. Jr.. Supramolecular Chemistry Approach to the Design of a High-Resolution Sensor Array for Multianion Detection in Water. J. Am. Chem. Soc. 2007, , 7538–7544. doi: 10.1021/ja0704784 [DOI] [PubMed] [Google Scholar]
- Parolo C.; Merkoci A.. Paper-Based Nanobiosensors for Diagnostics. Chem. Soc. Rev. 2013, , 450–457. doi: 10.1039/C2CS35255A [DOI] [PubMed] [Google Scholar]
- Patton C. J.; Rawlinson M. B.; Pappe P. J.. NanoLAB, an Automatic, Field Deployable Analyzer for Nutrient Determinations Using Discrete Sample Aliquots. In: Abstracts of Papers, 234th ACS National Meeting, Boston, MA, United States, August19–23, 2007 American Chemical Society, 2007, p. ENVR–076. [Google Scholar]
- Perkins M. D.; Kessel M.. What Ebola Tells us About Outbreak Diagnostic Readiness. Nat. Biotechnol. 2015, , 464–469. doi: 10.1038/nbt.3215 [DOI] [PubMed] [Google Scholar]
- Peters K. L.; Corbin I.; Kaufman L. M.; Zreibe K.; Blanes L.; McCord B. R.. Simultaneous Colorimetric Detection of Improvised Explosive Compounds Using Microfluidic Paper-Based Analytical Devices (μPADs). Anal. Methods 2015, , 63–70. doi: 10.1039/C4AY01677G [DOI] [Google Scholar]
- Qian S.; Leng Y.; Lin H.. Strong Base Pre-Treatment for Colorimetric Sensor Array Detection and Identification of N-Methyl Carbamate Pesticides. RSC Adv. 2016, , 7902–7907. doi: 10.1039/C5RA25805G [DOI] [Google Scholar]
- Qian S.; Lin H.. Colorimetric Sensor Array for Detection and Identification of Organophosphorus and Carbamate Pesticides. Anal. Chem. 2015, , 5395–5400. doi: 10.1021/acs.analchem.5b00738 [DOI] [PubMed] [Google Scholar]
- R Core Team R: A Language and Environment for Statistical Computing. R Foundation for Statistical Computing: Vienna, Austria, 2015. [Google Scholar]
- Rakow N. A.; Suslick K. S.. A Colorimetric Sensor Array for Odour Visualization. Nature 2000, , 710–713. doi: 10.1038/35021028 [DOI] [PubMed] [Google Scholar]
- Ranft A.; Niekiel F.; Pavlichenko I.; Stock N.; Lotsch B.V.. Tandem MOF-Based Photonic Crystals for Enhanced Analyte-Specific Optical Detection. Chem. Mater. 2015, , 1961–1970. doi: 10.1021/cm503640c [DOI] [Google Scholar]
- Rankin J. M.; Zhang Q.; LaGasse M. K.; Zhang Y.; Askim J. R.; Suslick K. S.. Solvatochromic Sensor Array for the Identification of Common Organic Solvents. Analyst. 2015, , 2613–2617. doi: 10.1039/C4AN02253J [DOI] [PubMed] [Google Scholar]
- Safavi A.; Maleki N.; Rostamzadeh A.; Maesum S.. CCD Camera Full Range pH Sensor Array. Talanta 2007, , 498–501. doi: 10.1016/j.talanta.2006.04.030 [DOI] [PubMed] [Google Scholar]
- Sajid M.; Kawde A.-N.; Daud M.. Designs, Formats and Applications of Lateral Flow Assay: A Literature Review. J. Saudi Chem. Soc. 2015, , 689–705. doi: 10.1016/j.jscs.2014.09.001 [DOI] [Google Scholar]
- Salinas Y.; Martínez-Máñez R.; Marcos M. D.; Sancenón F.; Costero A. M.; Parra M.; Gil S.. Optical Chemosensors and Reagents to Detect Explosives. Chem. Soc. Rev. 2012, , 1261–1296. doi: 10.1039/C1CS15173H [DOI] [PubMed] [Google Scholar]
- Salinas Y.; Ros-Lis J. V.; Vivancos J.-L.; Martínez-Máñez R.; Aucejo S.; Herranz N.; Lorente I.; Garcia E.. A Chromogenic Sensor Array for Boiled Marinated Turkey Freshness Monitoring. Sens. Actuators B: Chem. 2014a, , 326–333. doi: 10.1016/j.snb.2013.08.075 [DOI] [Google Scholar]
- Salinas Y.; Ros-Lis J. V.; Vivancos J.-L.; Martínez-Máñez R.; Marcos M. D.; Aucejo S.; Herranz N.; Lorente I.; Garcia E.. A Novel Colorimetric Sensor Array for Monitoring Fresh Pork Sausages Spoilage. Food Control 2014b, , 166–176. doi: 10.1016/j.foodcont.2013.06.043 [DOI] [Google Scholar]
- Salles M. O.; Meloni G. N.; de Aaujo W. R.; Paixão T. R. L. C.. Explosive Colorimetric Discrimination Using a Smartphone, Paper Device and Chemometrical Approach. Anal. Methods 2014, , 2047–2052. doi: 10.1039/c3ay41727a [DOI] [Google Scholar]
- SBIR ARMY 15.1 Small Business Innovation Research (SBIR) Proposal Submission Instructions. http://www.acq.osd.mil/osbp/sbir/solicitations/sbir20151/army151.htm Accessed 04.08.16, 2015. [Google Scholar]
- Schaefer S. Colorimetric Water Quality Sensing with Mobile Smart Phones. The University of British Columbia: Okanagan, 2014. [Google Scholar]
- Schneider C. A.; Rasband W. S.; Eliceiri K. W.. NIH Image to ImageJ: 25 Years of Image Analysis. Nat. Methods 2012, , 671–675. doi: 10.1038/nmeth.2089 [DOI] [PMC free article] [PubMed] [Google Scholar]
- Schulte-Ladbeck R.; Vogel M.; Karst U.. Recent Methods for the Determination of Peroxide-Based Explosives. Anal. Bioanal. Chem. 2006, , 559–565. doi: 10.1007/s00216-006-0579-y [DOI] [PubMed] [Google Scholar]
- Selby Rachel C. DRSKO Project Ramping up Quickly to Production. US Army; https://www.army.mil/article/131773/DRSKO_project_ramping_up_quickly_to_production/ Accessed on June.17.16 2014. [Google Scholar]
- Sener G.; Uzun L.; Denizli A.. Colorimetric Sensor Array Based on Gold Nanoparticles and AminoAcids for Identification of Toxic Metal Ions in Water. ACS Appl. Mater. Interfaces 2014, , 18395–18400. doi: 10.1021/am5071283 [DOI] [PubMed] [Google Scholar]
- Sharma S. P.; Lahiri S. C.. A Rapid and Low Cost Sensitive Method of On- spot Detection of RDX (Cyclonite). J. Indian Chem. Soc. 2006, , 934–935. [Google Scholar]
- Shen L.; Hagen J. A.; Papautsky I.. Point-of-Care Colorimetric Detection with a Smartphone. Lab Chip 2012, , 4240–4243. doi: 10.1039/C2LC40741H [DOI] [PubMed] [Google Scholar]
- Sicard C.; Glen C.; Aubie B.; Wallace D.; Jahanshahi-Anbuhi S.; Pennings K.; Daigger G. T.; Pelton R.; Brennan J. D.; Filipe C. D. M.. Tools for Water Quality Monitoring and Mapping Using Paper-Based Sensors and Cell Phones. Water Res. 2015, , 360–369. doi: 10.1016/j.watres.2014.12.005 [DOI] [PubMed] [Google Scholar]
- Sickles J. War on Terror Taking a Toll on Bomb Dog Supply. Yahoo News; https://www.yahoo.com/news/bomb-dogs-shortage-us-homeland-security-airport-195929824.html Accessed on March.25.16, 2016. [Google Scholar]
- Sidell F. R. Chemical Warfare Agents, In: Military Preventive Medicine: Mobilization and Deployment, Textbooks of Military Medicine; Kelley P. W., Ed.; Borden Institute, Walter Reed Army Medical Center: Washington, DC, 2003; pp. 611–625. [Google Scholar]
- Skehan P.; Storeng R.; Scudiero D.; Monks A.; McMahon J.; Vistica D.; Warren J. T.; Bokesch H.; Kenney S.; Boyd M. R.. New Colorimetric Cytotoxicity Assay for Anticancer-Drug Screening. J. Natl. Cancer Inst. 1990, , 1107–1112. doi: 10.1093/jnci/82.13.1107 [DOI] [PubMed] [Google Scholar]
- Smith A.; Jackson A.; Wilson M. V.; Trauernicht M.; Holmes A. E.. Improved Image Analysis of DETECHIP® Allows for Increased Specificity in Drug Discrimination. J. Forensic Res. 2012, , 100161. doi: 10.4172/2157-7145.1000161 [DOI] [PMC free article] [PubMed] [Google Scholar]
- Smith J. E.; Griffin D. K.; Leny J. K.; Hagen J. A.; Chávez J. L.; Kelley-Loughnane N.. Colorimetric Detection with Aptamer-Gold Nanoparticle Conjugates Coupled to an Android-Based Color Analysis Application for Use in the Field. Talanta 2014, , 247–255. doi: 10.1016/j.talanta.2013.12.062 [DOI] [PubMed] [Google Scholar]
- Snyder D. T.; Pulliam C. J.; Ouyang Z.; Cooks R. G.. Miniature and Fieldable Mass Spectrometers: Recent Advances. Anal. Chem. 2016, , 2–29. doi: 10.1021/acs.analchem.5b03070 [DOI] [PMC free article] [PubMed] [Google Scholar]
- Soga T.; Jimbo Y.; Suzuki K.; Citterio D.. Inkjet-Printed Paper-Based Colorimetric Sensor Array for the Discrimination of Volatile Primary Amines. Anal. Chem. 2013, , 8973–8978. doi: 10.1021/ac402070z [DOI] [PubMed] [Google Scholar]
- Soldat D. J.; Barak P.; Lepore B. J.. Microscale Colorimetric Analysis Using a Desktop Scanner and Automated Digital Image Analysis Douglas. J. Chem. Educ. 2009, , 617–620. doi: 10.1021/ed086p617 [DOI] [Google Scholar]
- Sudweeks W. B.; Clark G. M.; Chen F. M.. Chemical Explosives and Rocket Propellants In: Riegel's Handbook of Industrial Chemistry; Kent J. A., Ed.; Springer Science+Business Media, LLC: New York, 1992. [Google Scholar]
- Suslick B. A.; Feng L.; Suslick K. S.. Discrimination of Complex Mixtures by a Colorimetric Sensor Array: Coffee Aromas. Anal. Chem. 2010, , 2067–2073. doi: 10.1021/ac902823w [DOI] [PMC free article] [PubMed] [Google Scholar]
- Suslick K. S. An Optoelectronic Nose:“Seeing” Smells by Means of Colorimetric Sensor Arrays. MRS Bull. 2004, , 720–725. doi: 10.1557/mrs2004.209 [DOI] [PubMed] [Google Scholar]
- Suslick K. S.; Bailey D. P.; Ingison C. K.; Janzen M.; Kosal M. E.; McNamara W. B. III; Rakow N. A.; Sen A.; Weaver J. J.; Wilson J. B.; Zhang C.; Nakagaki S.. Seeing Smells: Development of an Optoelectronic Nose. Quím. Nova 2007, , 677–681. doi: 10.1590/S0100-40422007000300029 [DOI] [Google Scholar]
- Švábenská E. Systems for Detection and Identification of Biological Aerosols. Def. Sci. J. 2012, , 404–411. doi: 10.14429/dsj.62.1251 [DOI] [Google Scholar]
- S2 Threat Detection Technologies Dry Explosive Test Kit. http://iabs.com/dry-explosive-test-kits/ Accessed on January.12.16, 2015.
- Turner R. B. Transitioning Analytical Instrumentation from the Laboratory to Harsh Environments. Pure Appl. Chem. 2002, , 2317–2322. doi: 10.1351/pac200274122317 [DOI] [Google Scholar]
- US Department of Defense The Fox NBC Reconnaissance Vehicle Information Paper GULFLINK: Office of the Special Assistant for Gulf War Illnesses http://www.gulflink.osd.mil/fox_vehicle_ii/index.html Accessed on June.21.16, 2001. [Google Scholar]
- Veerabuthiran S.; Razdan A. K.. LIDAR for Detection of Chemical and Biological Warfare Agents. Def. Sci. J. 2011, , 241–250. doi: 10.14429/dsj.61.556 [DOI] [Google Scholar]
- Williams P.; Pate M. E.; Holmes A.; Burks R.. Colorimetric Sensors for the Detection of Explosives and Explosive Residues. Presented at the CBRNe Convergence, Orlando, FL, 2015. [Google Scholar]
- Wing N. When Probable Cause Looks More Like “Meh, Maybe?” Cause. 2015. [Google Scholar]
- Wold S.; Johansson E.; Jellum E.; Bjørnson I.; Nesbakken R.. Application of Simca Multivariate Data Analysis to the Classification of Gas Chromatographic Profiles of Human Brain Tissues. Anal. Chim. Acta 1981, , 251–259. doi: 10.1016/S0003-2670(01)83199-8 [DOI] [Google Scholar]
- Workman J. Jr.; Koch M.; Lavine B.; Chrisman R.. Process Analytical Chemistry. Anal. Chem. 2009, , 4623–4643. doi: 10.1021/ac900778y [DOI] [PubMed] [Google Scholar]
- Xu S.; Lu X.; Yao C.; Huang F.; Jiang H.; Hua W.; Na N.; Liu H.; Ouyang J.. A Visual Sensor Array for Pattern Recognition Analysis of Proteins Using Novel Blue-Emitting Fluorescent Gold Nanoclusters. Anal. Chem. 2014, , 11634–11639. doi: 10.1021/ac502643s [DOI] [PubMed] [Google Scholar]
- Yetisen A. K.; Akram M. S.; Lowe C. R.. Paper-Based Microfluidic Point-of-Care Diagnostic Devices. Lab Chip 2013, , 2210–2251. doi: 10.1039/C3LC50169H [DOI] [PubMed] [Google Scholar]
- Yetisen A. K.; Martinez-Hurtado J. L.; Garcia-Melendrez A.; Vasconcellos F. da C.; Lowe C. R.. A smartphone algorithm with inter-phone repeatability for the analysis of colorimetric tests. Sens. Actuators B: Chem. 2014, , 156–160. doi: 10.1016/j.snb.2014.01.077 [DOI] [Google Scholar]
- Zhang C.; Bailey D. P.; Suslick K. S.. Colorimetric Sensor Arrays for the Analysis of Beers: A Feasibility Study. J. Agric. Food Chem. 2006, , 4925–4931. doi: 10.1021/jf060110a [DOI] [PubMed] [Google Scholar]
- Zhang C.; Suslick K. S.. A Colorimetric Sensor Array for Organics in Water. J. Am. Chem. Soc. 2005, , 11548–11549. doi: 10.1021/ja052606z [DOI] [PubMed] [Google Scholar]
- Zhang C.; Suslick K. S.. Colorimetric Sensor Array for Soft Drink Analysis. J. Agric. Food Chem. 2007, , 237–242. doi: 10.1021/jf0624695 [DOI] [PubMed] [Google Scholar]
- Zhang Y.; Askim J. R.; Zhong W.; Orlean P.; Suslick K. S.. Identification of Pathogenic Fungi with an Optoelectronic Nose. Analyst 2014, , 1922–1928. doi: 10.1039/C3AN02112B [DOI] [PMC free article] [PubMed] [Google Scholar]


