Abstract
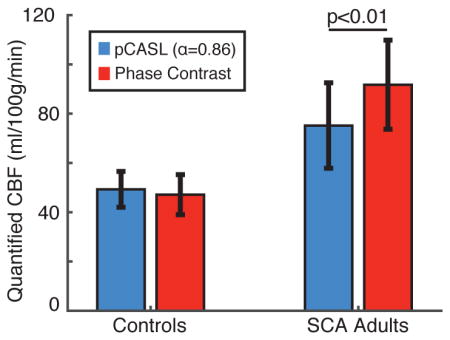
Sickle cell anemia (SCA) is a genetic disorder resulting in reduced oxygen carrying capacity and elevated stroke risk. Pseudo-continuous arterial spin labeling (pCASL) measures of cerebral blood flow (CBF) may have relevance for stroke risk assessment, however the effects of elevated flow velocity and reduced bolus arrival time (BAT) on CBF quantification in SCA patients have not been thoroughly characterized, and pCASL model parameters used in healthy adults are often applied to patients with SCA. Here, cervical arterial flow velocities and pCASL labeling efficiencies were computed in adults with SCA (n=19) and age- and race-matched controls without sickle trait (n=7) using pCASL in sequence with phase contrast MR angiography (MRA). A subgroup of controls (n=7) and patients (n=8) also underwent multi-postlabeling-delay pCASL for BAT assessment. Mean flow velocities were elevated in SCA adults (velocity=28.3±4.1 cm/s) compared to controls (velocity=24.5±3.8 cm/s) and mean pCASL labeling efficiency (α) was reduced in SCA adults (α=0.72) relative to controls (α=0.91). In patients, mean whole-brain CBF from phase contrast MRA was 91.8±18.1ml/100g/min, while mean pCASL CBF when assuming a constant labeling efficiency of 0.86 was 75.2±17.3 ml/100g/min (p<0.01), resulting in a mean absolute quantification error of 23% when a labeling efficiency appropriate for controls was assumed. This difference cannot be accounted for by BAT (whole-brain BAT; control=1.13±0.06s; SCA=1.02±0.09s) or tissue T1 variation. In conclusion, BAT variation influences pCASL quantification less than elevated cervical arterial velocity and labeling efficiency variation in SCA adults; thus, a lower labeling efficiency (α=0.72) or subject-specific labeling efficiency should be incorporated for SCA patients.
Keywords: perfusion spin labeling methods, quantitation, neurovascular diseases, MR angiography (MRA)
Graphical Abstract
We examined the effect of cervical arterial flow velocity on pseudocontinuous arterial spin labeling (pCASL) labeling efficiency in adults with sickle cell anemia (SCA). Our results showed that flow velocities were higher and labeling efficiencies were lower in adults with SCA relative to controls, resulting in underestimation of cerebral blood flow (CBF) when a labeling efficiency appropriate for controls is assumed. Thus, individualized labeling efficiencies should be computed for SCA adults on an individual basis to ensure reliable CBF measurement using pCASL MRI.
Introduction
Sickle cell anemia (SCA) is a genetically-inherited disorder which results in erythrocyte deformation known as sickling (1) and leads to elevated risk of arterial steno-occlusion, silent cerebral infarcts, and overt stroke in patients with SCA (2,3). Characterizing intracranial hemodynamics in patients with SCA is believed to be beneficial for stratifying patients for stroke risk, and in turn titrating prophylactic therapies (4).
Physiologically, sickled erythrocytes lyse at higher rates than normal erythrocytes leading to a reduction in the hematocrit (ratio of erythrocyte cell volume to total blood volume) that parallels decreases in the oxygen carrying capacity of blood. Such reductions in oxygen carrying capacity may be compensated for by increases in global cerebral blood flow (CBF) (5) via microvascular increases in cerebral blood volume (e.g., autoregulation) along with potential increases in arterial flow velocity. In addition, regional CBF may reduce in the presence of significant vasculopathy in more advanced stages of disease (6).
Arterial spin labeling (ASL) (7,8) is a noninvasive MRI technique for quantitative CBF mapping and has been applied in multiple studies of SCA physiology (9–12). Recently, pseudo-continuous ASL (pCASL) (13,14), an ASL variant in which inflowing arterial blood water is magnetically labeled using a long (1000 – 2000 ms) string of short (< 1 ms) radiofrequency pulses, has emerged as the most popular ASL technique due to its high signal-to-noise ratio relative to pulsed ASL and ability to be performed using widely-available body coils (15).
The pCASL labeling process is sensitive to static field (B0) and radiofrequency field (B1) inhomogeneity as well as to flow velocities in the cervical arteries where labeling occurs. In addition, differences in bolus arrival time (BAT; time required for labeled blood water to reach the capillary exchange site) could affect pCASL signal depending on imaging parameters. The effects of field inhomogeneity have been previously characterized (16,17) and are not unique to SCA pathology. However, the effects of elevated cervical flow velocity and consequent reductions in BAT on the quantitative accuracy of pCASL-derived CBF have yet to be characterized in patients with SCA.
The pCASL labeling efficiency describes the efficiency of the radiofrequency pulse train to invert the longitudinal component of the arterial blood water magnetization and is tightly correlated with the cervical flow velocity (18). A typical labeling efficiency in healthy vessels for routinely used parameters is 85–95%, while blood flowing at higher velocities, as expected in adults with SCA, will have reduced labeling efficiency unless labeling parameters are adjusted. While recent work has elucidated variations in labeling efficiencies in healthy subjects (18,19) and commented on flow velocity effects in children with SCA (9), the effect of variations in cervical flow velocity secondary to SCA on pCASL-measured CBF has yet to be elucidated in adults with SCA. This issue is fundamental, as when pCASL is used for assessment of stroke risk or transfusion response in adults with SCA, it may underestimate CBF if inappropriate labeling efficiencies are assumed. We hypothesize that cervical arterial flow velocities are elevated in adults with SCA, leading to less efficient labeling of blood water in pCASL measurements and to a lesser degree reductions in BAT. The purpose of this study was to quantify cervical arterial flow velocities, BATs, and pCASL labeling efficiencies in a cohort of adults with SCA using phase contrast (PC) MRA and to utilize these values to improve pCASL CBF quantification procedures in adults with SCA.
Experimental
Volunteer demographics
All participants (n=26) provided informed, written consent for this prospective Institutional Review Board-approved cross-sectional study. Adults with SCA on hydroxyurea therapy or prophylactic transfusion therapy without significant (>70%) stenosis (as determined using time-of-flight MR angiography) of any major intracranial or cervical vessels (n=19; age=27.5±4.9 years; 6 females) and healthy age- and race-matched controls (n=7; age=25.5±2.4 years; 2 females) were enrolled. Adults with SCA on transfusion therapy were scanned late (>3 weeks) into their transfusion cycle when their hematocrit was near nadir. Hematocrit values were measured for each participant with analysis of blood obtained through venipuncture either on the same day as imaging (n=21) or within 10 days of imaging (n=5).
Image acquisition
MR data were acquired using a 3.0T Philips Achieva whole-body scanner (Philips Medical Systems, Best, The Netherlands) with bore size=94 cm, gradient strength=80 mT/m, and slew rate=200 T/m/s. Non-sedated MR scanning of the head and neck was performed using body coil RF transmission and a SENSE 16-channel neurovascular receive coil.
T1-weighted imaging using a magnetization-prepared-rapid-gradient-echo (MPRAGE) sequence (TR/TE=8.2/3.7 ms; spatial resolution=1.0×1.0×1.0 mm3), fluid-attenuated inversion recovery (FLAIR) imaging (TR/TI/TE=11,000/2800/120 ms; spatial resolution=1.0×1.1×3.0mm3), and time-of-flight MR angiography (MRA) of the head (TR/TE=23/3.5 ms; spatial resolution=0.5×0.8×0.7 mm3) and neck (TR/TE=18.6/3.2 ms; spatial resolution=0.9×0.9×3.0 mm3) were performed in all participants for volumetric analysis, for prior infarct assessment, to confirm the absence of significant stenosis, and to guide the placement of quantitative flow measurements, respectively.
For pCASL, a train of Hanning-windowed block pulses with labeling gap=0.5 ms, flip angle=18°, and pulse duration=0.5 ms was applied for a total labeling duration (τ) of 1000 ms. Since both CBF and BAT were of interest in this study, the labeling duration was shortened slightly relative to other pCASL implementations (15) to increase sensitivity to the ascending portion of the ASL kinetic curve and enable BAT quantification with greater accuracy. The pCASL labeling occurred in a 13 mm thick plane 90 mm inferior to the middle of the imaging volume, which was centered on the anterior commissure/posterior commissure line. Image acquisition consisted of a multi-slice 2D single-shot EPI gradient echo readout (TR/TE=3675/13 ms; spatial resolution=3.0×3.0×7.0 mm3) as reported previously (20). Equilibrium signal images (S0) were acquired immediately following the pCASL scan with identical readout parameters but with spin labeling preparation removed and TR=15,000 ms. pCASL data were acquired in all subjects (n=26) with a post-labeling delay (PLD) of 1900 ms (averages=20). In a subset of participants (n=7 controls, n=8 SCA adults), multi-PLD pCASL data were acquired at seven total PLDs=100, 400, 700, 1000, 1300, 1600, and 1900 ms for BAT determination. Identical readout schemes and TRs were utilized for all PLDs.
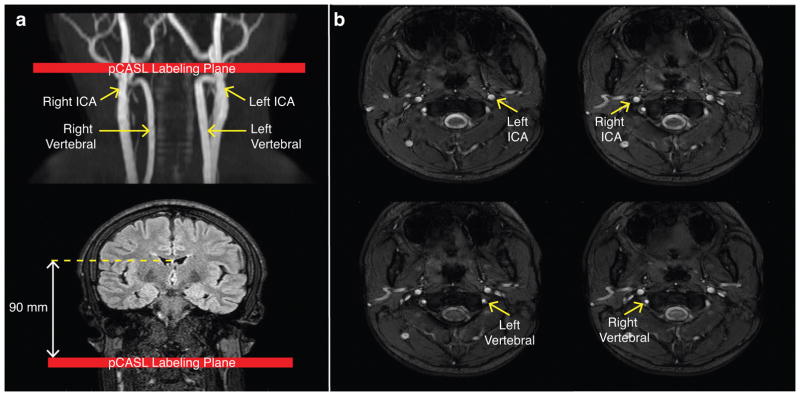
Phase contrast data were acquired in all subjects for each of the four major cervical arteries: left internal carotid artery (ICA), right ICA, left vertebral, and right vertebral (TR/TE=20/7 ms; in-plane spatial resolution=0.5×0.5 mm2; velocity encoding gradient, VENC=40 cm/s) (Figure 1b). A VENC=40 cm/s was applied to allow for determination of slow flow near the perimeter of the vessel, and phase unwrapping was applied to quantify any aliased flow velocities in the center of the vessel. The location and orientation of the imaging slices were planned using the neck MRA with the slices placed perpendicular to vessel direction at the level of the C2 vertebra and at the approximate location of the pCASL labeling plane (Figure 1a). Magnitude and phase images, which were converted to temporally-averaged (over the cardiac cycle) velocity images (18), were recorded.
Figure 1.
Image processing
Labeling efficiencies were individually computed for each participant according to a previously-reported approach (18). First, total blood flow, derived from the phase contrast velocity measurements and vessel cross-sectional areas, was normalized to brain parenchymal mass to yield total parenchymal CBF (CBFPC). Second, given that both phase contrast and pCASL should measure the same physiological quantity (i.e., CBF) in the absence of experimental error, the labeling efficiency was computed as the factor necessary to equate pCASL-measured CBF (CBFpCASL) to CBFPC; this procedure has been outlined in detail previously (18), additional details relevant to this study are provided below.
Phase contrast CBF
The left and right ICA and left and right vertebral arteries were identified from the phase contrast magnitude images using a semi-automatic approach with manual initialization followed by a Sparse-Field level-set method (21) as implemented in MATLAB (The Mathworks, Natick, MA) with a Chan-Vese model (22) and 1000 iterations. Next, vessel masks were applied to the corresponding velocity images and a mean velocity was computed for each artery. Phase unwrapping was applied prior to mean velocity computation if aliasing was present.
Total blood flow (ml blood/min) was calculated by summing the contributions to blood flow from each of the four vessels as the product of the mean velocity in each vessel and the cross-sectional area of that vessel. This total blood flow was then normalized to brain parenchymal mass (units of 100g tissue) to yield parenchymal CBFPC (ml blood/100g tissue/min). To calculate brain parenchymal mass, T1-weighted MR images were used to identify regions of gray matter parenchyma (GM), white matter parenchyma (WM), and cerebrospinal fluid (CSF) using a deformable model with locally adaptive model forces for brain extraction (23) followed by segmentation using a hidden Markov random field model and expectation-maximization algorithm (24). The parenchymal mass was determined as the product of the parenchymal volume (including GM and WM) and the brain density=1.06 g/ml (25).
pCASL CBF
CBF was quantified from the pCASL data with three distinct and commonly-used methods: 1) CBFpCASL,SM: simplified ISMRM study group model (15), which does not account for BAT, 2) CBFpCASL,KM: three-stage kinetic model to simultaneously calculate CBF and BAT (in the subset of participants with multi-PLD data), and 3) CBFpCASL,KM-CBAT: kinetic model to calculate CBF utilizing single PLD (PLD=1900 ms) data and a constant BAT value.
For CBFpCASL,SM, the pCASL CBF equation (15) was rewritten to solve for the labeling efficiency:
| [1] |
where α is the labeling efficiency, λ=0.9 ml/g is the whole-brain blood-brain partition coefficient, Scontrol is the signal intensity in the pCASL control image, Slabel is the signal intensity in the pCASL label image, PLD=1900 ms is the post-labeling delay time, T1,blood is the longitudinal relaxation time of arterial blood water, CBFPC is the intracranial CBF derived from phase contrast MRA and volumetric analysis, S0 is the signal intensity in the equilibrium image, and τ=1000 ms is the labeling duration. T1,blood was calculated for each participant according to a previously-established inverse relationship (26) between the measured hematocrit and arterial T1,blood:
| [2] |
where Hct is the individually-measured hematocrit. Recently, elegant work (27) has more fully characterized T1,blood as a function of hematocrit, blood oxygenation, and field strength, but the above model, which accounts for differences in hematocrit between control and SCA participants, was utilized since these differences are much larger than the differences in their arterial blood oxygenation levels. In addition, recent work has also demonstrated that pCASL CBF can be quantified by incorporating subject-specific measurements of venous blood water T1 (28). This was not employed here since in the SCA adult participants, venous blood water may additionally have variable blood oxygenation status owing to oxygen extraction fraction (4). Two CBF maps were generated for each subject from the acquired pCASL data: one using the calculated labeling efficiency from the phase contrast data (Eq. 1) and one using α=0.86 as previously reported for normal subjects in the literature (18), for:
| [3] |
While the above quantification procedure has recently been recommended, it assumes that T1,tissue=T1,blood, which may be inaccurate in SCA, and also does not account for potential differences in BAT. To understand these potential confounds, in the subset of participants with multi-PLD pCASL data, CBFpCASL,KM and BAT were calculated using the traditional three-stage kinetic model (29):
| [4] |
where ΔMtiss is the difference between control and label acquisitions, T1,app=1/T1,tiss + CBFpCASL,KM/(λ), M0,b=the equilibrium blood water magnetization, and T1,tiss is the T1 of tissue. The apparent T1 (T1,app) in this model was used by convention, but more recent work by Qin et al. (30) suggests that this term may be empirically lengthened to incorporate exchange effects, and changes in tissue T1 were simulated to understand how this could influence pCASL signal. The kinetic model fitting was performed as previously described (31) using the BASIL tool from the FSL Toolbox (FMRIB, Oxford, UK), and a map of BATs was generated for each participant. CBF in all models was converted from ml/g/s to ml/100g/min by multiplying by 6000.
For CBFpCASL,KM-CBAT, CBF values were computed for controls and SCA adults assuming a constant BAT equal to the mean GM BAT value for controls and SCA adults, respectively, from the CBFpCASL,KM analysis results. Specifically, the third component of the three-stage model from Eq. 4 was utilized with a constant BAT value:
| [5] |
This approach was utilized primarily because multi-PLD ASL data are not always available in all protocols. To validate this approach (and thus to examine the effect of voxel-wise BAT information versus a mean BAT value), CBFpCASL,KM and CBFpCASL,KM-CBAT values in GM were compared and differences were evaluated.
Simulation and error estimation
The sensitivity of CBFpCASL to labeling efficiency error, BAT, or tissue T1, simulations were performed. The sample mean for each of the control and SCA adult group was used to conduct the simulation. To investigate tissue T1, cortical GM T1 values were taken from the literature as T1,control=1.2s and T1,SCA=1.14s (32). Our patient population did not exhibit infarcts, nor were changes in tissue T1 noticeable on T1-weighted imaging (see results) and therefore larger T1 variations are not anticipated. A CBF=70 ml/100g/min was assumed to conduct simulations using Eq. 3 (20). In addition, Bloch simulations were performed, as previously described (33), to derive the theoretical relationship between flow velocity and labeling efficiency.
Statistics
All statistical analyses were performed using MATLAB (The Mathworks, Natick, MA).
Analysis of differences in study variables (e.g., cervical flow velocity, BAT, and CBF) between groups (e.g., controls vs. SCA adults) was performed using non-parametric Wilcoxon rank-sum tests. Spearman’s rank correlation testing was applied to evaluate relationships between study variables (e.g., cervical flow velocities, arterial flow velocity and BAT, and labeling efficiency) across all subjects.
To understand the effect of assuming suboptimal labeling efficiencies on pCASL-computed CBF, absolute percent-errors between pCASL CBF and phase contrast CBF were computed for controls and SCA adults. A two-tailed non-parametric Wilcoxon rank-sum test was used to determine whether the magnitude of the errors is different between the two groups. To evaluate the impact of these errors on the ability to distinguish healthy controls from adults with SCA, a two-tailed non-parametric Wilcoxon rank-sum test was performed between phase contrast CBF values and pCASL CBF (with α=0.86) values in controls and SCA adults.
For all analyses, test statistics with two-sided p<0.05 were considered to be statistically significant.
Results
Flow velocity, cross-sectional area, and total flow
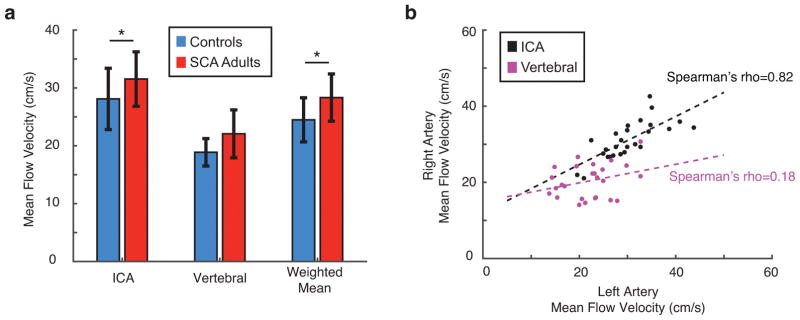
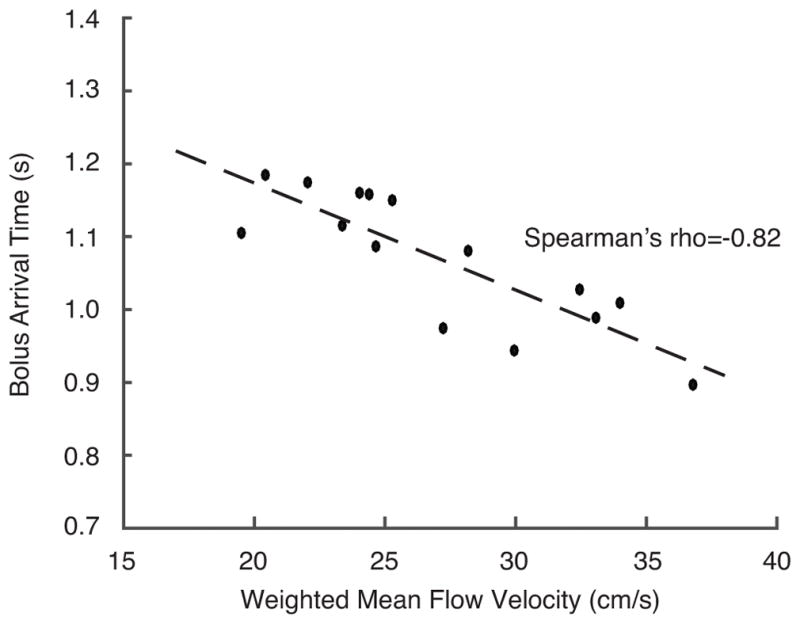
ICA flow velocities and weighted arterial flow velocities across subjects (Figure 2a) were significantly elevated in SCA adults compared to controls (p<0.05). Mean flow velocities in the left and right ICAs were tightly correlated (ρ=0.82, p<0.001) while corresponding flow velocities in the left and right vertebral arteries were less-well associated (Figure 2b), consistent with a higher degree of asymmetry in vertebral artery sizes. There was an inverse association between blood flow velocities, derived from phase contrast MRA, and BAT values, derived from pCASL (ρ=−0.82, p<0.05), as expected (Figure 3).
Figure 2.
Figure 3.
Bolus arrival time and tissue T1
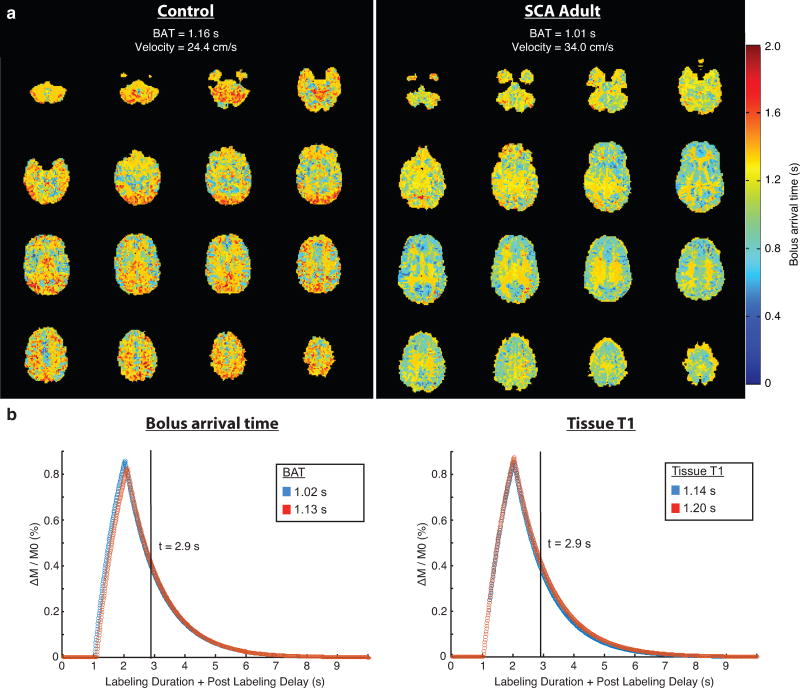
The mean±standard deviation of BAT values was 1.13±0.06s for the control group and 1.02s±0.09s for the SCA group (p<0.01). Representative BAT maps (Figure 4a) for a control participant and an adult with SCA illustrate the reduced BAT values in SCA adults. In addition, the simulated difference in pCASL signal with PLD=1900 ms was approximately 3% for BAT=1.13s vs. BAT=1.02s; similarly, the simulated difference in pCASL signal with the slightly lower brain tissue T1 value reported in SCA was approximately 6% (Figure 4b).
Figure 4.
Voxel-wise BAT versus mean BAT
The mean±standard deviation of the GM CBF values using the CBFpCASL,KM approach and CBFpCASL,KM-CBAT approach were 63.3±2.4 ml/100g/min and 65.15±6.2 ml/100g/min for the control group (p=0.38) and 96.6±16.0 and 94.3±15.2 for the SCA adult group, respectively (p=0.95). Furthermore, the GM CBF values from these two approaches were strongly (ρ=0.75) and significantly (p<0.01) correlated. Therefore, the CBFpCASL,KM-CBAT approach was utilized for the whole-brain comparisons between the simplified model and the more complex model.
Whole-brain CBFPC, CBFpCASL,SM, and CBFpCASL,KM-CBAT
The mean±standard deviation of the whole-brain CBFPC, CBFpCASL,SM, and CBFpCASL,KM-CBAT values are displayed in Table 1. The variation in values is attributable to differences in model assumptions (T1,blood=T1,tissue and lack of BAT term in the simplified model).
Table 1.
Whole-brain CBF values computed from phase contrast MRA (CBFPC), pCASL using the simplified model (CBFpCASL,SM), and pCASL using the kinetic model with constant BAT (CBFpCASL,KM-CBAT) illustrate the effects of assuming suboptimal labeling efficiency. The three-stage kinetic model (CBFpCASL,KM) with voxel-wise was BAT did not differ significantly from CBFpCASL,KM-CBAT. These data demonstrate that the different kinetic models provide relatively different CBF values, even in control participants. Additionally, after accounting for BAT, there is still a large absolute difference (22.5%) in CBF between the gold-standard CBFPC value and pCASL value, which can be explained by reduced labeling efficiency secondary to elevated cervical flow velocities.
| CBF (ml/100g/min) | CBFPC | CBFpCASL,SM | CBFpCASL,KM-CBAT |
|---|---|---|---|
| Controls | 47.1±8.1 | 36.1±5.7 | 49.3±7.3 |
| SCA adults | 91.8±18.1 | 47.5±10.3 | 75.2±17.3 |
| p-value | p<0.001 | p<0.05 | p<0.01 |
| CBF absolute error (%) | |||
| Controls | - | 22.4±13.3 | 13.4±7.2 |
| SCA adults | - | 47.5±11.0 | 22.5±10.4 |
Wilcoxon rank-sum p-values are for comparisons between controls and SCA adults
Labeling efficiency
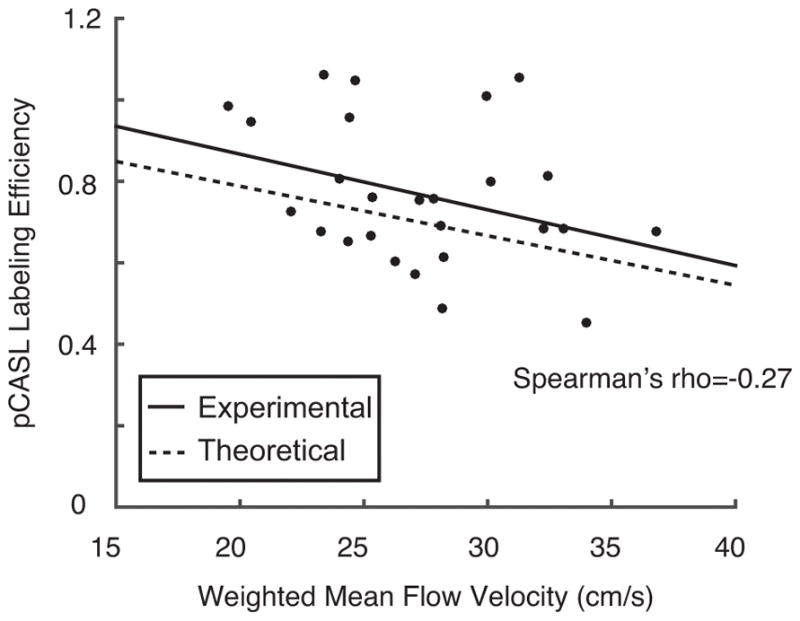
The mean±standard deviation pCASL labeling efficiency across participants was 0.91±0.13 for the control group and 0.72±0.16 for the SCA adult group (p<0.01).
A trend for an inverse relationship (ρ=−0.27) between the weighted arterial flow velocities and pCASL labeling efficiency was observed in control and SCA adults (Figure 5), and this experimental relationship is in good agreement with the theoretical relationship (33) between flow velocity and labeling efficiency.
Figure 5.
Error in CBF measurement
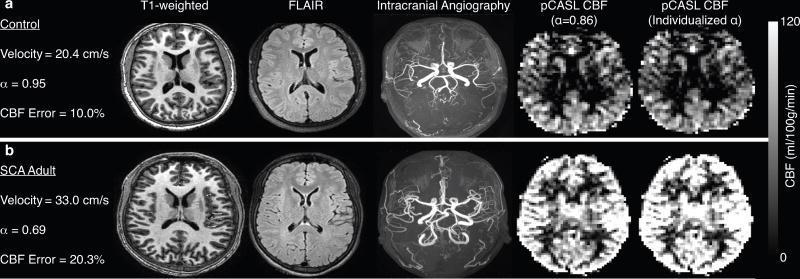
The mean±standard deviation of the absolute percent-error (i.e. the mean of the absolute errors of each subject) of CBFpCASL,KM-CBAT with suboptimal labeling efficiency (α=0.86) compared to CBFPC from phase contrast MRA (i.e. pCASL with true labeling efficiency) was 13.4%±7.2 for the control group and 22.5%±10.4 for the SCA adult group (p<0.05). Figure 6 shows representative structural and CBF images, with and without individualized labeling efficiencies, from a control participant (Figure 6a) and an SCA adult participant (Figure 6b).
Figure 6.
Discussion
It is well known that blood flow velocity variation influences pCASL labeling efficiency (34). However, perfusion studies using pCASL MRI in the setting of SCA generally do not account for the effect of flow velocities on pCASL labeling efficiency. In this study, we quantified cervical arterial vessel flow velocities using phase contrast MRA and examined their effect on CBF computation in young adults with SCA. Finally, we use these data to outline analytic and experimental correction procedures. The overall findings are that substantial errors in CBF quantification can occur if simplified kinetic models are used or if reduced labeling efficiencies are not taken into account, and these predominant factors outweigh smaller errors due to tissue T1 variation or BAT reductions (when long PLD=1900 ms is used).
The relevance of computing individualized pCASL labeling efficiencies has previously been examined for healthy subjects. Aslan and colleagues (18) report that a range of labeling efficiencies (0.79 to 0.98) was observed among subjects due to varying arterial flow velocities attributed to normal variations in vessel anatomy. Same-day intra-patient variations in flow velocities due to medical treatments or lifestyle choices (e.g., caffeine consumption) have also been reported to affect the pCASL labeling efficiency during the time of the scan (18). In very recent work, experimental measurements of labeling efficiency have been made in healthy adults using a fast single slice Look-Locker echo planar imaging readout (19). Thus, the relevance of subject-specific labeling efficiency calculation is becoming increasingly realized, and in this study we extend this line of reasoning to a pressing clinical need in SCA. Our results suggest that assuming a suboptimal labeling efficiency produces a significantly larger error for CBF quantification in adults with SCA compared to controls. Moreover, flow velocities and corresponding labeling efficiencies for individuals in each of the control and SCA adult groups are highly variable, confirming that it is ideal to compute labeling efficiencies on an individual basis.
Phase contrast MRA was used to calculate the blood flow velocities in the four primary cervical arteries supplying the brain. To determine whether this approach yields physiologically meaningful results, correlation analysis was performed between cervical arterial blood flow velocities and bolus arrival times. It is logical to assume that these metrics should be inversely correlated and indeed an inverse relationship (p<0.05) was observed between the flow velocities and corresponding BAT values.
Our results elucidate that mean cervical arterial flow velocities are significantly elevated in adults with SCA compared to controls. The mean labeling efficiency for controls is in good agreement with what has been previously reported in the literature [16], while the mean labeling efficiency for SCA adults is significantly (p<0.01) lower than for controls. The assumption of a suboptimal labeling efficiency, results in an absolute error in CBF computation of approximately 23% in SCA adults compared to approximately 13% in healthy controls. If CBF is utilized as a marker for stroke risk, such underestimations of CBF could result in the misinterpretation of hemodynamic compensation mechanisms and stroke risk.
BATs in adults with SCA were found to be significantly (p<0.01) lower than in controls, and these BAT values correlated well with the increased cervical arterial flow velocities observed. However, given the relatively low sensitivity of simulated pCASL signal at long PLD to small variations in BAT (Figure 4b, left), these lower BATs cannot explain the large differences observed between CBFPC and CBFpCASL,KM-CBAT. In addition, simulations (Figure 4b, right) revealed that the effect of slightly lower brain tissue T1 values as previously reported in the literature (32) also results in only a small change in perfusion signal.
For the CBF computations, the model as proposed by Buxton et al (35) with constant BAT was utilized in lieu of the simplified model (15) due to the underestimation of CBF observed in this patient population with the simplified model. This underestimation is largely due to the inaccurate assumption in the simplified model that T1,tissue=T1,blood in SCA and global shifts in the absolute CBF that is quantified when BAT is not included. While this may be an appropriate assumption in healthy controls, anemic patients exhibit longer T1,blood times that render this assumption crippling. The general trends from this study are consistent between both models (e.g., reduced labeling efficiency in SCA), however we believe the more complete model provides a more thorough estimate of pCASL labeling efficiency and CBF in this population.
It is possible to correct for the effect of flow velocity differences on pCASL-derived CBF maps in either a prospective (during acquisition) or a retrospective (during post-processing) manner. The post-processing correction, similar to the method outlined in this study, would suffice if the relationship between cervical flow velocity and labeling efficiency is well-characterized for the specific radiofrequency labeling pulse train. However, if velocities are very high, or variable between cervical vessels (i.e. differences in ICA versus vertebral artery), then SNR may be too low to obtain reliable CBF maps using a simple post-processing correction. Therefore, a prospective correction utilizing vessel-encoded pCASL may be more appropriate. Using vessel-encoded pCASL (36), it is possible to adjust the performance of the radiofrequency pulses for different labeling conditions (e.g., right or left ICA or vertebral artery) if the flow velocities are known. Phase contrast MRA could be used to gather the flow velocity information quickly. “Control” acquisitions for each vessel-labeling could be similarly generated to maintain identical magnetization transfer effects as in the label condition. These modifications require little additional effort, and will be investigated as a way of improving pCASL quantitative accuracy in patients with cerebrovascular disease.
The results presented in this study should be considered in the context of the following limitations. First, as is the case in nearly all pCASL application studies, cardiac gating was not utilized during the phase contrast MRA scans; therefore, the resulting flow velocities are averaged over the entire cardiac cycle and cannot be mapped to individual phases, resulting in flow velocities that appear lower than the values reported using transcranial Doppler ultrasound which is typically conducted at peak systole. Recently, pCASL approaches for deriving vessel-specific labeling efficiencies using cardiac gating have been proposed (19). Cardiac gated phase contrast data can provide information on the effect of varying flow velocities over the cardiac cycle on labeling efficiency (37). In this study, however, the velocities measured using phase contrast MRA more accurately reflect the mean flow velocity during the long (1–2s) pCASL labeling period. Second, the accuracy of the CBF values derived from phase contrast MRA, employed as the standard for establishing pCASL labeling efficiencies in this study, is dependent on computation of the mean velocities from accurate vessel segmentations. The approach utilized in this study is a semi-automatic approach that combines a manual initialization with an established active contour algorithm. The presented segmentation approach was identically utilized for controls and SCA participants, so the likelihood of bias in the CBF errors toward any one group is unlikely. Third, in careful pCASL studies of children with SCA, it has been shown that individual measurements of venous blood water T1 can improve CBF quantification accuracy (28). These data were not obtained as part of this study, but subject-specific arterial blood water T1 values, which were corrected for the measured hematocrit, were utilized. As the pCASL kinetic model requires knowledge of the arterial component of the blood water T1, and venous blood water T1 may be variable between SCA subjects due to differences in blood oxygenation level and oxygen extraction fraction, this approach is expected to be appropriate. Finally, unilateral steno-occlusive disease could impair the whole-brain CBF approach to deriving labeling efficiency. Therefore, a vessel encoded approach measuring labeling efficiency for each perfusion territory may be necessary in such cases. However, no indications of flow-limiting cervical arterial disease were found in our cohort of adults with SCA.
In conclusion, the pCASL labeling efficiency used to compute CBF in adults with SCA is affected by the varying cervical arterial flow velocities observed in these patients. In controls, the use of a labeling efficiency of 0.86 results in a CBF quantification error of approximately 13% whereas an equivalent labeling efficiency in SCA adults results in a much larger CBF quantification error of approximately 23%. Therefore, the lower value reported in this study should be assumed when computing CBF in adults with SCA to minimize errors. Ideally, labeling efficiencies should be individually determined on a case-specific basis in this population and additional populations where cervical arterial flow velocity may be elevated due to steno-occlusive disease.
Acknowledgments
Funding: American Heart Association: 14CSA20380466, National Institutes of Health, NINDS, Grant/Award Number: R01NS078828, National Institutes of Health, NINDS, Grant/Award Number: R01NS097763
We are grateful to Allison Scott, Charles Nockowski, Clair Jones, Kristen George-Durrett, Christopher Thompson, and Leslie McIntosh for experimental support. We would also like to acknowledge Dr. William Grissom for conversations regarding the Bloch simulations. Funding was provided by the National Institutes of Health (NIH/NINDS: R01NS078828, R01NS097763) and American Heart Association (14CSA20380466).
List of Abbreviations
- ASL
Arterial spin labeling
- CBF
Cerebral blood flow
- CSF
Cerebrospinal fluid
- FLAIR
Fluid-attenuated inversion recovery
- GM
Gray matter
- Hct
Hematocrit
- ICA
Internal carotid artery
- MPRAGE
Magnetization-prepared rapid gradient echo
- MRA
Magnetic resonance angiography
- PC
Phase contrast
- pCASL
Pseudo-continuous arterial spin labeling
- PLD
Post-labeling delay
- SCA
Sickle cell anemia
- WM
White matter
References
- 1.Kassim AA, DeBaun MR. Sickle cell disease, vasculopathy, and therapeutics. Annu Rev Med. 2013;64:451–466. doi: 10.1146/annurev-med-120611-143127. [DOI] [PubMed] [Google Scholar]
- 2.Debaun MR, Derdeyn CP, McKinstry RC., 3rd Etiology of strokes in children with sickle cell anemia. Ment Retard Dev Disabil Res Rev. 2006;12(3):192–199. doi: 10.1002/mrdd.20118. [DOI] [PubMed] [Google Scholar]
- 3.Arkuszewski M, Krejza J, Chen R, Melhem ER. Sickle cell anemia: reference values of cerebral blood flow determined by continuous arterial spin labeling MRI. Neuroradiol J. 2013;26(2):191–200. doi: 10.1177/197140091302600209. [DOI] [PMC free article] [PubMed] [Google Scholar]
- 4.Jordan LC, Gindville MC, Scott AO, Juttukonda MR, Strother MK, Kassim AA, Chen SC, Lu H, Pruthi S, Shyr Y, Donahue MJ. Non-invasive imaging of oxygen extraction fraction in adults with sickle cell anaemia. Brain. 2016;139(Pt 3):738–750. doi: 10.1093/brain/awv397. [DOI] [PMC free article] [PubMed] [Google Scholar]
- 5.Prohovnik I, Pavlakis SG, Piomelli S, Bello J, Mohr JP, Hilal S, De Vivo DC. Cerebral hyperemia, stroke, and transfusion in sickle cell disease. Neurology. 1989;39(3):344–348. doi: 10.1212/wnl.39.3.344. [DOI] [PubMed] [Google Scholar]
- 6.van den Tweel XW, Nederveen AJ, Majoie CB, van der Lee JH, Wagener-Schimmel L, van Walderveen MA, Poll The BT, Nederkoorn PJ, Heijboer H, Fijnvandraat K. Cerebral blood flow measurement in children with sickle cell disease using continuous arterial spin labeling at 3. 0-Tesla. MRI Stroke. 2009;40(3):795–800. doi: 10.1161/STROKEAHA.108.523308. [DOI] [PubMed] [Google Scholar]
- 7.Detre JA, Leigh JS, Williams DS, Koretsky AP. Perfusion imaging. Magn Reson Med. 1992;23(1):37–45. doi: 10.1002/mrm.1910230106. [DOI] [PubMed] [Google Scholar]
- 8.Williams DS, Detre JA, Leigh JS, Koretsky AP. Magnetic resonance imaging of perfusion using spin inversion of arterial water. Proc Natl Acad Sci U S A. 1992;89(1):212–216. doi: 10.1073/pnas.89.1.212. [DOI] [PMC free article] [PubMed] [Google Scholar]
- 9.Gevers S, Nederveen AJ, Fijnvandraat K, van den Berg SM, van Ooij P, Heijtel DF, Heijboer H, Nederkoorn PJ, Engelen M, van Osch MJ, Majoie CB. Arterial spin labeling measurement of cerebral perfusion in children with sickle cell disease. J Magn Reson Imaging. 2012;35(4):779–787. doi: 10.1002/jmri.23505. [DOI] [PubMed] [Google Scholar]
- 10.Helton KJ, Paydar A, Glass J, Weirich EM, Hankins J, Li CS, Smeltzer MP, Wang WC, Ware RE, Ogg RJ. Arterial spin-labeled perfusion combined with segmentation techniques to evaluate cerebral blood flow in white and gray matter of children with sickle cell anemia. Pediatr Blood Cancer. 2009;52(1):85–91. doi: 10.1002/pbc.21745. [DOI] [PMC free article] [PubMed] [Google Scholar]
- 11.Helton KJ, Glass JO, Reddick WE, Paydar A, Zandieh AR, Dave R, Smeltzer MP, Wu S, Hankins J, Aygun B, Ogg RJ. Comparing segmented ASL perfusion of vascular territories using manual versus semiautomated techniques in children with sickle cell anemia. J Magn Reson Imaging. 2015;41(2):439–446. doi: 10.1002/jmri.24559. [DOI] [PMC free article] [PubMed] [Google Scholar]
- 12.Oguz KK, Golay X, Pizzini FB, Freer CA, Winrow N, Ichord R, Casella JF, van Zijl PC, Melhem ER. Sickle cell disease: continuous arterial spin-labeling perfusion MR imaging in children. Radiology. 2003;227(2):567–574. doi: 10.1148/radiol.2272020903. [DOI] [PubMed] [Google Scholar]
- 13.Wu WC, Fernandez-Seara M, Detre JA, Wehrli FW, Wang J. A theoretical and experimental investigation of the tagging efficiency of pseudocontinuous arterial spin labeling. Magn Reson Med. 2007;58(5):1020–1027. doi: 10.1002/mrm.21403. [DOI] [PubMed] [Google Scholar]
- 14.Dai W, Garcia D, de Bazelaire C, Alsop DC. Continuous flow-driven inversion for arterial spin labeling using pulsed radio frequency and gradient fields. Magn Reson Med. 2008;60(6):1488–1497. doi: 10.1002/mrm.21790. [DOI] [PMC free article] [PubMed] [Google Scholar]
- 15.Alsop DC, Detre JA, Golay X, Gunther M, Hendrikse J, Hernandez-Garcia L, Lu H, MacIntosh BJ, Parkes LM, Smits M, van Osch MJ, Wang DJ, Wong EC, Zaharchuk G. Recommended implementation of arterial spin-labeled perfusion MRI for clinical applications: A consensus of the ISMRM perfusion study group and the European consortium for ASL in dementia. Magn Reson Med. 2015;73(1) doi: 10.1002/mrm.25197. spcone. [DOI] [PMC free article] [PubMed] [Google Scholar]
- 16.Jung Y, Wong EC, Liu TT. Multiphase pseudocontinuous arterial spin labeling (MP-PCASL) for robust quantification of cerebral blood flow. Magn Reson Med. 2010;64(3):799–810. doi: 10.1002/mrm.22465. [DOI] [PubMed] [Google Scholar]
- 17.Shin DD, Liu TT, Wong EC, Shankaranarayanan A, Jung Y. Pseudocontinuous arterial spin labeling with optimized tagging efficiency. Magn Reson Med. 2012;68(4):1135–1144. doi: 10.1002/mrm.24113. [DOI] [PMC free article] [PubMed] [Google Scholar]
- 18.Aslan S, Xu F, Wang PL, Uh J, Yezhuvath US, van Osch M, Lu H. Estimation of labeling efficiency in pseudocontinuous arterial spin labeling. Magn Reson Med. 2010;63(3):765–771. doi: 10.1002/mrm.22245. [DOI] [PMC free article] [PubMed] [Google Scholar]
- 19.Chen Z, Zhang X, Yuan C, Zhao X, van Osch MJ. Measuring the labeling efficiency of pseudocontinuous arterial spin labeling. Magn Reson Med. 2016 doi: 10.1002/mrm.26266. [DOI] [PubMed] [Google Scholar]
- 20.Donahue MJ, Faraco CC, Strother MK, Chappell MA, Rane S, Dethrage LM, Hendrikse J, Siero JC. Bolus arrival time and cerebral blood flow responses to hypercarbia. J Cereb Blood Flow Metab. 2014;34(7):1243–1252. doi: 10.1038/jcbfm.2014.81. [DOI] [PMC free article] [PubMed] [Google Scholar]
- 21.Whitaker RT. A level-set approach to 3D reconstruction from range data. Int J Comput Vision. 1998;29(3):203–231. [Google Scholar]
- 22.Chan TF, Vese LA. Active contours without edges. Ieee T Image Process. 2001;10(2):266–277. doi: 10.1109/83.902291. [DOI] [PubMed] [Google Scholar]
- 23.Smith SM. Fast robust automated brain extraction. Hum Brain Mapp. 2002;17(3):143–155. doi: 10.1002/hbm.10062. [DOI] [PMC free article] [PubMed] [Google Scholar]
- 24.Zhang Y, Brady M, Smith S. Segmentation of brain MR images through a hidden Markov random field model and the expectation-maximization algorithm. IEEE Trans Med Imaging. 2001;20(1):45–57. doi: 10.1109/42.906424. [DOI] [PubMed] [Google Scholar]
- 25.Herscovitch P, Raichle ME. What is the correct value for the brain--blood partition coefficient for water? J Cereb Blood Flow Metab. 1985;5(1):65–69. doi: 10.1038/jcbfm.1985.9. [DOI] [PubMed] [Google Scholar]
- 26.Lu H, Clingman C, Golay X, van Zijl PC. Determining the longitudinal relaxation time (T1) of blood at 3. 0 Tesla. Magn Reson Med. 2004;52(3):679–682. doi: 10.1002/mrm.20178. [DOI] [PubMed] [Google Scholar]
- 27.Hales PW, Kirkham FJ, Clark CA. A general model to calculate the spin-lattice (T1) relaxation time of blood, accounting for haematocrit, oxygen saturation and magnetic field strength. J Cereb Blood Flow Metab. 2016;36(2):370–374. doi: 10.1177/0271678X15605856. [DOI] [PMC free article] [PubMed] [Google Scholar]
- 28.Vaclavu L, van der Land V, Heijtel DF, van Osch MJ, Cnossen MH, Majoie CB, Bush A, Wood JC, Fijnvandraat KJ, Mutsaerts HJ, Nederveen AJ. In Vivo T1 of Blood Measurements in Children with Sickle Cell Disease Improve Cerebral Blood Flow Quantification from Arterial Spin-Labeling MRI. AJNR Am J Neuroradiol. 2016;37(9):1727–32. doi: 10.3174/ajnr.A4793. [DOI] [PMC free article] [PubMed] [Google Scholar]
- 29.Chappell MA, MacIntosh BJ, Donahue MJ, Gunther M, Jezzard P, Woolrich MW. Separation of macrovascular signal in multi-inversion time arterial spin labelling MRI. Magn Reson Med. 2010;63(5):1357–1365. doi: 10.1002/mrm.22320. [DOI] [PubMed] [Google Scholar]
- 30.Qin Q, Huang AJ, Hua J, Desmond JE, Stevens RD, van Zijl PC. Three-dimensional whole-brain perfusion quantification using pseudo-continuous arterial spin labeling MRI at multiple post-labeling delays: accounting for both arterial transit time and impulse response function. NMR Biomed. 2014;27(2):116–128. doi: 10.1002/nbm.3040. [DOI] [PMC free article] [PubMed] [Google Scholar]
- 31.Chappell MA, Groves AR, Whitcher B, Woolrich MW. Variational Bayesian inference for a non-linear forward model. Ieee T Signal Proces. 2009;57(1):223–236. [Google Scholar]
- 32.Steen RG, Langston JW, Ogg RJ, Xiong X, Ye Z, Wang WC. Diffuse T1 reduction in gray matter of sickle cell disease patients: evidence of selective vulnerability to damage? Magn Reson Imaging. 1999;17(4):503–515. doi: 10.1016/s0730-725x(98)00204-5. [DOI] [PubMed] [Google Scholar]
- 33.Maccotta L, Detre JA, Alsop DC. The efficiency of adiabatic inversion for perfusion imaging by arterial spin labeling. NMR Biomed. 1997;10(4–5):216–221. doi: 10.1002/(sici)1099-1492(199706/08)10:4/5<216::aid-nbm468>3.0.co;2-u. [DOI] [PubMed] [Google Scholar]
- 34.Wong EC, Cronin M, Wu WC, Inglis B, Frank LR, Liu TT. Velocity-selective arterial spin labeling. Magn Reson Med. 2006;55(6):1334–1341. doi: 10.1002/mrm.20906. [DOI] [PubMed] [Google Scholar]
- 35.Buxton RB, Frank LR, Wong EC, Siewert B, Warach S, Edelman RR. A general kinetic model for quantitative perfusion imaging with arterial spin labeling. Magn Reson Med. 1998;40(3):383–396. doi: 10.1002/mrm.1910400308. [DOI] [PubMed] [Google Scholar]
- 36.Wong EC. Vessel-encoded arterial spin-labeling using pseudocontinuous tagging. Magn Reson Med. 2007;58(6):1086–1091. doi: 10.1002/mrm.21293. [DOI] [PubMed] [Google Scholar]
- 37.Geurts L. Assessment of blood flow velocity and pulsatility in cerebral perforating arteries with 7T phase contrast MRI. ISMRM Benelux. Ghent. 2016 doi: 10.1002/nbm.3306. [DOI] [PMC free article] [PubMed] [Google Scholar]


