Abstract
In this report we describe detailed procedures for carrying out single crystal X-ray diffraction experiments with a diamond anvil cell (DAC) at the GSECARS 13-BM-C beamline at the Advanced Photon Source. The DAC program at 13-BM-C is part of the Partnership for Extreme Xtallography (PX^2) project. BX-90 type DACs with conical-type diamond anvils and backing plates are recommended for these experiments. The sample chamber should be loaded with noble gas to maintain a hydrostatic pressure environment. The sample is aligned to the rotation center of the diffraction goniometer. The MARCCD area detector is calibrated with a powder diffraction pattern from LaB6. The sample diffraction peaks are analyzed with the ATREX software program, and are then indexed with the RSV software program. RSV is used to refine the UB matrix of the single crystal, and with this information and the peak prediction function, more diffraction peaks can be located. Representative single crystal diffraction data from an omphacite (Ca0.51Na0.48)(Mg0.44Al0.44Fe2+0.14Fe3+0.02)Si2O6 sample were collected. Analysis of the data gave a monoclinic lattice with P2/n space group at 0.35 GPa, and the lattice parameters were found to be: a = 9.496 ±0.006 Å, b = 8.761 ±0.004 Å, c = 5.248 ±0.001 Å, β = 105.06 ±0.03º, α = γ = 90º.
Keywords: Chemistry, Issue 119, high pressure, synchrotron radiation, single crystal diffraction, diamond anvil cell, crystallography, geophysics, geochemistry, mineralogy, X-ray
Introduction
Single crystal X-ray diffraction is one of the most efficient and well-established ways to determine the chemical composition and structure of a crystalline material at different experimental conditions. Recently there have been a number 1-5 of developments in high-pressure single crystal diffraction. Pressure is one of the major factors that influence the behavior and properties of Earth and planetary materials. High-pressure experiments routinely reveal new polymorphs of common materials and can uncover ways to synthesize chemicals which are impossible to make at ambient conditions. Recently, several new silicate polymorphs have been identified with high-pressure single crystal diffraction, which provide new insight into the properties of Earth's mantle 6-8.
Different from single crystal diffraction at atmospheric pressure, high-pressure single crystal diffraction requires a pressure vessel to generate and maintain pressure during data collection. The most common pressure vessel used in high-pressure single crystal diffraction is the diamond anvil cell (DAC), which is composed of a pair of diamond anvils held together by a metal frame/metal gasket, and a pressure transmitting medium to provide a hydrostatic environment in the sample chamber 4,9-11. Single crystal diffraction using a diamond anvil cell differs from diffraction at ambient conditions in several important ways. First, the coverage of reciprocal space is significantly reduced due to limited X-ray angular access through the body of the DAC and the backing plates. Second, the angle-dependent absorption of X-rays by the diamonds and backing plates must be determined and used to correct the diffraction signal so that accurate structure factors can computed. Third, any overlap of the sample's diffraction signal with scatter or diffraction from the DAC components, such as the diamonds, gasket and pressure transmitting medium, must be eliminated. Fourth, aligning the sample in the DAC to the center of the goniometer is difficult. The direction perpendicular to the load axis of the DAC is always blocked by the gasket, and is not accessible to either the optical microscope or the X-ray beam. In the axial direction, the optical microscope can only visualize a displaced image of the sample because of the high refractive index of the diamond. These differences require the invention of new high-pressure single crystal diffraction measurement methods.
The Partnership for Extreme Xtallography (PX^2) project is a new research initiative dedicated to high-pressure single crystal diffraction with DACs. The project is hosted at the GeoSoilEnviroCARS experimental station 13-BM-C at the APS, which provides most of the infrastructure including detectors, focused X-rays and a 6-circle heavy duty diffractometer 12,13 optimized for a variety of advanced crystallography experiments. The diffractometer has six angular degrees of freedom, four sample-orienting (µ, η, χ and φ) and two detector-orienting (δ and υ). The angular conventions from You 13 are used to describe the motion of the sample and the detector, although the η, χ and φ motions are pseudo-angles derived from the instrument's kappa geometry real motors. The experimental procedures have been optimized for high-pressure single crystal diffraction with DACs, and a suite of data processing and analysis software packages has been developed. In this manuscript, we present a detailed protocol for a typical high-pressure single crystal diffraction experiment using the BX-90 type DAC 9, as a guide to collect and analyze data at PX^2.
Protocol
1. Sample Preparation
NOTE: The sample preparation process includes three major steps: preparing the empty DAC, loading the sample and loading the inert gas pressure transmitting medium. DAC preparation and sample loading have been described in detail in Lavina et al. 10, and pressure transmitting medium loading has been described in Rivers et al. 14 Here we briefly describe the typical sample preparation process.
- Select a pair of conical diamonds with matching backing plates.
- Ensure that the flat tips of the diamond anvils (culets) are identical to each other. NOTE: The diameter of the culet depends on the target maximum pressure of the experiment.
- Ensure that the conical housing of the backing plate matches the shape of the conical diamond. Ensure that the height of the diamond, the diameter of the back side of the diamond, the opening angle of the backing plate and the opening angle of the DAC are compatible with each other, so as to maximize the angular access for diffraction 9,15.
Clean the diamonds and backing plates in an acetone ultrasonic bath for 3-5 min. Set the ultrasonic cleaner to "Sonic" mode. Examine the diamonds and backing plates under an optical microscope, and remove all visible dust or debris.
Place the diamond in the conical housing of the backing plate, and the assembly in a mounting jig.
Apply a few kg of load to the diamond with compressing screws, so that it is in intimate contact with the backing plate. Then, apply about 0.1 g of epoxy around the outer circumference of the diamond. Heat the assembly to 70 °C for 8 h to cure the epoxy.
Clean the interior of the DAC, the back side of the backing plates and the culets of the diamonds with acetone, and place the backing plates with diamonds in the DAC.
Adjust the positions of the diamonds with set screws that hold the backing plate in place, so that the anvil culets are concentric when the two opposing diamonds come into contact.
Check the tilt angle between the two culets looking for interference fringes under an optical microscope. Adjust the tilt angle of the diamonds by fine-tuning the load of the set screws, so that the number of fringes is minimized 10.
Place a piece of 250 µm thick rhenium (Re) metal foil between the two diamonds, and fix it in place with wax. NOTE: This Re foil acts as the gasket of the DAC.
Apply load uniformly and slowly by tightening the four compressing screws of the DAC, and monitor the thickness change of the Re gasket with a micrometer by measuring the total thickness of the DAC assembly.
When the thickness of the Re gasket is ~40 µm, remove the load of the compressing screws slowly, and take out the pre-indented gasket.
Use a laser milling machine to drill a hole at the center of the pre-indentation, whose diameter is at least 2/3 of the culet diameter. Align the gasket with an optical microscope, and set the intended diameter of the gasket hole in the laser milling machine user interface. Press the "scan" button to drill the hole.
Soak the drilled gasket into acetone and clean it with an ultrasonic cleaner in normal mode. Clean the culets of the diamonds with acetone. Place the drilled gasket back in the DAC. NOTE: The hole in the gasket serves as the sample chamber.
Place a single crystal sample at the center of the gasket hole, which should also be the center of the diamond culet. NOTE: The optimal sample size is 20 µm x 20 µm x 5 µm (length x width x thickness).
Place a small ruby sphere (~10 µm in diameter) close to the sample. NOTE: The ruby sphere serves as the pressure marker.
Place the DAC with the sample inside the COMPRES/GSECARS gas loading vessel and load compressed helium (He) or neon (Ne) gas to a maximum pressure of about 25,000 psi to fill the vessel 14.
Increase the pressure inside the DAC sample chamber by tightening the compressing screws of the DAC, and monitor the pressure with ruby fluorescence 16.
2. Data Collection
Place ~1 mg LaB6 powder at the rotation center of the diffractometer, and collect powder diffraction patterns at several MARCCD detector positions varying by the δ angle. Collect the powder diffraction patterns by clicking the "Start" button of the MARCCD EPICS interface. Use this diffraction pattern to calibrate the detector-sample distance and the tilt of the MARCCD detector 2.
- After completing the detector calibration, remove the LaB6 standard from the diffractometer. Place the DAC in the sample holder, and put it on the diffractometer's sample stage.
- Use a clamp-type holder to hold ambient temperature DACs, a water-cooled clamp-type holder for high temperature DACs, and polymer micromesh mounted on an ACA/IUCr standard goniometer head to hold a sample at ambient pressure and temperature. NOTE: In the following steps (2.3-2.8), all the motion controls are achieved with the EPICS user interface (EUI).
Rotate the φ axis so that the sample chamber is perpendicular to the viewing zoom camera by setting the φ angle to 120 in the EUI.
Find the sample chamber with the viewing camera at the minimum magnification first. Center the sample's image by changing the sample X, Y and Z in the EUI. Focus the image of the sample by changing the microscope Z in the EUI, and then zoom-in to the maximum magnification.
Align the sample chamber's image to the center of the viewing camera by changing the sample X, Y and Z in the EUI. Adjust the sample position along the camera's axis until it is in focus (using a pre-determined camera focus to estimate the position of the rotation center in this direction). Then rotate the φ angle to 90 in the EUI so that the sample chamber is perpendicular to the incident X-ray beam.
To correct for sample displacement from the center of the instrument along the DAC axis, scan the DAC position in both horizontal and vertical directions perpendicular to the incident X-ray using the SCANW software, using motorized translations built into the goniometer, while collecting transmitted beam intensity data with a photodiode detector placed behind the sample. NOTE: The photodiode detector is mounted on a pneumatic actuator and can be moved in and out of the beam remotely from the control station.
Find the center position in the collected intensity scan using the "center" function of SCANW, corresponding to maximum transmission. This is the center of the sample chamber.
Rotate the sample using the goniometer φ axis by a few degrees using the EUI, and repeat the vertical transmission scan. Repeat the scan twice, at both positive and negative φ offsets.
Calculate the sample position along the incident X-ray's direction with the following equation 17
 Where ΔY is the distance along the incident X-ray's direction that the sample is displaced from the center of the instrument, Δφ is the change in the φ angle between scans, ΔSx+ and ΔSx- are the positional offsets of X-ray's transmission profile when the φ angle is tilted by +Δφ and -Δφ. NOTE: Several iterations of scans can be made to improve the accuracy of sample positioning.
- After aligning the sample, collect the single crystal diffraction data with the CCD_DC software 1.
- At first, collect a φ-scan with a photodiode by clicking the "scan" button on the SCANW software to determine the maximum opening angle and to determine the functional-shape of the absorption effect of the diamond anvils and backing plates.
- After the φ-scan, carry out a wide φ exposure (during which the detector is left open while φ is rotated) to cover the maximum opening angle that the DAC allows, followed by a series of step φ exposures, each covering 1°. Carry out this step by setting the "total range" to the maximum opening angle, and setting the "Number of steps" to the same number in the CCD_DC software. Collect wide φ scans at different detector positions by specifying the detector arm position in the δ and ν directions in the CCD_DC software, so as to allow access to more diffraction peaks. NOTE: For crystals with a unit cell larger than 10 Å, collection of 10° wide step scans covering the same angular range is also recommended. Exposure times are determined by the absorption from the diamond, and intensity of diffraction features from the sample. Usually select the exposure time that maximizes the intensities of the diffraction peaks without saturation. A typical exposure time is 1-5 s/°. Typical data collection from one crystal at one detector position and one pressure takes about 30 min.
3. Data Analysis
NOTE: The data analysis is carried out using the ATREX/RSV software suite 2,18. For a detailed explanation of the principles utilized in the software please see the work of Dera, et al.2
- Process the LaB6 calibration file.
- Open the LaB6 powder diffraction image collected at each detector position in the software. Input the wavelength of the incident X-rays (0.434 Å), and press the "refine Cal" button. NOTE: The software will automatically calculate the sample-detector distance and the tilt of the detector with respect to the incident X-ray beam. Detector calibration is only conducted at detector positions ν=0, δ=0. The calibration images collected at non-zero ν and δ are used for verification of calibration quality.
- Save the calibration files for each detector position by manually editing the ν and δ settings, as necessary. NOTE: ATREX stores detector calibration .cal files associated with each image series. When opening an image, the program checks if the associated .cal file is present. If it is not, there is the option to select such a file.
After saving the calibrations for all detector positions, create these associations by checking the "Assign cal" checkbox in the ATREX software, so that the program will remember which calibrations to use.
- Search for the sample's diffraction peaks, and fit the peak intensities.
- Open the wide angle φ exposure in the software. Go to the "Search" panel, and search for the diffraction peaks in the wide angle exposure. Manually delete the over-saturated diffraction peaks from the diamond and the diffraction peaks close to the Re gasket rings.
- Fit the diffraction peaks to get their accurate positions and intensities. Search for the sample's diffraction peaks for all the detector positions by clicking the "peak search" button in software, and save the corresponding peak tables by clicking the "save peaks" button.
- Reconstruct the diffraction peaks' distribution in reciprocal space.
- In the program, open the peak table for one detector position, and one image in the step φ scan, which is associated with the same detector position. If the detector calibration file has not yet been assigned to this file series, select the appropriate .cal file. Go to the "Scan" panel, and press the "compute Prof. from scan" button. NOTE: This step will find the φ angle for each diffraction peak at which the peak intensity is the strongest.
- Save the resulting peak table .pks file. Repeat this step for all the wide rotation images at different detector positions.
- Index the diffraction peaks.
- Using the RSV software, open the first peak table file. Use the "Append" function to merge all additional peak tables. Use the RSV plugin to find the preliminary UB matrix of this crystal and to index the diffraction peaks. The software will automatically search for the most probable UB matrix.
- Open the preliminary UB matrix in RSV by importing the .p4p file, and refine the UB matrix with the d-spacing of each diffraction peak using the "Refine w/ d-spac" button. If the symmetry of the crystal is known, select appropriate crystal system constraints. NOTE: When the refinement converges, the optimized UB matrix and the lattice parameters of the crystal (a, b, c, α, β and γ) are determined.
- Save the optimized UB matrix as a .ub file. NOTE: In the initial peak search process the program might have missed some low intensity peaks that will be very valuable in the structure determination.
To search for these missing peaks go back to the software, and open the wide angle φ exposure image (the associated calibration file should be loaded automatically).
In the "Predict" panel, open the UB matrix of the crystal and simulate the diffraction pattern. In the "Peaks" panel, search for the observed diffraction peaks, and remove the unobserved peaks (the text box next to the "Observed" button allows to specify the minimum pixel intensity threshold within the peak fitting box that is required for the peak to be considered "observed"). Fit the positions and intensities of the peaks by clicking the "peak fit" button, then save the peak table.
Merge all the predicted peak tables at different detector positions with the RSV software using the "append" function. If different exposure settings (rotation speed in °/sec) were used, use appropriate scaling factors when opening new .pks files.
Export the merged peak table as a .hkl text file, which can be used to refine the crystal structure with the SHELX software package. Detailed procedures for conducting structure refinement with SHELX have been well described elsewhere 19,20.
Representative Results
We show one representative example of high-pressure single crystal diffraction on the silicate mineral omphacite (Ca0.51Na0.48)(Mg0.44Al0.44Fe2+0.14Fe3+0.02)Si2O6. The omphacite sample was loaded in a BX-90 type DAC with Boehler-Almax (BA) type diamond anvils and backing plates (Figure 1). The sample chamber was filled with a noble-gas pressure transmitting medium (helium in this case) to ensure a hydrostatic pressure environment. The pressure of the sample chamber was 0.35 GPa, determined by ruby fluorescence. The sample was aligned with the rotation center of the diffraction goniometer (Figures 3, 4). We calibrated the position and tilt of the MARCCD detector at ν = 0, δ = 0 with a LaB6 powder standard (Figure 5). During the experiment, η, χ and µ angles were fixed at 0. The diffraction peaks of the sample were first analyzed using the "Search" function of the ATREX software (Figure 6). Then, the lattice parameters and the UB matrix of the omphacite single crystal were refined using the RSV software (Figure 7). With the refined UB matrix of the crystal, more diffraction peaks were found using the "Predict" function of the software (Figure 8). The refined lattice parameters of this omphacite single crystal at this pressure are: a = 9.496 ±0.006 Å, b = 8.761±0.004 Å, c = 5.248 ±0.001 Å, β = 105.06 ±0.03º, α = γ = 90º (Tab. 1). The omphacite crystal was found to have a monoclinic lattice in the P2/n space group. Our refined lattice parameters are consistent with the published lattice parameters of omphacite with a similar chemical composition and at a similar pressure: P = 0.449 GPa, a = 9.5541 ±0.0005 Å, b = 8.7481 ±0.0007 Å, c = 5.2482 ±0.0003 Å, β = 106.895 ±0.004º 21.
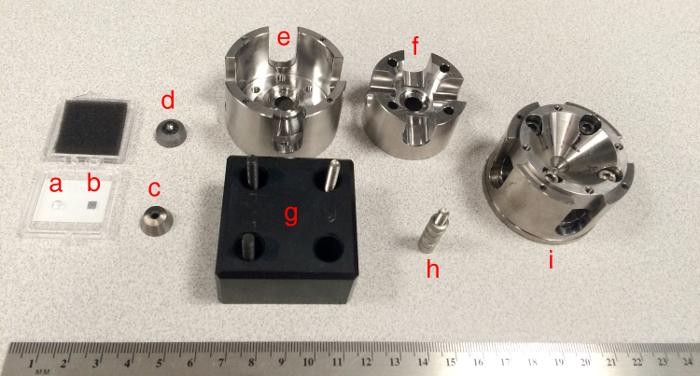 Figure 1: Components of BX-90 DAC which is used for high pressure single crystal diffraction. (a) Boehler-Almax (BA) type diamond; (b) Re gasket; (c) BA type backing plate; (d) BA type diamond glued on BA type backing plate; (e) cylinder part of the BX-90 DAC; (f) piston part of the BX-90 DAC; (g) left-handed (black oxide finish) and right-handed (stainless-steel finish) compressing screws: (h) right-handed compressing screw with disk spring washers; (i) BX-90 DAC assembly ready for high pressure single crystal diffraction experiment. Please click here to view a larger version of this figure.
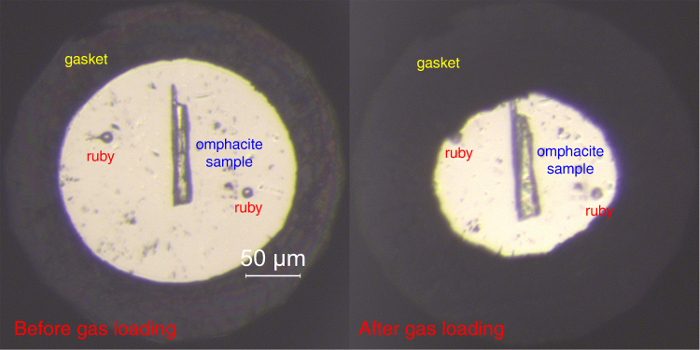 Figure 2:Microscope image of the DAC sample chamber before and after noble gas pressure transmitting medium loading. After the gas pressure transmitting medium loading, the sample chamber hole shrank by ~30% in diameter. Please click here to view a larger version of this figure.
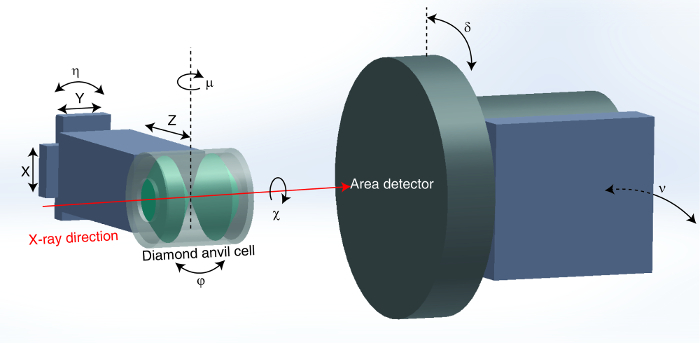 Figure 3:Experimental setup for high-pressure single crystal diffraction at PX^2. The six angular degrees of freedom (µ, η, χ, φ, δ and υ) and the three translational directions (x, y and z) are labeled. The notation for angles follows the angular convention of You 13. Please click here to view a larger version of this figure.
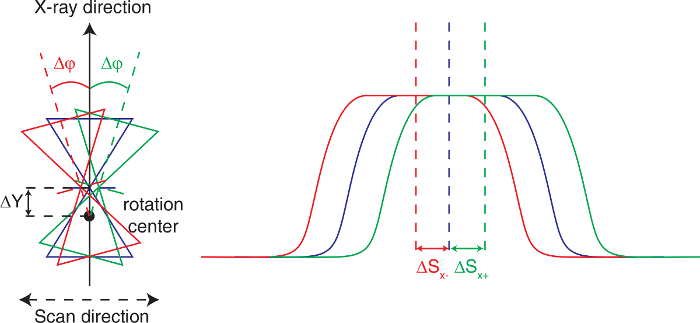 Figure 4:Align the sample chamber to the rotation center. Left: sample chamber scans at the X-ray normal direction (blue) and φ-rotation by +Δφ (green) and -Δφ (red). Right: X-ray transmission profiles of the sample chamber scans at different φ angles. The offsets of the X-ray transmission profiles are used to calculate the positional correction along the incident X-ray direction. Please click here to view a larger version of this figure.
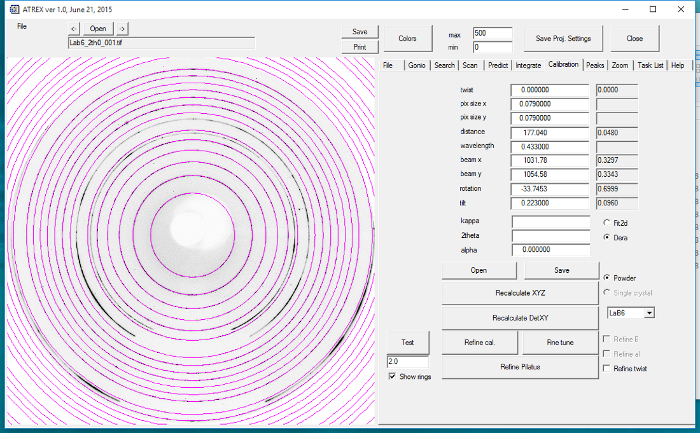 Figure 5:Calibrating the MARCCD detector using the data analysis software. LaB6 powder diffraction pattern is used to carry out the calibration. Please click here to view a larger version of this figure.
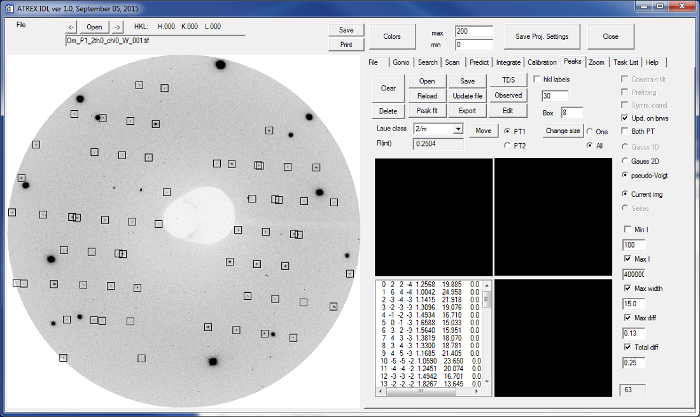 Figure 6:Diffraction peak search using the data analysis software. In total 63 diffraction peaks were found in this wide exposure image. Please click here to view a larger version of this figure.
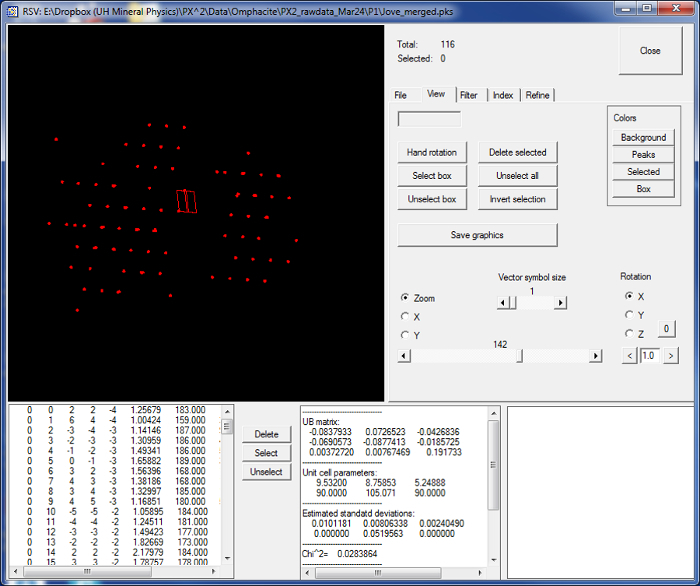 Figure 7:Indexing the diffraction peaks and calculating the UB matrix of the sample using the RSV software. The indexing is carried out automatically by the software. Please click here to view a larger version of this figure.
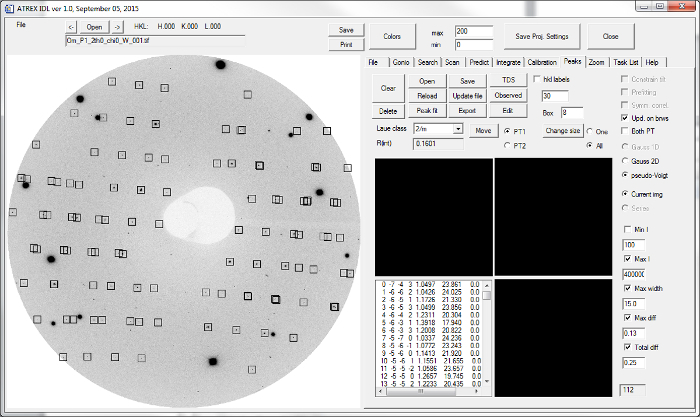 Figure 8:Predicting the diffraction peaks with the data analysis software. 112 diffraction peaks were found with the same diffraction image as in Figure 6 using the peak-prediction function. Please click here to view a larger version of this figure.
| Lattice parameter | Value |
| a | 9.496 ±0.006 Å |
| b | 8.761 ±0.004 Å |
| c | 5.248 ±0.001 Å |
| a | 90º |
| b | 105.06 ±0.03º |
| g | 90º |
Table 1: Lattice parameters of omphacite (Ca0.51Na0.48)(Mg0.44Al0.44Fe2+0.14Fe3+0.02)Si2O6 at 0.35 GPa. The omphacite crystal was found to have a monoclinic lattice in the P2/n space group.
Discussion
In this report we show the detailed procedure for carrying out single crystal diffraction experiments with DACs at the GSECARS 13-BM-C beamline. BX-90 type DACs with BA-type diamond anvils and backing plates are recommended for single crystal diffraction experiments 2,9,15. The advantage of the BX-90 type DAC is its wider angular access compared to the traditional symmetric DACs, which provides for effective sampling of many diffraction peaks 9,15. The wide angular access becomes critical for samples with lower symmetry and with smaller unit cells: the former require more diffraction peaks to constrain the lattice parameters accurately, and the latter give fewer diffraction peaks within the given angular access 2. The more angular access one reaches in the experiment, the more accurate atomic positional parameters one measures 2,4. Restricted angular access may result in a two dimensional reciprocal vector dataset, making reliable data interpretation mathematically impossible 2.
One important, yet often overlooked step is to select suitable pressure transmission medium. Though pressure media such as argon, silicone oil or methanol-ethanol-water solution were used in previous single crystal diffraction experiments that did not exceed 10 GPa 21-23, these pressure media become significantly nonhydrostatic between 5-10 GPa 22, and greatly reduce the quality of the crystal during compression 2,22. Our general experience has been that only He and Ne result in high quality experiments up to 50 GPa (e.g., references6,7). At the APS, these gases can be conveniently loaded into DACs with the use of GSECARS/COMPRES gas-loading apparatus 14. When He or Ne is chosen as the pressure medium, the sample chamber shrinks during the gas loading (Figure 2). Once the sample directly touches the gasket, it breaks easily during the compression. So it is important to drill a big enough sample chamber, whose diameter is at least 2/3 of the culet diameter, to avoid the contact between the sample and the gasket after gas loading.
The synchrotron-based monochromatic single crystal diffraction setup at PX^2 is unique. Compared to the laboratory diffractometers, the synchrotron X-ray source provides a much higher flux (>104) 4,27,28, which significantly improves the signal-to-noise ratio and reduces the data collection time 4,27,28. Synchrotron based powder diffraction is also commonly used to determine the structure of materials at high pressures through the Rietveld approach 4. Single crystal diffraction has advantages over the Rietveld approach, because it decouples the fitting of lattice parameters and structural parameters 2,4. Powder diffraction with Rietveld fitting usually requires fitting both lattice parameters and structural parameters at the same time, while the number of independent observations is typically much lower than in single crystal diffraction 4. Another common structure determination method is Laue diffraction, which uses polychromatic radiation with an area detector 4. Compared to monochromatic data collection at PX^2, the reduction of Laue method data requires additional terms including harmonic deconvolution and intensity normalization, which adds additional difficulties in the data analysis 4,24. Monochromatic single crystal diffraction is a straightforward way of solving structures, yet it has its own limitations. An ideal dataset of monochromatic single crystal diffraction requires a defect-less crystal with a size of tens of µm, and the crystal quality needs to preserve at high pressures. These requirements can be difficult to meet for some non-quenchable minerals, such as bridgmanite 25.
Time resolved single crystal diffraction is capable of capturing the transient metastable states and transformation kinetics during pressure induced structural transitions, and is one of the future research directions for PX^2 26. Quantitative characterization of defects and lattice dynamics, based on analysis of X-ray diffuse scattering at high pressures is also under development at the PX^2 26. A compact optical platform for laser-heated high-pressure single crystal diffraction is being built, and will enable the earth-science community to study the behavior of materials under deep-earth conditions 26.
Disclosures
The authors declare no conflict of interest.
Acknowledgments
This work was performed at GeoSoilEnviroCARS (Sector 13), Partnership for Extreme Crystallography program (PX^2), Advanced Photon Source (APS), and Argonne National Laboratory. GeoSoilEnviroCARS is supported by the National Science Foundation-Earth Sciences (EAR-1128799) and Department of Energy-Geosciences (DE-FG02-94ER14466). The PX^2 program is supported by COMPRES under NSF Cooperative Agreement EAR 11-57758. Use of the Advanced Photon Source was supported by the US Department of Energy, Office of Science, Office of Basic Energy Sciences, under Contract No. DE-C02-6CH11357. Use of the COMPRES-GSECARS gas loading system was supported by COMPRES under NSF Cooperative Agreement EAR 11-57758 and by GSECARS through NSF grant EAR-1128799 and DOE grant DE-FG02-94ER14466. We would also like to thank Prof. R. T. Downs at the University of Arizona for kindly providing the samples from RRUFF collections.
References
- Boffa Ballaran T, Kurnosov A, Trots D. Single-crystal X-ray diffraction at extreme conditions: a review. High Pressure Res. 2013;33(3):453–465. [Google Scholar]
- Dera P, et al. High pressure single-crystal micro X-ray diffraction analysis with GSE_ADA/RSV software. High Pressure Res. 2013;33(3):466–484. [Google Scholar]
- Hejny C, Minkov VS. High-pressure crystallography of periodic and aperiodic crystals. IUCrJ. 2015;2(2):218–229. doi: 10.1107/S2052252514025482. [DOI] [PMC free article] [PubMed] [Google Scholar]
- Lavina B, Dera P, Downs RT. Modern X-ray Diffraction Methods in Mineralogy and Geosciences. Spectroscopic Methods in Mineralology and Materials Sciences. 2014;78:1–31. [Google Scholar]
- McMahon MI, Loa I, Stinton GW, Lundegaard LF. Determining complex crystal structures from high pressure single-crystal diffraction data collected on synchrotron sources. High Pressure Res. 2013;33(3):485–500. [Google Scholar]
- Dera P, et al. Metastable high-pressure transformations of orthoferrosilite Fs(82) Phys Earth Planet Inter. 2013;221:15–21. [Google Scholar]
- Finkelstein GJ, Dera PK, Duffy TS. Phase transitions in orthopyroxene (En(90)) to 49 GPa from single-crystal X-ray diffraction. Phys Earth Planet Inter. 2015;244:78–86. [Google Scholar]
- Zhang JS, Dera P, Bass JD. A new high-pressure phase transition in natural Fe-bearing orthoenstatite. Am Mineral. 2012;97(7):1070–1074. [Google Scholar]
- Kantor I, et al. BX90: A new diamond anvil cell design for X-ray diffraction and optical measurements. Rev Sci Instrum. 2012;83(12) doi: 10.1063/1.4768541. [DOI] [PubMed] [Google Scholar]
- Lavina B, Dera P, Meng Y. Synthesis and Microdiffraction at Extreme Pressures and Temperatures. J Vis Exp. 2013. [DOI] [PMC free article] [PubMed]
- Miletich R, Allan DR, Kuhs WF. High-Pressure Single-Crystal Techniques. Rev Mineral Geochem. 2000;41(1):445–519. [Google Scholar]
- Thorkildsen G, Mathiesen RH, Larsen HB. Angle calculations for a six-circle kappa diffractometer. J Appl Crystallogr. 1999;32:943–950. [Google Scholar]
- You H. Angle calculations for a '4S+2D' six-circle diffractometer. J Appl Crystallogr. 1999;32:614–623. [Google Scholar]
- Rivers M, et al. The COMPRES/GSECARS gas-loading system for diamond anvil cells at the Advanced Photon Source. High Pressure Res. 2008;28(3):273–292. [Google Scholar]
- Boehler R, De Hantsetters K. New anvil designs in diamond-cells. High Pressure Res. 2004;24(3):391–396. [Google Scholar]
- Mao HK, Xu J, Bell PM. Calibration of the Ruby Pressure Gauge to 800-Kbar under Quasi-Hydrostatic Conditions. J Geophys Solid Earth Planets. 1986;91:4673–4676. [Google Scholar]
- Smith JS, Desgreniers S. Selected techniques in diamond anvil cell crystallography: centring samples using X-ray transmission and rocking powder samples to improve X-ray diffraction image quality. J Synchrotron Res. 2009;16:83–96. doi: 10.1107/S0909049508030859. [DOI] [PubMed] [Google Scholar]
- ATREX: IDL code for single crystal XRD data processing. 2016. Available from: https://github.com/pdera/GSE_ADA.
- Refinement tutorial. 2016. Available from: https://github.com/pdera/GSE_ADA/blob/master/Documentation/Refinement%20tutorial.pdf.
- Sheldrick GM. A short history of SHELX. Acta Crystallographica Section A. 2008;64:112–122. doi: 10.1107/S0108767307043930. [DOI] [PubMed] [Google Scholar]
- Pandolfo F, Nestola F, Camara F, Domeneghetti MC. High-pressure behavior of space group P2/n omphacite. Am Mineral. 2012;97(2-3):407–414. [Google Scholar]
- Angel RJ, Bujak M, Zhao J, Gatta GD, Jacobsen SD. Effective hydrostatic limits of pressure media for high-pressure crystallographic studies. J Appl Crystallogr. 2007;40:26–32. [Google Scholar]
- Mccormick TC, Hazen RM, Angel RJ. Compressibility of Omphacite to 60 Kbar - Role of Vacancies. Am Mineral. 1989;74(11-12):1287–1292. [Google Scholar]
- Srajer V, et al. Extraction of accurate structure-factor amplitudes from Laue data: wavelength normalization with wiggler and undulator X-ray sources. J Synchrotron Radiat. 2000;7:236–244. doi: 10.1107/S0909049500004672. [DOI] [PubMed] [Google Scholar]
- Tschauner O, et al. Discovery of bridgmanite, the most abundant mineral in Earth, in a shocked meteorite. Science. 2014;346(6213):1100–1102. doi: 10.1126/science.1259369. [DOI] [PubMed] [Google Scholar]
- Dera P, Weidner D, editors. Mineral Physics 2016 Long-range Planning Report: Harnessing the Extremes: From Atoms and Bonds to Earthquakes and Plate Tectonics. Geo-Prose; 2016. [Google Scholar]
- Rothkirch A, et al. Single-crystal diffraction at the extreme conditions beamline P02.2: procedure for collecting and analyzing high-pressure single-crystal data. J synchrotron rad. 2013;20(5):711–720. doi: 10.1107/S0909049513018621. [DOI] [PubMed] [Google Scholar]
- Merlini M, Hanfland M. Single-crystal diffraction at megabar conditions by synchrotron radiation. High Pressure Res. 2013;33(3):511–522. [Google Scholar]


