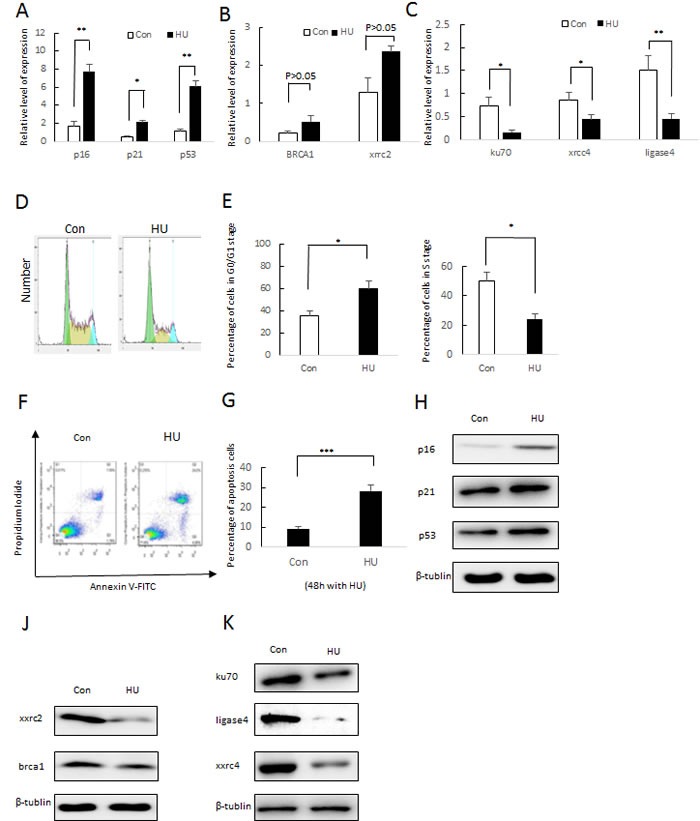
Figure 4. Molecular characterization of 8 mM HU-treated DFSCs.

a. qRT-PCR analysis of p16, p21 and p53 expression normalized by β-actin. Values represent mean±S.E. of two independent samples conducted in triplicate. *P < 0.05; **P < 0.01, Student's t-test. b. qRT-PCR analysis of HR (X-ray repair cross complementing 2 (xrcc2) and brca1) and NHEJ (ku70, ligase4 and X-ray repair cross complementing 4 (xrcc4)) gene expression normalized by β-actin c. Values represent mean±S.E. of two independent samples conducted in triplicate. *P < 0.05; **P < 0.01, Student's t-test. d. Cell cycle arrest of DFSC cells was were treated with 8 mM HU and without HU (Con). After 24 h of incubation, cells were harvested and stained with PI followed by Cellometer imaging and analysis. X-axis indicated the PI fluorescence intensity that correlates to the DNA content. e. FACS analysis and percentages of different cell stages are presented as mean of percentage±S.E. . f. DFSC cells were treated with HU (8 mM) and without HU for 48 h and examined by flow cytometry using Annexin-V/PI staining to label apoptotic cells. g. FACS analysis and percentages of apoptotic cells are presented as mean of percentage±S.E. .(f) Western blotting analysis of p16 and p21 expression. (g) Western blotting analysis of xxrc2 and brac1 expression. (j) Western blotting analysis of ku70, ligade4 and xxrc4 expression
