
Figure 7. Analysis of lysosome and autophagy activity by cell staining.
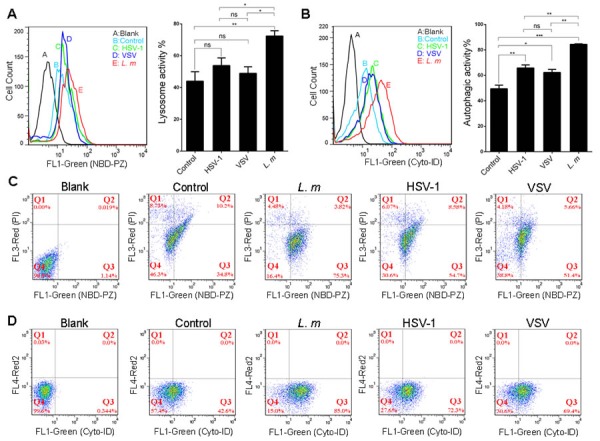
Mouse macrophage cell line RAW 264.7 were infected with L. m, HSV-1 and VSV or culture medium for 9 hours. NBD-PZ/PI dual staining was performed for lysosome activity analysis, and Cyto-ID staining was performed for autophagy activity analysis. A.-B., Quantification of the activity of lysosomes A. or autophagy B. shows the differences between each group. C.-D., one of representative image of fluorescence histograms measured using a FACSCalibur showed comparable intensities of lysosome C. or autophagy D. signals in each group. Cells without staining were set as blank control and the gate was set referring to blank. Mean Values and standard deviations were calculated (*: p < 0.05, **: p < 0.01, ***: p < 0.001, Student's t-test).