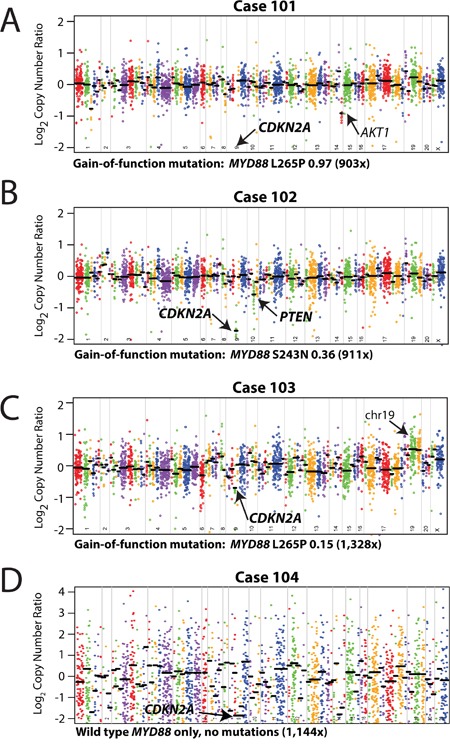
Figure 3. Mutation and copy-number analysis of vitreoretinal lymphomas from next generation sequencing data.

Copy-number profiles, with prioritized alterations in MYD88 (including point mutation/variant, variant fraction in the sample, and overall coverage depth [sum of the number of variant-containing reads and the number of reads without the variant]) are listed below each plot, for each of the three vitreoretinal lymphomas: A. Case 101, B. Case 102, C. Case 103, and D. Case 104. For each sequenced vitreoretinal lymphoma case, GC-content corrected, normalized read counts per amplicon were divided by those from a composite normal sample, yielding a tumor-to-normal copy-number ratio for each amplicon. Log2 tumor-to-normal copy-number ratios per amplicon are plotted (with each individual amplicon represented by a single dot, and each individual gene indicated by different colors), with gene-level copy-number estimates (black bars) determined by taking the weighted mean of the per-probe copy-number ratios. Prioritized high-level copy number alterations are indicated in bold. Log2 copy-number ratios for CDKN2A for Case 101 (A) are off the scale. Annotated, but not prioritized, one copy number losses in AKT1 (A, Case 101), and low level copy number gains in genes on chromosome (chr) 19 (C, Case 103) are noted by arrows.
