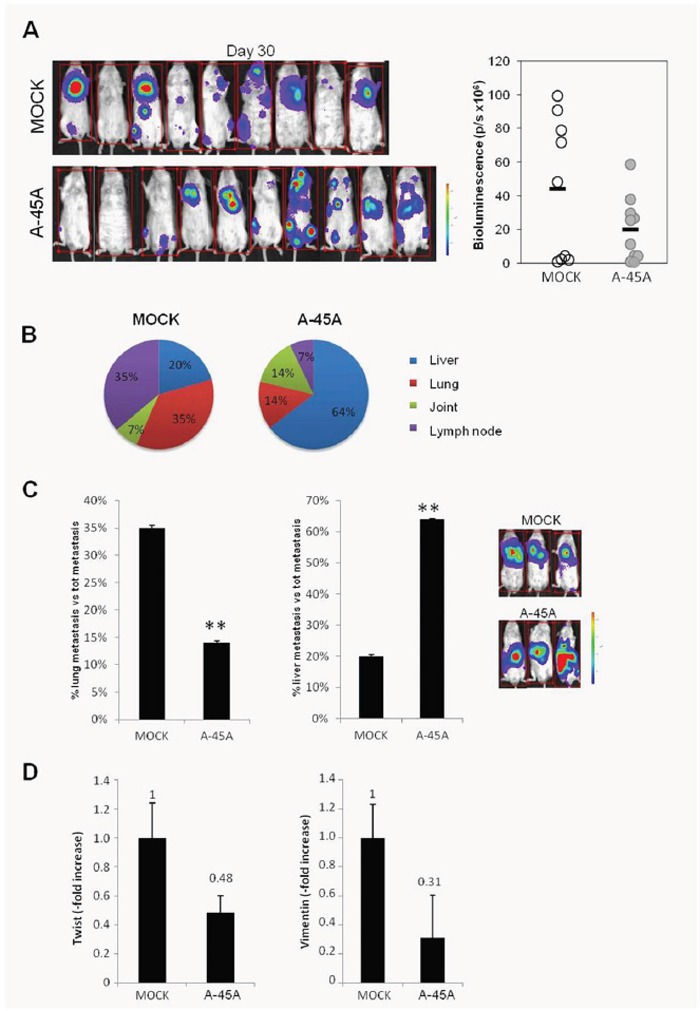
Figure 8. Effect of ncRNA on 45A down-regulation in an in vivo model of metastatic tumor.

A. Left panel represent Bioluminescence analysis of mouse 30 days after injection of SKNBE2-Mock and SKNBE2-Anti45A cells line. On the right panel, bioluminescent assay (p/s) of tumor distribution at the same interval time is shown. Empty circle: SKNBE2-Mock cells lines; grey circle: SKNBE2-Anti45A cells lines. B. Several organs were analyzed for the different distribution of tumor metastasis. Graphics represent the percentages of metastasis generate from mice injected with SKNBE2-Mock and SKNBE2-Anti45A cells lines. Analysis was performed using 10 mice for each group. C. Histogram represents the percentages of metastasis found in lung or liver, respectively, in mice injected with SKNBE2-Mock and SKNBE2-Anti45A cells line. Right images acquired with IVIS instrument shows three representative mice per groups. Data represent mean ± SD (**p < 0.01). D. Twist and Vimentin expression levels analyzed by Real-Time RT-PCR in Mock and 45A-downregulated cells. Data represent mean ± SD.
