Abstract
We propose a method to construct three-dimensional airway geometric models based on airway skeletons, or centerlines (CLs). Given a CT-segmented airway skeleton and surface, the proposed CL-based method automatically constructs subject-specific models that contain anatomical information regarding branches, include bifurcations and trifurcations, and extend from the trachea to terminal bronchioles. The resulting model can be anatomically realistic with the assistance of an image-based surface; alternatively a model with an idealized skeleton and/or branch diameters is also possible. This method systematically identifies and classifies trifurcations to successfully construct the models, which also provides the number and type of trifurcations for the analysis of the airways from an anatomical point of view. We applied this method to 16 normal and 16 severe asthmatic subjects using their computed tomography images. The average distance between the surface of the model and the image-based surface was 11% of the average voxel size of the image. The four most frequent locations of trifurcations were the left upper division bronchus, left lower lobar bronchus, right upper lobar bronchus, and right intermediate bronchus. The proposed method automatically constructed accurate subject-specific three-dimensional airway geometric models that contain anatomical information regarding branches using airway skeleton, diameters, and image-based surface geometry. The proposed method can construct (i) geometry automatically for population-based studies, (ii) trifurcations to retain the original airway topology, (iii) geometry that can be used for automatic generation of computational fluid dynamics meshes, and (iv) geometry based only on a skeleton and diameters for idealized branches.
Keywords: visualization, simulation, geometric fitting, computed tomography
1 Introduction
Geometric models of branching tubular structures are used in medical education, virtual reality operation planning, augmented reality inter-operative support, and numerical simulations of blood and air flow in vascular and airway trees, respectively (Volkau et al, 2005; Hahn et al, 2001; Splechtna et al, 2002; Tawhai et al, 2009; Miyawaki et al, 2012). One common approach to constructing branching tubular models is centerline (CL)-based methods, which extrude a three-dimensional (3-D) surface from a one-dimensional (1-D) tree that consists of skeleton and branch diameters. In CL-based geometric models, anatomical data, e.g., branch name and generation, are associated with the 3-D surface, which greatly facilitates the analysis of computational fluid dynamics (CFD) results by segment, generation, and lobe. However, existing CL-based methods cannot automatically construct trifurcations and have not generally considered curved CLs or irregular cross-sections in a subject-specific manner.
CL-based methods have been applied to visualization and analysis of blood vessel trees. For example, Felkel et al (2004), Volkau et al (2005), Wu et al (2011), and Yuan et al (2012) used a piecewise smooth subdivision surface generator to visualize the surface of vascular structures in liver, brain, and heart. This method smooths an intermediate ‘base mesh’ constructed with a recursive branching-construction procedure, and provides smooth and topologically correct surface meshes of n-furcation branching tubular structures. To analyze vascular structures, Zhang et al (2007) used hexahedral solid NURBS (Non-Uniform Rational B-Splines). In their ‘vascular modeling pipeline,’ a variety of smooth n-furcation branching tubular structures were reconstructed with appropriate branching templates for each mapped meshable region, and circular cross-sections were then adjusted using computed tomography (CT) or magnetic resonance imaging (MRI) data for more realistic non-circular cross-sections. However, the algorithm to automatically select appropriate templates was not presented.
CL-based methods have also been applied to construct airway models. A number of CL-based methods for symmetric airway trees have been used, but they do not capture the asymmetric nature of human airway branching (Horsfield et al, 1971). van Ertbruggen et al (2005) and Tian et al (2011) constructed CL-based asymmetric airway models based on anatomical models of Horsfield et al (1971) and Yeh and Schum (1980), which do not account for inter-subject variability.
A subject-specific 1-D tree of the central airway can be extracted from image data, e.g., CT image (e.g. Palágyi et al, 2006). Beyond imaging resolution, an anatomically-consistent but not exact 1-D tree of unresolved airways can be generated using a volume-filling algorithm that is guided by the resolved airways and lobar boundaries (Tawhai et al, 2000, 2004). Lin et al (2009) and Tawhai et al (2009) presented a computational framework to construct a subject-specific airway model that extends from the glottis to the terminal bronchioles along any ‘paths of interest’ for CFD analysis of pulmonary air flow. Their 3-D model consists of CT-based central airways and anatomically-consistent artificial airways beyond CT resolution. However, this method requires considerable amount of user intervention to construct trifurcations, which are found - at least - in the central airway of the human lung (e.g. Boyden, 1949; Zhao et al, 2009). While most previous geometric methods lack automatic procedures (e.g. van Ertbruggen et al, 2005; Gemci et al, 2008; Tian et al, 2011; Walters et al, 2011), Marchandise et al (2013) proposed a method to automatically construct models for tubular geometry. However, their method is not a CL-based method because it does not reconstruct a 3-D surface from a 1-D tree and each 3-D sub-zone (patch) is not associated with a 1-D branch along with anatomical data.
The objective of this study is to develop an efficient CL-based method that can automatically construct 3-D models of trifurcations in the human airways, given a CT-segmented airway skeleton surface. The criteria and geometric templates to identify, classify, and construct trifurcations are derived from CT lung images of a population of human subjects. The proposed CL-based method constructs straight-CL, curved-CL, and fitted-surface models with increasing realism, depending on the availability of data and the objective of the study.
2 Methods
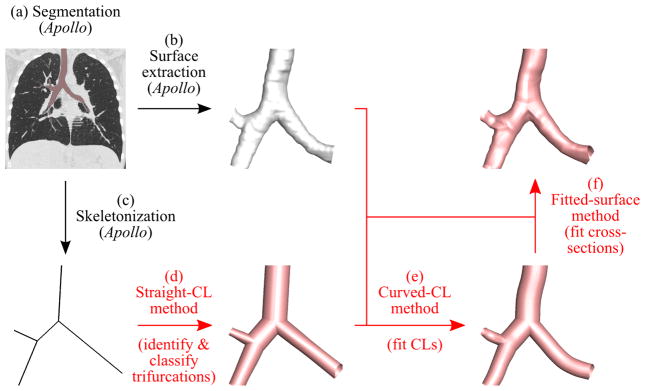
The proposed geometry reconstruction procedure is summarized in the following steps (Fig. 1):
Fig. 1.
Overview of the proposed method. The segmented airways are colored pink in the CT image (a) and white on the extracted surface in (b). The proposed methods in (d) through (f) are highlighted by red, and the reconstructed airway models are shown in pink.
We used the Apollo pulmonary analysis software (VIDA Diagnostics, Coralville, Iowa) to segment the airways from a volumetric CT image, and extract the airway surface geometry and skeletonize it, resulting in a 1-D tree (methods (a)–(c) in Fig. 1).
Using the 1-D tree, we identified and classified trifurcations to reconstruct a 3-D airway geometry with straight branches and circular cross-sections (straight-CL method (d) in Fig. 1).
Using the extracted airway surface and straight-CL model, we reconstructed a 3-D airway geometry with curved branches (curved-CL method (e) in Fig. 1).
Using the extracted airway surface and curved-CL model, we reconstructed a 3-D airway geometry with irregular cross-sections (fitted-surface method (f) in Fig. 1).
We then used the open source software Gmsh (Geuzaine and Remacle, 2009) and the nodal coordinates, curve connectivity, and surface connectivity generated by the above methods to reconstruct the airway models colored in Fig. 1. Step 1 is semi-automatic. Based on the segmented airway skeleton and surface from step 1, the proposed methods in steps 2–4 automatically constructs 3-D airway geometries.
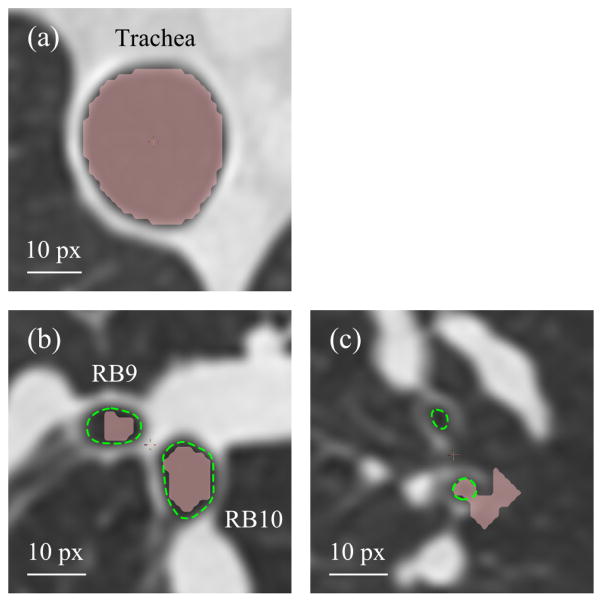
Apollo segments the airways automatically. It also allows manual segmentation if the accuracy of geometry and the resolution of small branches are not desirable after automatic segmentation, depending on the specific application of the final mesh, e.g., visualization vs. CFD analysis (Fig. 2). For example, in large airways, e.g., the trachea, the quality of automatically segmented geometry may be satisfactory for both visualization and CFD analysis (Fig. 2(a)). In medium-sized airways, e.g., the right lateral and posterior basal bronchi (RB9 and RB10), automatic segmentation can underestimate airway luminal area, which results in overestimation of pressure drop in CFD analysis (Fig. 2(b)). But for visualization, automatically segmented airways would be sufficient. In small airways, automatic segmentation can miss branches or create false branches (Fig. 2(c)), thus this requires manual modification for both visualization and CFD analysis. The time required for manual modification depends on the model accuracy that is required for the particular application, and the skill of individual operators.
Fig. 2.
Automatic segmentation of (a) the trachea, (b) the right lateral and posterior basal bronchi (RB9 and RB10), and (c) branches in left upper lobe by Apollo. Automatically segmented regions are filled with pink, and manually identified airway lumens are surrounded by green dashed curves. The pixel size (px) of this slice is 0.68 × 0.68 mm.
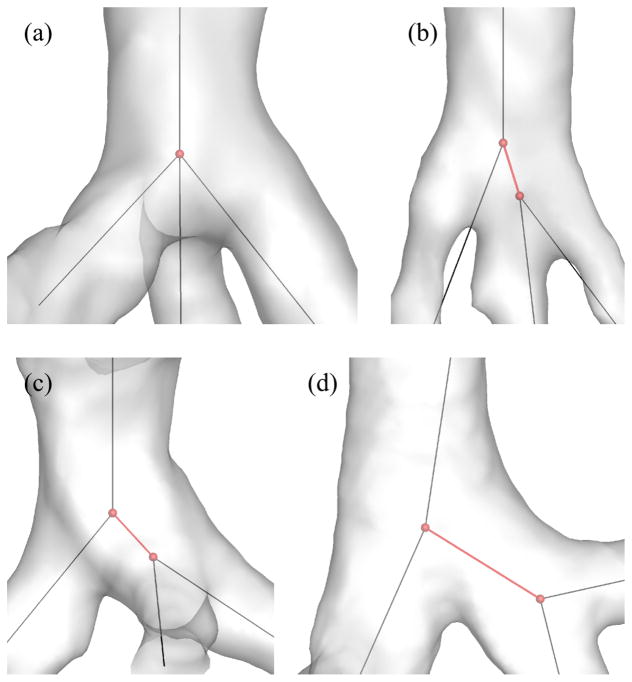
The 1-D tree includes the coordinates of branching points, and the connectivity, names, generation numbers, and average diameters of branches. It should be noted that this 1-D tree contains one straight line per branch regardless of branch curvature. In addition, a volume-filling algorithm can extend the CT-resolved 1- D tree to the terminal bronchioles (Tawhai et al, 2000, 2004). Apollo uses the skeletonization algorithm developed by Palágyi et al (2006), and the skeletonization of 3-D trifurcations yields two types of 1-D trees: a trifurcation and a double bifurcation, which are also referred to as intrinsic and extrinsic trifurcations, respectively, in this study. For example, Fig. 3(a) shows an intrinsic trifurcation (trifurcation in both 1-D and 3-D), Figs. 3(b) and 3(c) show extrinsic trifurcations (double bifurcations in 1-D but trifurcations in 3-D), and Fig. 3(d) shows a double bifurcation (in both 1-D and 3-D).
Fig. 3.
Examples of (a) an intrinsic trifurcation, (b)(c) extrinsic trifurcations, and (d) double bifurcations. The red spheres and lines show the location of centerline nodes and centerlines of interest, respectively.
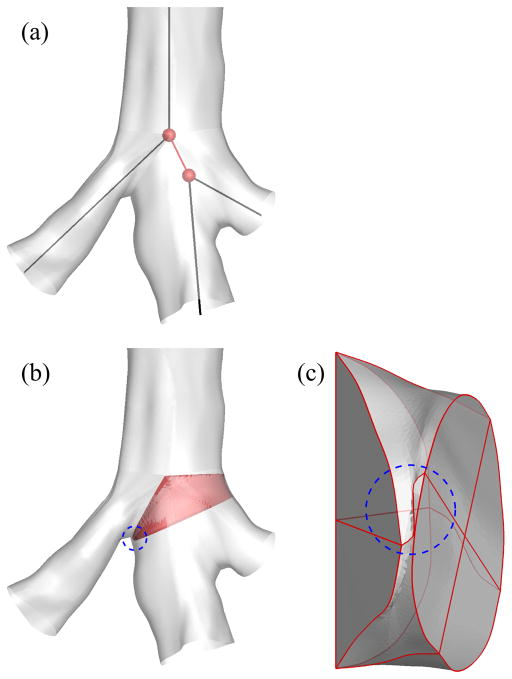
Extrinsic trifurcations exist in part due to the limitation that CLs of three child branches may not intersect in close proximity, requiring an artificial short branch for bridging as denoted by red branches in Figs. 3(b) and 3(c). On the other hand, some double bifurcations in 1-D are actually double bifurcations in 3-D as shown in Fig. 3(d). Reconstruction of 3-D trifurcations from 1-D extrinsic trifurcations using a bifurcation template results in twisted surfaces or surface intersection, i.e., negative Jacobian, due to the short branch (Fig. 4). In addition, unlike bifurcations, the quality of a reconstructed 3-D trifurcation is sensitive to the arrangement of three child branches, such as coplanar and non-coplanar arrangements, which are also referred to as fork- and tripod-type trifurcations, respectively, in this study. Thus, reconstruction of 3-D trifurcations requires criteria to distinguish between extrinsic trifurcations and double bifurcations and between fork- and tripod-type trifurcations, leading to the development of different trifurcation templates.
Fig. 4.
Twisted airway surface due to a short branch: (a) 1-D tree around a branching point, (b) 3-D geometry around the branching point, and (c) 3-D geometry of the short branch. The short branch is colored by red in (b). The twisted region is indicated by a blue dashed circle in (b) and (c).
One can construct the straight-CL model of a branch using its straight CL and average diameter. With the assistance of an image-based surface, e.g., a triangulated airway surface segmented from volumetric images, the straight-CL model can become more realistic by following the two steps corresponding to steps 3 and 4 above:
-
3
changing the straight CL to a curved one to match the image-based airway geometry (a curved-CL model, Fig. 1(e)) and
-
4
fitting the circular cross-section of the curved-CL model to the image-based airway surface that has non-circular cross-section (a fitted-surface model, Fig. 1(f)).
The construction of the curved-CL and fitted-surface models follows that of the straight-CL model. Thus, we first explain the geometric templates and the aforementioned criteria for trifurcations using the straight-CL model. We then present the curved-CL method and finally the fitted-surface method.
To develop methods that are applicable to normal and severe asthmatic (SA) subjects, we utilized the CT volumetric images of 16 normal and 16 SA subjects acquired by the University of Iowa through a Biomedical Research Partnership (BRP) Study and the University of Pittsburgh through the Severe Asthmatic Research Program (SARP). The imaging protocols for acquiring CT images were approved by the Institutional Review Boards of the respective universities. The average voxel size of CT images of all subjects was 0.65 mm × 0.65 mm × 0.60 mm (~ 0.6 mm).
2.1 Geometric template and coordinate system (step 2)
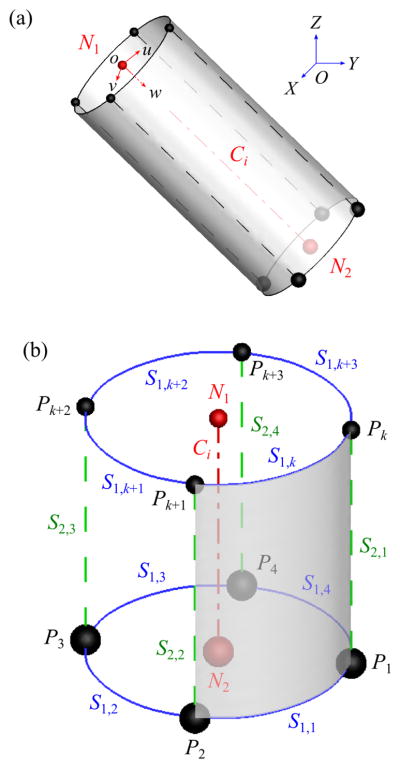
The straight-CL model of the human airway is composed of straight branches with circular cross-sections (Fig. 5). Each branch is surrounded by four quadrilateral curved surfaces, each surface is formed by four curves, each curve is defined by two control nodes (CNs), and each CN consists of nodal coordinates and directions of curves connected to the CN. The four CNs at the proximal or distal end of a branch are here referred to as ‘ring’ nodes because these CNs define four curves that form a closed loop or ‘ring.’ At a straight airway, bifurcation, and trifurcation, the parent branch has one, two, and three child branches, respectively, and the distal end of the parent branch requires one, two, or three sets of ring nodes, respectively, to connect with respective child branches. The ring nodes are constructed only at the distal end of each branch except for the proximal end of the trachea because the ring nodes at the proximal end of the child branch are those at the distal end of its parent branch.
Fig. 5.
(a) A geometric template in both global (OXY Z) and branch (ouvw) coordinate systems, where the red dash-dotted line denotes CL Ci and red spheres denotes centerline nodes N1 and N2. (b) The definition of ring nodes (black spheres: Pk around N1 and Pj around N2), s1-curve (blue solid curves: S1;k around N1 and S1;j around N2), and s2-curve (green dashed lines: S2;j).
Each branch of a 1-D tree consists of one CL Ci (i = 1, 2, …, nb) that connects two centerline nodes (CLNs) N1 and N2 at the proximal and distal ends of Ci, respectively (Fig. 5), where nb is the number of branches. The direction of Ci is positive in the direction of increasing branch generation (Fig. 5(a)). The coordinates of the CNs in the 3-D geometric template for each branch are given in the local coordinate system, called the branch coordinate system (ouvw). The geometric template is then mapped to the global coordinate system (OXY Z) by scale transformation, translation, and rotation defined by Ci, N1, and N2. The origin of ouvw corresponds to N1. The direction of w-axis in OXY Z is the same as the direction of Ci. The direction of v-axis is defined as the direction normal to the plane formed by the child branches of the associated bifurcations to minimize the twist of the surface elements (detailed in Sec. A.1). The direction of u-axis is defined in such a way that ouvw is a right-handed coordinate system.
2.2 Geometric template for straight airways (step 2)
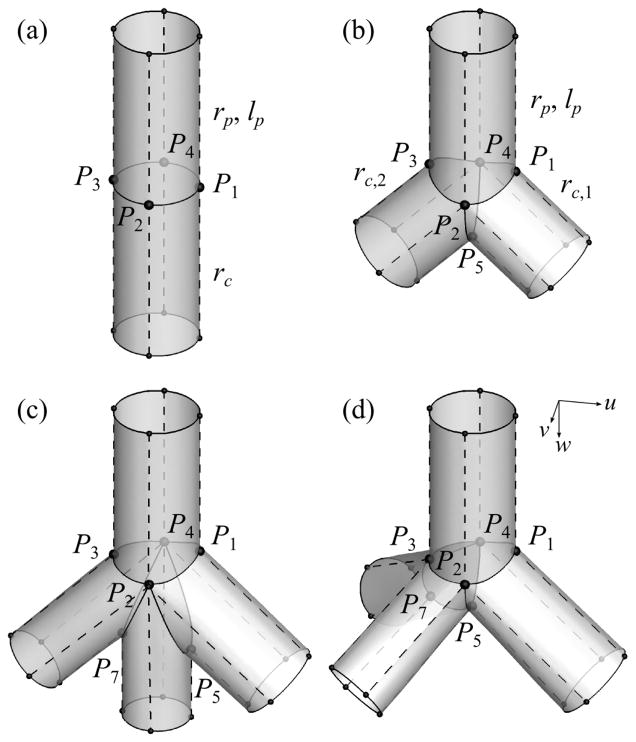
The ending branches do not have any child branch, and the geometric template for straight airways is used (Fig. 5(b)). This template is also used for the sub-branches in the curved-CL and fitted-surface models (Fig. 6(a)), which are explained later. The CNs at N2 consist of four ring nodes: right (P1), front (P2), left (P3), and back (P4) nodes. The (u, v)-coordinates of P1 through P4 are (r, 0), (0, r), (−r, 0), and (0,−r), respectively, where r is defined as r = 0.5 (rp + rc), rp is the radius of the parent branch (top half of Fig. 6(a)), rc is the radius of the child branch (bottom half of Fig. 6(a)), and rp = rc if there is no parent or child branch. The w-coordinate of Pj around N2 is the length of the parent branch (lp). In other words, the geometric template is scaled by r in u- and v-directions and by lp in w-direction. Pj and Pj+1 around N2 are connected by an s1-curve S1,j (blue solid curves in Fig. 5(b)), which is approximately perpendicular to Ci. Therefore, the curves S1,1, S1,2, S1,3, and S1,4 form a ring around N2. Pj around N2 is connected to the nearest Pk around N1 by an s2-curve S2,j (green dashed lines in Fig. 5(b)), which is approximately parallel to Ci, thus there are S2,1, S2,2, S2,3, and S2,4 in each branch. S1,k around N1, S1,j around N2, S2,j, and S2,j+1 compose a quadrilateral surface element (e.g., the shaded region surrounded by S1,1, S2,1, S1,k, and S2,2 in Fig. 5(b)) and four surface elements surround a branch. We use the coordinates of N1, N2, and Pj around N2 to obtain the directions of S1,j and S2,j connected to Pj (Miyawaki, 2013).
Fig. 6.
The CNs in a geometric template for: (a) straight airway, (b) bifurcation, (c) fork-type trifurcation, and (D) tripod-type trifurcation. The control nodes (CNs) P1, P2, P3, P4, P5, and P7 are the right, front, left, back, crux, and left crux nodes, respectively. rp and lp are the radius and length of the parent branch, respectively, and rc, rc;1, and rc;2 are the radii of the child branches. The solid and dashed curves are s1- and s2-curves, respectively. The arrows labeled with u, v, w indicate the directions of the u-, v-, and w-axes in the first segment of each geometry. In (c) and (d), the left crux node (P7) is inserted to split the left child branch in (b) and make the trifurcations, but the right crux node (P6) would be used if the right child branch in (b) is split at different branching points.
2.3 Geometric template for bifurcations (step 2)
The majority of the branching points in the human airways are bifurcations (Fig. 6(b)). The CNs at the distal end of the parent branch of a bifurcation consist of P1 through P4 and one ‘crux’ node P5 that defines the geometry around the carina of the bifurcation. The (u, v)-coordinates of P1 through P4 are the same as those for straight airways except that rc = max (rc,1, rc,2) is the radius of the major child branch and rc,i is the radius of the ith child branch. The w-coordinates of P2 and P4 are the same as those for straight airways, but the w-coordinate of P1, or P3, is at the intersection of the parent and right, or left, child branches if w-coordinate of the intersection is smaller than lp (otherwise the w-coordinate is lp). P5 is located at the intersection of the child branches. The two child branches are connected to the two rings at the distal end of the parent branch: the right ring R1 (P1P2P5P4) and left ring R2 (P5P2P3P4).
2.4 Identification and classification of trifurcations (step 2)
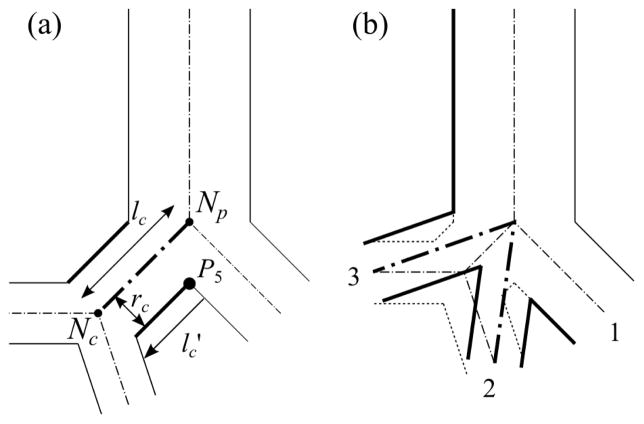
The 3-D extrinsic trifurcations and double bifurcations are both double bifurcations in the 1-D tree (e.g., Figs. 3(b) and 3(d)). To distinguish between the two, we used the directional distance from P5 to the cross-section at the distal end of the child branch (Nc) in w-direction ( ) normalized by rc (Fig. 7(a)):
| (1) |
Fig. 7.
(a) Schematic of the parameters used to identify trifurcations due to potentially short left branch as an example and (b) 3-D extrinsic trifurcation (dotted lines) with 1-D double bifurcations (dot-dashed line) that shall be treated as a trifurcation (bold solid line). The solid lines are the airway walls, and the dash-dotted lines are the CLs. In (a) P5 is the crux node, and lc is the length of the left child branch, (= lc (radius of the right child branch)) is the directional distance from P5 to the cross-section at the distal end of the left child branch, and rc is the radius of the left child branch (Nc. is negative when the distal end of the left child branch is located between the branching point (Np) and P5. In (b) 1–3 show the order of child branches at the trifurcation.
The intrinsic trifurcations can be considered as a special type of the extrinsic trifurcation with the length of child branch ( ) of zero, i.e., . To apply the same algorithm to the extrinsic and intrinsic trifurcations, we converted the intrinsic trifurcations to extrinsic ones by inserting a dummy short branch between the parent branch and the two child branches that have the smallest angle in between. If is zero or negative, the short branch is considered as an artifact of skeletonization in step 1. Then the short branch is removed automatically and the resultant trifurcation is identified as an intrinsic trifurcation.. For example, at the extrinsic trifurcation in Fig. 3(b). If the bifurcation template is used at a branching point with positive but small , the quality of the resulting 3-D surface is poor due to twisted surfaces (Fig. 4). For example, at the extrinsic trifurcation in Fig. 3(c), whereas at the double trifurcation in Fig. 3(d).
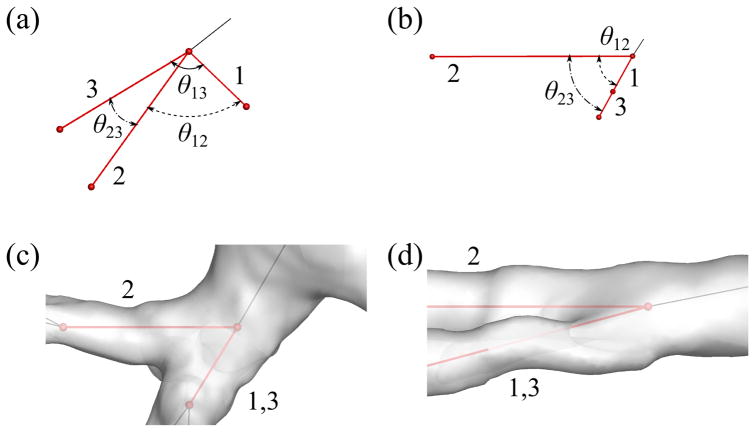
At a trifurcation, the distal end of the parent branch requires three sets of ring nodes, or three rings, to which three child branches are connected. To make three rings, we split one of the two rings in the bifurcation template (Fig. 6(b)) into two rings in two ways, and classified trifurcations into two respective types: fork and tripod types (Figs. 6(c) and 6(d)). The fork type splits a ring into left and right rings (e.g., P7P2P3P4 and P5P2P7P4 in Fig. 6(c))), and the tripod type splits a ring into front and back rings (e.g., P5P2P3P7 and P5P7P3P4 in Fig. 6(d)), as described in detail later. We quantified the difference between the two types using the angles between three child branches (Fig. 8):
| (2) |
where θij is the angle between the ith and jth child branches (Figs. 8(a) and 8(b)). At a perfect fork-type trifurcation, rθ123 = 1.0; at a perfect tripod-type trifurcation, rθ123 = 0.5. At the trifurcations in Figs. 8(c) and 8(d), rθ123 = 0.61 and 0.89, respectively.
Fig. 8.
The definition of the relative angle θij between ith and jth child branches in a trifurcation for classification of trifurcations looking from (a) an arbitrary direction and (b) a direction parallel to the plane defined by the first and third child branches. The trifurcations have: (c) rθ123 (= 0.61) below the threshold value of 0.81 and (d) rθ123 (= 0.89) above the threshold value of 0.81 looking from a direction parallel to the plane defined by the first and third child branches. The black and red lines show the CLs of parent and child branches, respectively, and 1, 2 and 3 show the order of child branches at the trifurcation.
2.5 Geometric template for trifurcations (step 2)
The CNs at N2 of the parent branch of a trifurcation consist of P1 through P5 and another crux node: right (P6) or left (P7) crux node. If the left (or right) child branch in the bifurcation template (Fig. 6(b)) is split to form a trifurcation, P7 (or P6) is used. There exists one more crux node compared with the CNs for the bifurcation template. We use the second crux node as follows to construct the above two types of trifurcations. The second crux node can split one of the two rings at the distal end of the parent branch in the bifurcation template into two rings in two ways. For example, if the short child branch at an extrinsic trifurcation appears on the left hand side and the trifurcation is of fork type (Fig. 6(c)), P7 splits R2 (P5P2P3P4 in Fig. 6(b)) into left and right rings: P7P2P3P4 and P5P2P7P4. The new rings then connect the parent branch with left-left and left-right child branches. If the trifurcation is of tripod type (Fig. 6(d)), P7 splits R2 into front and back rings: P5P2P3P7 and P5P7P3P4, to which left-front and left-back child branches are connected, respectively. The coordinates of P1 through P4 for trifurcations are basically the same as those for bifurcation, but those of P5 through P7 are not (detailed in Sec. A.2).
2.6 Curved-CL and fitted-surface methods (steps 3 and 4)
In the straight-CL model, each branch has a straight CL and circular cross-section. Here, we first describe the curved-CL method that changes a straight CL to a curved one (Fig. 9(a)), and then the fitted-surface method that changes a circular cross-section to a non-circular cross-section as in the image-based airway surface (Fig. 9(b)–(d)).
Fig. 9.
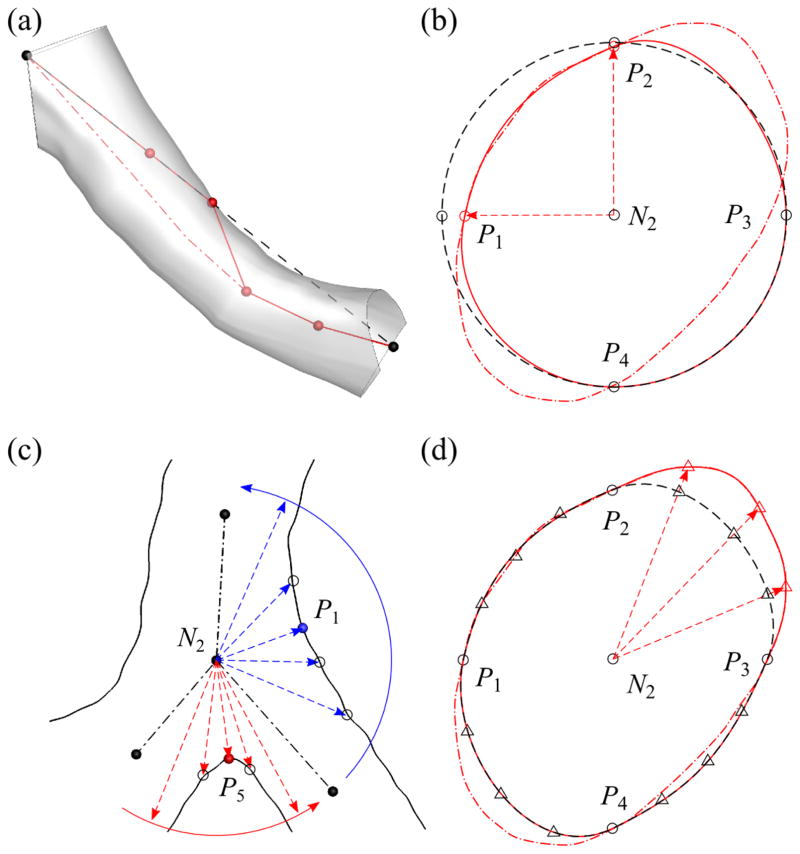
The fitting of (a) N2, (b) Pi (i = 1, 2, 3, 4), (c) Pi (i = 1, 3, 5), and (d) intermediate control nodes (CNs) to image-based surface. The arrows indicate fitting directions. In (a), black dashed line denotes the straight centerline (CL) of a branch; red solid polygon denotes the partially fitted CL; and red dash-dotted curve denotes the curved CL. In (b), black dashed curve denotes the circular cross-section; red solid curve denotes the partially fitted cross-section; and red dash-dotted curve denotes the cross-section of the image-based surface. In (c), black solid curves denote the image-based surface; black dash-dotted lines show CLs. In (d), black dashed curve denotes the cross-section after ring nodes are fitted; red solid curve denotes the partially fitted cross-section using intermediate CNs; and red dash-dotted curve denotes the cross-section of image-based surface.
The curved-CL method (step 3) involves the two sub-steps (Fig. 9(a)):
-
3a
inserting additional CLNs to a branch CL to make sub-branches and
-
3b
estimating the locations of inserted CLNs using the image-based airway surface.
Ideally, the shorter the sub-branch length is, the more accurate the reconstructed geometry is. However, we set the sub-branch length to approximately the average radius of the branch to avoid intersection of cross-sections in curved branches (similar to Fig. 4(c)). Some of the inserted CLNs could fall outside of a curved branch as shown in Fig. 9(a). At each CLN, we apply the clustering algorithm DBSCAN (Density Based Spatial Clustering of Applications with Noise) (Ester et al, 1996) to distinguish the triangular elements of the image-based airway surface around the CLN from those around its neighboring CLNs. We then use these surface elements to estimate the new location of the CLN. The above sub-steps are applied to all inserted CLNs.
Using the above curved-CL model as the initial geometry, the fitted-surface method (step 4) follows the three sub-steps:
-
4a
fitting P1, P2, P3, and P4 around all N2 (Fig. 9(b)),
-
4b
fitting P1, P3, P5, and P6, or P7, around N2 at branching points (Fig. 9(c)), and
-
4c
inserting intermediate CNs and fitting them to the image-based airway surface (Fig. 9(d)).
Here P1 and P3 are fit twice in steps 4a and 4b along the radial and axial directions, respectively. In step 4a, the new location of a fitted Pi is the intersection of the image-based surface and the line defined by N2 and the original location of Pi (Fig. 9(b)). In step 4b, we use the circular sector defined by Ci of the two child branches (the dot-dashed lines in Fig. 9(c)) to narrow down the search region for the new location of Pj (j = 5, 6, 7). The point on the image-based surface nearest to N2 is selected as the new Pj. The same method is applied to Pj (j = 1, 3), e.g., as illustrated by the blue arrows in Fig. 9(c) for P1.
In the geometric templates designed for circular cross-sections, P1 through P4 are sufficient to obtain an accurate model. However, intermediate CNs are needed for irregular cross-sections. Thus, in step 4c, as illustrated in Fig. 9(d), we insert three intermediate ring nodes, which are marked by triangles, to each of S1,i (i = 1, 2, 3, 4) using a cubic Hermite interpolation function (Fernandez et al, 2004). The new location of a fitted intermediate CN on S1,i is the intersection of the image-based airway surface and the line defined by N2 and the original location of the intermediate CN. The same method is applied to S2,i (i = 1, 2, 3, 4). The number of intermediate CNs on each S1,i, or S2,i, was empirically determined by considering both accuracy and complexity of the model.
2.7 Construction of 3-D airway geometry
The above straight-CL, curved-CL, and fitted-surface models define s-curves and quadrilateral surface elements to construct 3-D geometries. These curves and surfaces correspond to the functions “spline curves” and “ruled surfaces” in Gmsh. With the coordinates of CNs and intermediate CNs, s-curve connectivity, and surface element connectivity, Gmsh can construct the 3-D geometry.
3 Results
3.1 Identification and classification of trifurcations
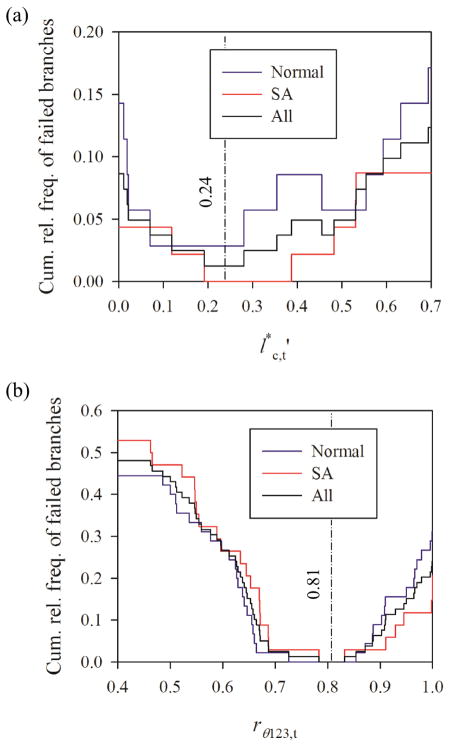
The optimal threshold values and rθ123,t for the parameters defined in Eqs. 1 and 2, respectively, were assessed based upon the quality of fitted-surface models for 16 normal and 16 SA subjects. To find the optimal , we focused on the range of because branching points would be clearly trifurcations or double bifurcations otherwise. The relative frequency of failure to construct branches due to twisted surface, i.e., negative Jacobian, was minimum when for normal subjects and for SA subjects, i.e., for all, normal and SA, subjects (Fig. 10(a)). The relative frequencies of branches with in normal and SA subjects were not significantly different (p = 0.39). In this study, we chose because the rate of success in constructing branches for normal, SA, and all subjects are 97%, 100%, and 99%, respectively. To classify trifurcations to fork and tripod types, we analyzed rθ123,t. The method did not fail when 0.726 < rθ123,t < 0.854 for normal subjects and 0.784 < rθ123,t < 0.832 for SA subjects, i.e., 0.784 < rθ123,t < 0.832 for all subjects (Fig. 10(b)). We chose rθ123,t = 0.81 to achieve the success rate of 100% in all subjects regardless of population group.
Fig. 10.
The cumulative relative frequency of failed branches as a function of the threshold value for (a) and (b) rθ123 = θ13= (θ12 + θ23). The relative frequencies are based on (a) 35 normal and 46 severe asthmatic branches with and (b) 45 normal and 34 severe asthmatic branching points in the central airways of 16 normal and 16 severe asthmatic subjects.
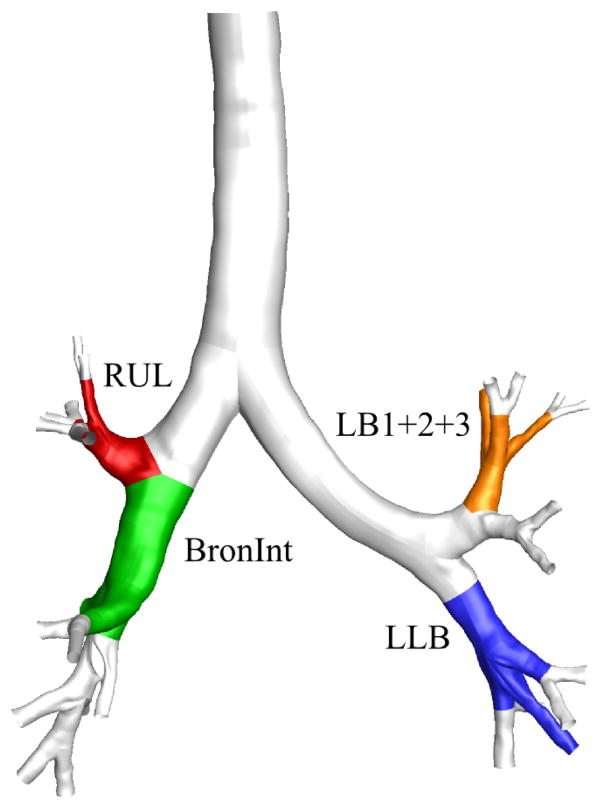
With the selected threshold values of and rθ123,c = 0.81, we found that 100% of normal subjects and 94% of SA subjects had at least one trifurcation in the CT-resolved airway. Furthermore, 19% of normal subjects and 0% of SA subjects had a quadfurcation, and all of the quadfurcations were located at the distal end of the left lower lobar bronchus (LLB). The four most frequent locations of trifurcations were at the distal end of the left upper division bronchus (LB1+2+3), LLB, right upper lobar bronchus (RUL), and right intermediate bronchus (BronInt) (orange, blue, red, and green regions in Fig. 11). There was no significant difference between the existence of trifurcations in normal and SA subjects at the four locations (p = 0.26 at LB1+2+3, and p = 0.07 at LLB, p = 0.37 at RUL, and p = 0.41 at BronInt). In addition, there was no significant difference between the type of trifurcations in normal and SA subjects at the four locations (p = 0.62 at LLB and p = 0.11 at RUL), where p-value was not available at LB1+2+3 and BronInt because only one type of trifurcation existed in both normal and SA subjects. 34%, 19%, 81%, and 25% of all subjects had a trifurcation at LB1+2+3, LLB, RUL, and BronInt, respectively. Furthermore, 0%, 83%, 8%, and 100% of trifurcations were of fork type (i.e., 100%, 17%, 92%, and 0% of trifurcations were of tripod type) in all subjects at LB1+2+3, LLB, RUL, and BronInt, respectively.
Fig. 11.
The four most frequent locations of trifurcations: the left upper division bronchus (LB1+2+3), left lower lobar bronchus (LLB), right upper lobar bronchus (RUL), and right intermediate bronchus (BronInt).
3.2 Assessment of straight-CL, curved-CL, and fitted-surface models
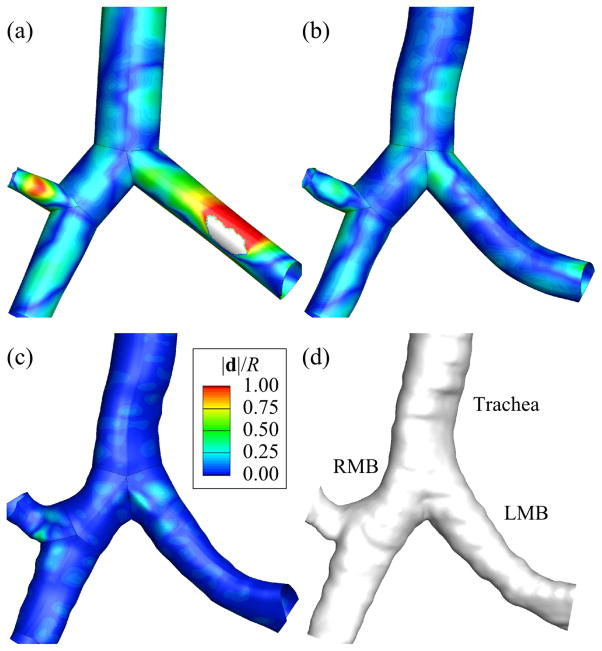
The major sources of error in the geometry of the straight-CL model are the lack of curvature of the CL and the circular cross-section. The cross-section error is estimated here by subtracting the CL error from the surface error. To assess the CL error, we computed the average distance between the straight CL and curved CL. It should be noted that curved-CL and fitted-surface models have the same CLs. To assess the surface error, we computed the average distance between the surfaces of reconstructed straight-CL, curved-CL, and fitted-surface models and the image-based surface. These errors were estimated branch by branch and normalized by the corresponding branch radius. The global error is defined as the average of normalized errors of all branches. For instance, the normalized CL error was 0.55 in the left main bronchus (LMB) of a normal subject, which means the average distance between straight and curved CLs was 55% of the radius of the LMB. The global CL error of the same subject was 0.14. Fig. 12 shows the contours of normalized surface error in the straight-CL, curved-CL, and fitted-surface models (Figs. 12(a), 12(b), and 12(c)) relative to the image-based surface of the normal subject (Fig. 12(d)). The normalized surface errors in the LMB were 0.50, 0.094, and 0.025 for the straight-CL, curved-CL, and fitted-surface models, respectively. The global surface errors of the same subject were 0.25, 0.12, and 0.028 for the straight-CL, curved-CL, and fitted-surface models, respectively.
Fig. 12.
The surfaces of (a) centerline (CL), (b) curved-CL, and (c) fitted-surface models and (d) computed tomography (CT)-based surface around the first bifurcation. d is the radial distance between the surfaces of each model and the CT-based surface, and R is the branch radius. LMB and RMB are left and right main bronchus, respectively.
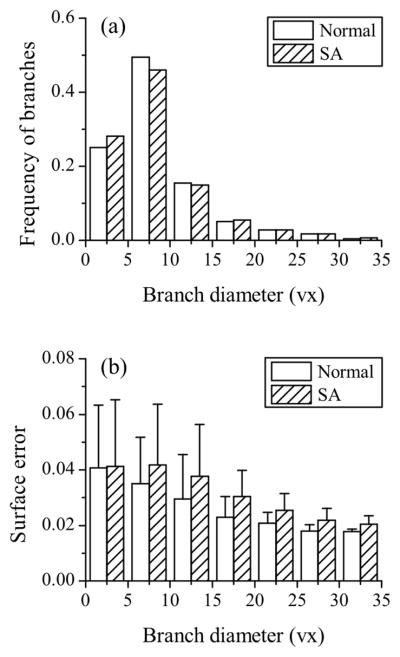
When considering all of the 16 normal and 16 SA subjects, the average global surface errors were 0.035 and 0.039 (p < 0.01), respectively. For comparison, by assuming an absolute error of a half image voxel size of 0.3 mm in all branches, the resulting global surface errors were 0.155 and 0.172 for normal and SA subjects (p = 0.19), respectively. Fig. 13 shows the distribution of surface error as a function of branch diameter. The mean and standard deviation of surface error decreased exponentially with increasing branch diameter, and the mean approached 0.02 for both normal and SA subjects.
Fig. 13.
The distributions of (a) branch diameter and (b) surface error. The numbers of branches considered for normal and severe asthmatic (SA) subjects were both 727. Branch diameter was normalized by average voxel size (vx) of 0.6 mm, and the surface error was normalized by each branch radius. The error bars show the standard deviation. Summation of the products of frequency and surface error gives average surface error.
3.3 Combination of straight-CL and fitted-surface models
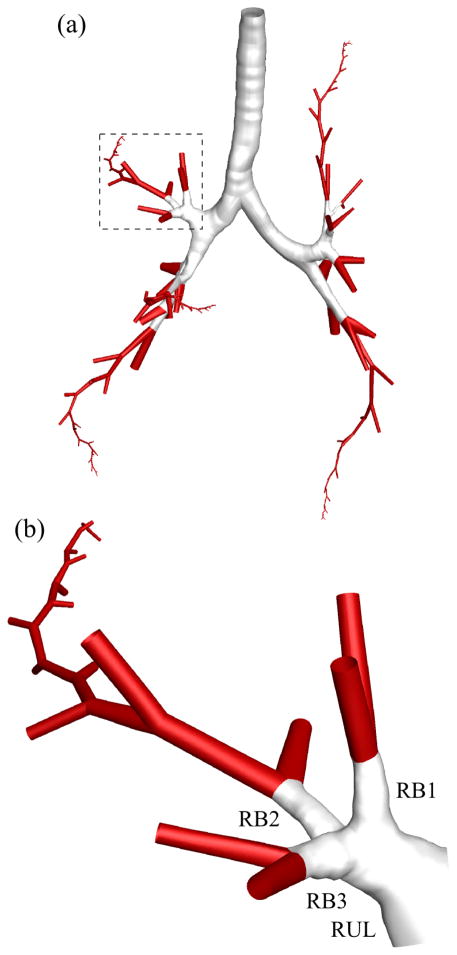
Since the straight-CL model only requires a 1-D tree without sub-branches, our method can construct the 3-D geometry of branches that consist of CT-resolved airways and those beyond CT resolution generated with, e.g., the volume-filling algorithm developed by Tawhai et al (2000, 2004). Fig. 14 shows a 3-D multiscale airway geometry of an arbitrary five paths that extend from the trachea to terminal bronchioles in the five lobes. The transition from resolved to unresolved branches was seamless.
Fig. 14.
(a) Three-dimensional multiscale geometry of arbitrary five paths in a normal subject including CT-resolved (white) and CT-unresolved (red) branches. (b) The geometry of a path in right upper lobe.
3.4 Example application to CFD-based aerosol simulation
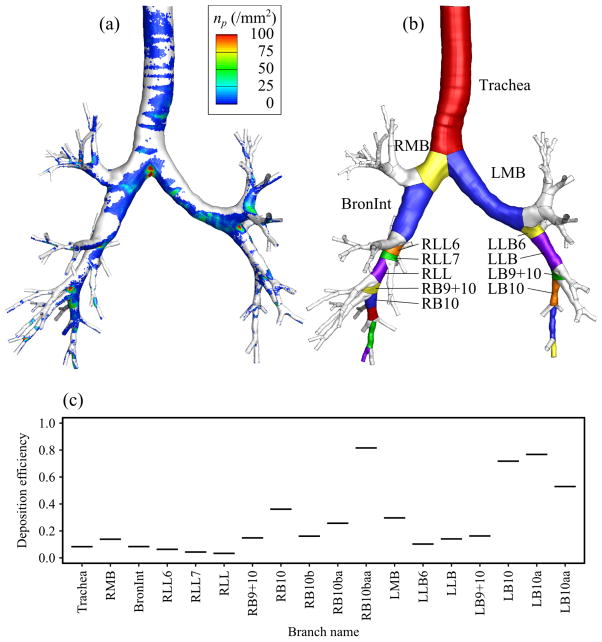
One of the major applications of CL-based geometric model is CFD-based simulation of aerosol transport in the human lung. As an example, we simulated particle transport in turbulent air-flow in the fitted-surface model of a healthy subject by means of large eddy simulation model and Lagrangian particle tracking algorithm as Miyawaki et al (2012) did with the CT-based model. The steady inspiratory flow rate of 20 L/min was imposed at the inlet, and 220,000 spherical particles with diameter of 20 μm were released into the simulated air-flow. 20-μm particles were used for demonstration purposes because most of small particles do not deposit in the central airway. The density distribution of deposited particles is shown in Fig. 15(a). The high concentrations of deposited particles were found at the inner wall of bifurcations and the upstream of cartilaginous rings. Most importantly, the branch-by-branch partitioning feature of the current fitted-surface method (Fig. 15(b)) made it easy to compute and analyze the deposition efficiency, ratio of number of deposited particles to that of entered particles, branch by branch as shown in Fig. 15(c). The average difference between the branch deposition efficiencies predicted by the fitted-surface model and that by the CT-based model reported by Miyawaki et al (2012) was less than 5%.
Fig. 15.
(a) Density distribution of 20-μm particles on airway wall (np in particles per mm2) predicted with the fitted-surface model, (b) illustration of the branches partitioned with the fitted-surface method, and (c) automatic computation of branch deposition efficiencies.
4 Discussion
Ideally, the methods to construct a 3-D geometry of a branching structure should possess the following features. The methods can construct: (i) geometry automatically for population-based studies, (ii) trifurcations to retain the original airway topology, given a CT-segmented airway skeleton and surface, (iii) geometry that can be used for automatic generation of a computational mesh for CFD analysis, and (iv) geometry based only on a 1-D tree for idealized branches. Therefore, in the present study, we developed the criteria, trifurcation templates, and fitting method to automatically identify, classify, and construct realistic 3-D trifurcations from 1-D trees. This list of features will be discussed later.
4.1 Accuracy of geometric models
By assuming an absolute error of a half voxel size of 0.3 mm in all branches, the global surface errors based on 16 normal, 16 SA, and all subjects were 15.5%, 17.2%, and 16.4%, respectively. In comparison, the global surface errors in the fitted-surface models for 16 normal, 16 SA, and all subjects were 3.5%, 3.9%, and 3.7%, respectively. A slightly larger error in SA subjects can be attributed to the presence of constricted airways in these subjects. Overall, the errors fall well within the accuracy of a half voxel size in CT images. The effect of voxel size on the surface error depends on airway diameter. The normalized error in large airways is smaller than that of small airways. Therefore, the error in small airways is more sensitive to voxel size.
The average error in the fitted-surface airway models for 16 normal subjects in the present study (3.7% of airway radius or 11% of voxel size) is compared with those in the vessel models reported by Yuan et al (2012) and Wu et al (2011). Yuan et al (2012) used a CL-based method to reconstruct the geometry of a liver-vessel tree model, and reported that the error in their reconstructed geometry was 17% of vessel diameter, i.e., 34% of vessel radius. Wu et al (2011) reconstructed the geometry of a brain-vessel tree using a CL-based method, and the error in their reconstructed geometry was less than 0.4 mm, where voxel size was 0.48 × 0.48 × 1 mm (= 0.61 mm), i.e., the error was less than 65% of voxel size. The average error was not reported by Wu et al (2011). Therefore, the error in the present models is smaller than in other models, although the organ and number of subjects studied are different.
The global surface error in the curved-CL model based on a normal subject was smaller but comparable to the uncertainty in the CT-based surface due to voxel size. However, the global surface error in the straight-CL model based on the normal subject was larger than the uncertainty in the CT-based geometry due to voxel size. Based on the comparison between the straight-CL, curved-CL, and fitted-surface models of a normal subject, the CL and cross-section errors account for 59% and 41% of surface error, respectively.
4.2 Trifurcations in the human airways
From an anatomical point of view, it is important to identify trifurcations systematically because prevalence of trifurcations affects the generation number of descendant branches. In addition, NIH funded multi-center trial studies, e.g., COPDGen, SPIROMICS, and MESA, aim to establish the relationships between genotypes and phenotypes of the human lungs, including airway structure. Accurate representation of airway structure is critical in differentiating among sub-populations and their susceptibility to lung diseases (Shi et al, 2009).
With the optimal threshold values of and rθ123,t = 0.81, we examined the number and type of trifurcations in 16 normal and 16 SA subjects. 97% of all subjects had at least one trifurcation in their central airways, which means that a method without a trifurcation template would need to ignore at least one branch in the central airways which may ventilate to a large portion of the lung. In addition, most of the trifurcations at LB1+2+3 and RUL were of tripod type, while trifurcations at LLB and BronInt were mostly of fork type. This shows not only the requirement of two trifurcation templates in the method but also topological features of trifurcations in the central airway of the human lung from an anatomical point of view.
The distribution of trifurcations in the central airways of 16 normal subjects can be compared with the observations by Boyden (1949) and Zhao et al (2009). In the present study, 25%, 31%, and 81% of subjects had a trifurcation at LB1+2+3, LLB, and RUL, respectively. Boyden (1949) investigated the trifurcations in the upper lobes in 50 subjects to find a trifurcation at RUL in 46% of the subjects, while Zhao et al (2009) examined the structure of the left lung in 216 subjects to observe the existence of a trifurcation at LB1+2+3 and LLB in 23% and 18% of the subjects, respectively. The difference between the frequencies of trifurcations in the present and previous studies was not significant at LB1+2+3 (p = 0.87) but significant at LLB (p = 0.049) and at RUL (p < 0.01). These differences may be attributed to the criteria that are used to define trifurcations and the sample size. Both the present and previous studies agree that LB1+2+3, LLB, and RUL are frequent locations of trifurcations in the central airways of the human lung.
4.3 automatic construction of geometry
Several studies have developed methods to construct the 3-D geometry of vessel and airway trees from 1-D trees. Felkel et al (2004), Volkau et al (2005), and Wu et al (2011) used piecewise smooth subdivision surface generators to construct the surface geometry of vessel trees for visualization purpose, but it is not clear if one can use the surface geometry to automatically generate computational meshes (feature (iii) listed above). Zhang et al (2007) constructed the geometry of vessel trees using NURBS. This method uses three levels of resolution for control nodes depending on the difference between the diameters of ‘master’ and ‘slave’ branches, and five types of trifurcation depending on the topology of trifurcations. However, they did not provide the quantitative criteria to automatically identify trifurcation types and associated resolutions, which is crucial for automatic construction of geometry (feature (i)). In addition, the classification of trifurcations into five types was based on the topology of the human vascular tree, thus it is not clear whether it is applicable to airway trees. van Ertbruggen et al (2005) and Tian et al (2011) constructed the geometry of airway trees by combining units of bifurcation geometry whose dimensions were determined empirically. They did not describe the method to automatically construct the geometry (feature (i)), and their models do not include trifurcations (feature (ii)). The method proposed by Marchandise et al (2013) automatically constructs and meshes the geometry of branching structure including trifurcations (features (i)–(iii)), but their method uses surface geometry as input (feature (iv)).
4.4 Potential applications and limitations
The straight-CL, curved-CL, and fitted-surface models can be used in various applications, e.g., visualization and CFD simulations of gas flow in the human airway. The fitted-surface method can construct a realistic airway model, while the straight-CL and curved-CL methods can construct idealized models with any skeletons and/or diameters including the airways beyond imaging resolution for a test of any hypothesis related to airway structure. As an example, we simulated aerosol transport in the fitted-surface model. The results agreed well with the CT-based model in our previous study with the overall average error of less than 5%. In contrast to the CT-based model, the proposed CL-based method is able to automatically partition the model branch-by-branch, identify trifurcations, and mesh the model. These features allow us to efficiently specify boundary conditions for branches, and analyze air-flow and particle data branch by branch to find CFD-based phenotypes. Thus, the proposed method can greatly facilitate a population-based analysis toward individualized medicine (Lin et al, 2013).
The current methods do not account for branching points with more than three child branches. Quadfurcations exist in the human lung, although the frequency was only 4% of the frequency of trifurcations in this study. With the current method, if there exists four child branches, then one child branch needs to be removed or the skeleton needs to be manipulated so that it becomes one trifurcation and one bifurcation. Nevertheless, for future work, one of the three rings at the distal end of the trifurcation templates could be further split into two rings to make quadfurcation templates.
5 Conclusions
We developed a method to automatically construct 3-D geometric models of human airways that can be applied to, e.g., visualization and CFD simulations, given a CT-segmented airway skeleton and surface. The method was successfully applied to multiple normal and diseased subjects, and the accuracy of the reconstructed geometry was about 10% of the average image voxel size. We also demonstrated the construction of a 3-D geometric model including CT-unresolved branches, and an example application of CFD-based aerosol simulation. The method offers four significant features. First, as the method is automatic, it can greatly facilitate analysis in population-based studies. Second, the method is capable of constructing trifurcations, which existed in more than 90% of normal and SA subjects considered in this study. Third, the reconstructed geometric models have sufficient quality and information to automatically generate 3-D CFD meshes including boundary conditions. Fourth, the method can construct a geometric model using only a skeleton and diameters, which allows geometric models with idealized skeleton and/or diameters.
Acknowledgments
The authors are grateful to the Severe Asthma Research Project (SARP) for assisting with the acquisition of computed tomography data and Sanghun Choi for his comments on the present study. We also thank the San Diego Supercomputer Center (SDSC), the Texas Advanced Computing Center (TACC), and Extreme Science and engineering Discovery Environment (XSEDE) sponsored by the National Science Foundation for the computational time.
This work was supported in part by NIH grants U01-HL114494, R01-HL094315, R01-HL112986, and S10-RR022421.
A Appendix
A.1 Identification of associated bifurcaitons for direction of v-axis
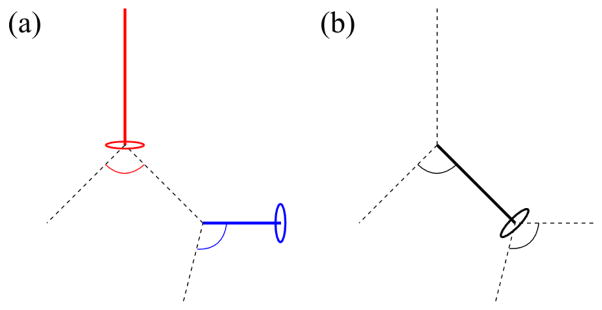
The direction of v-axis is defined as follows. If the branch is not a child branch of the previous bifurcation (red line and circle in Fig. 16(a)), i.e., the trachea, the nearest bifurcation in the positive CL direction (red arc in Fig. 16(a)) is associated. If the branch is a child branch of the previous bifurcation as well as the parent branch of the following bifurcation (thick black line and circle in Fig. 16(b)), both bifurcations (black arcs in Fig. 16(b)) are associated. If there is no bifurcation in the positive CL direction (blue line and circle in Fig. 16(a)), i.e., ending branches, the nearest bifurcation in the negative CL direction (blue arc in Fig. 16(a)) is associated.
Fig. 16.
The bifurcations that are associated with branches to determine the direction of v-axis in OXY Z at: (b) a branch that does not have neighboring bifurcations in the negative centerline (CL) direction (red), a branch that does not have neighboring bifurcations in the positive CL direction (blue), and (c) a branch that have neighboring bifurcations in both negative and positive CL directions (black). Solid lines denote the branches of interest, circles denote the rings at the distal end of branches, and arcs denote the bifurcations associated with the branches.
A.2 Coordinates of crux nodes around trifurcations
At a fork-type trifurcation, the coordinates of P5 and P6, or P7, are determined by the two nearest child branches. At a tripod-type trifurcation, e.g., whose child branches are right, left-front, and left-back child branches, the coordinates of P7 are determined by the left-front and left-back child branches. The coordinates of P5 are the averages of two intersections of the child branches: the one between right and left-front child branches (the curve P2P5 in Fig. 6(d)) and the one between right and left-back child branches (the curve P4P5 in Fig. 6(d)).
Footnotes
Conflicts of interest
This work was supported in part by NIH grants U01-HL114494, R01-HL094315, R01-HL112986, and S10-RR022421. Eric A. Hoffman is a shareholder in VIDA diagnostics that is commercializing lung image analysis software derived by the University of Iowa lung imaging group. He is also a member of the Siemens CT advisory board. Shinjiro Miyawaki, Merryn H. Tawhai, Sally E. Wenzel, and Ching-Long Lin declare that they have no conflict of interest.
Contributor Information
Shinjiro Miyawaki, IIHR-Hydroscience & Engineering, University of Iowa, Iowa City, IA 52242 USA.
Merryn H. Tawhai, Auckland Bioengineering Institute, University of Auckland, Auckland, New Zealand
Eric A. Hoffman, Department of Biomedical Engineering, Medicine, and Radiology, University of Iowa, Iowa City, IA 52242 USA
Sally E. Wenzel, Division of Pulmonary, Allergy, and Critical Care Medicine, University of Pittsburgh, PA 15213, USA
Ching-Long Lin, IIHR-Hydroscience & Engineering and the Department of Mechanical and Industrial Engineering, University of Iowa, 3131 Seamans Center, Iowa City, IA 52242 USA.
References
- Boyden EA. A synthesis of the prevailing patterns of the bronchopulmonary segments in the light of their variations. CHEST Journal. 1949;15(6):657–668. doi: 10.1378/chest.15.6.657. [DOI] [PubMed] [Google Scholar]
- van Ertbruggen C, Hirsch C, Paiva M. Anatomically based three-dimensional model of airways to simulate flow and particle transport using computational fluid dynamics. Journal of applied physiology. 2005;98(3):970–980. doi: 10.1152/japplphysiol.00795.2004. [DOI] [PubMed] [Google Scholar]
- Ester M, Kriegel HP, Sander J, Xu X. Proceedings of the 2nd International Conference on Knowledge Discovery and Data mining. AAAI Press; 1996. A density-based algorithm for discovering clusters in large spatial databases with noise; pp. 226–231. [Google Scholar]
- Felkel P, Wegenkittl R, Buhler K. Proceedings of Computer Graphics International. IEEE; 2004. Surface models of tube trees; pp. 70–77. [DOI] [Google Scholar]
- Fernandez J, Mithraratne P, Thrupp S, Tawhai M, Hunter P. Anatomically based geometric modelling of the musculoskeletal system and other organs. Biomechanics and Modeling in Mechanobiology. 2004;2(3):139–155. doi: 10.1007/s10237-003-0036-1. [DOI] [PubMed] [Google Scholar]
- Gemci T, Ponyavin V, Chen Y, Chen H, Collins R. Computational model of air flow in upper 17 generations of human respiratory tract. Journal of Biomechanics. 2008;41(9):2047–2054. doi: 10.1016/j.jbiomech.2007.12.019. [DOI] [PubMed] [Google Scholar]
- Geuzaine C, Remacle JF. Gmsh: A 3-D finite element mesh generator with built-in pre-and post-processing facilities. International Journal for Numerical Methods in Engineering. 2009;79(11):1309–1331. doi: 10.1002/nme.2579. [DOI] [Google Scholar]
- Hahn HK, Preim B, Selle D, Peitgen HO. Proceedings of IEEE Visualization. IEEE; 2001. Visualization and interaction techniques for the exploration of vascular structures; pp. 395–578. [DOI] [Google Scholar]
- Horsfield K, Dart G, Olson DE, Filley GF, Cumming G. Models of the human bronchial tree. Journal of Applied Physiology. 1971;31(2):207–217. doi: 10.1152/jappl.1971.31.2.207. [DOI] [PubMed] [Google Scholar]
- Lin CL, Tawhai M, McLennan G, Hoffman E. Multi-scale simulation of gas flow in subject-specific models of the human lung. IEEE Eng Med Biol Mag. 2009;28(3):25–33. doi: 10.1109/MEMB.2009.932480. [DOI] [PubMed] [Google Scholar]
- Lin CL, Tawhai MH, Hoffman EA. Multiscale image-based modeling and simulation of gas flow and particle transport in the human lungs. Wiley Interdisciplinary Reviews: Systems Biology and Medicine. 2013;5:643–655. doi: 10.1002/wsbm.1234. [DOI] [PMC free article] [PubMed] [Google Scholar]
- Marchandise E, Geuzaine C, Remacle J. Cardiovascular and lung mesh generation based on centerlines. International journal for numerical methods in biomedical engineering. 2013;29(6):655–682. doi: 10.1002/cnm.2549. [DOI] [PubMed] [Google Scholar]
- Miyawaki S. PhD thesis. University of Iowa; 2013. Automatic construction and meshing of multiscale image-based human airway models for simulations of aerosol delivery. [Google Scholar]
- Miyawaki S, Tawhai MH, Hoffman EA, Lin CL. Effect of carrier gas properties on aerosol distribution in a CT-based human airway numerical model. Annals of biomedical engineering. 2012;40(7):1495–1507. doi: 10.1007/s10439-011-0503-2. [DOI] [PMC free article] [PubMed] [Google Scholar]
- Palágyi K, Tschirren J, Hoffman EA, Sonka M. Quantitative analysis of pulmonary airway tree structures. Computers in biology and medicine. 2006;36(9):974–996. doi: 10.1016/j.compbiomed.2005.05.004. [DOI] [PubMed] [Google Scholar]
- Shi W, Chen F, Cardoso WV. Mechanisms of lung development. Proc Am Thorac Soc. 2009;6(7):558–563. doi: 10.1513/pats.200905-031RM. [DOI] [PMC free article] [PubMed] [Google Scholar]
- Splechtna RC, Fuhrmann AL, Wegenkittl R. VRVis Research Center Technical Report. 2002. ARAS -augmented reality aided surgery system description. [Google Scholar]
- Tawhai MH, Pullan A, Hunter P. Generation of an anatomically based three-dimensional model of the conducting airways. Annals of Biomedical Engineering. 2000;28(7):793–802. doi: 10.1114/1.1289457. [DOI] [PubMed] [Google Scholar]
- Tawhai MH, Hunter P, Tschirren J, Reinhardt J, McLennan G, Hoffman EA. CT-based geometry analysis and finite element models of the human and ovine bronchial tree. Journal of applied physiology. 2004;97(6):2310–2321. doi: 10.1152/japplphysiol.00520.2004. [DOI] [PubMed] [Google Scholar]
- Tawhai MH, Hoffman EA, Lin CL. The lung physiome: merging imaging-based measures with predictive computational models. Wiley Interdisciplinary Reviews: Systems Biology and Medicine. 2009;1(1):61–72. doi: 10.1002/wsbm.17. [DOI] [PMC free article] [PubMed] [Google Scholar]
- Tian G, Longest P, Su G, Walenga RL, Hindle M. Development of a stochastic individual path (SIP) model for predicting the tracheobronchial deposition of pharmaceutical aerosols: Effects of transient inhalation and sampling the airways. Journal of Aerosol Science. 2011;42(11):781–799. doi: 10.1016/j.jaerosci.2011.07.005. [DOI] [Google Scholar]
- Volkau I, Zheng W, Baimouratov R, Aziz A, Nowinski WL. Geometric modeling of the human normal cerebral arterial system. Medical Imaging, IEEE Transactions on. 2005;24(4):529–539. doi: 10.1109/TMI.2005.845041. [DOI] [PubMed] [Google Scholar]
- Walters D, Burgreen G, Lavallee D, Thompson D, Hester R. Efficient, physiologically realistic lung air flow simulations. Biomedical Engineering, IEEE Transactions on. 2011;58(10):3016–3019. doi: 10.1109/TBME.2011.2161868. [DOI] [PubMed] [Google Scholar]
- Wu X, Luboz V, Krissian K, Cotin S, Dawson S. Segmentation and reconstruction of vascular structures for 3D real-time simulation. Medical image analysis. 2011;15(1):22–34. doi: 10.1016/j.media.2010.06.006. [DOI] [PubMed] [Google Scholar]
- Yeh HC, Schum G. Models of human lung airways and their application to inhaled particle deposition. Bulletin of mathematical biology. 1980;42(3):461–480. doi: 10.1016/S0092-8240(80)80060-7. [DOI] [PubMed] [Google Scholar]
- Yuan F, Chi Y, Huang S, Liu J. Modeling n-furcated liver vessels from a 3-D segmented volume using hole-making and subdivision methods. Biomedical Engineering, IEEE Transactions on. 2012;59(2):552–561. doi: 10.1109/TBME.2011.2176728. [DOI] [PubMed] [Google Scholar]
- Zhang Y, Bazilevs Y, Goswami S, Bajaj CL, Hughes TJR. Patient-specific vascular NURBS modeling for iso-geometric analysis of blood flow. Computer Methods in Applied Mechanics and Engineering. 2007;196(29–30):2943–2959. doi: 10.1016/j.cma.2007.02.009. [DOI] [PMC free article] [PubMed] [Google Scholar]
- Zhao X, Ju Y, Liu C, Li J, Huang M, Sun J, Wang T. Bronchial anatomy of left lung: a study of multi-detector row CT. Surgical and radiologic anatomy. 2009;31(2):85–91. doi: 10.1007/s00276-008-0404-8. [DOI] [PubMed] [Google Scholar]


