Abstract
Head angular velocity, instead of acceleration, is more predictive of brain strains. Surprisingly, no study exists that investigates how shape variation in angular velocity profiles affects brain strains, beyond characteristics such as peak magnitude and impulse duration. In this study, we evaluated brain strain uncertainty due to variation in angular velocity profiles, and further compared with that resulting from simplifying the profiles into idealized shapes. To do so, we used reconstructed head impacts from American National Football League for shape extraction, and simulated head uniaxial coronal rotations from onset to full stop. The velocity profiles were scaled to maintain an identical peak velocity magnitude and duration in order to isolate the shape for investigation. Element-wise peak maximum principal strains from 44 selected impacts were obtained. We found that the shape of angular velocity profile could significantly affect brain strain magnitude (e.g., percentage difference of 4.29–17.89% in the whole-brain relative to the group average, with cumulative strain damage measure (CSDM) uncertainty range of 23.9%) but not pattern (correlation coefficient of 0.94–0.99). Strain differences resulting from simplifying angular velocity profiles into idealized shapes were largely within the range due to shape variation, in both percentage difference and CSDM (signed difference of 3.91% on average, with a typical range of 0–6%). These findings provide important insight into the uncertainty or confidence in the performance of kinematics-based injury metrics. More importantly, they suggest the feasibility to simplify head angular velocity profiles into idealized shapes, at least within the confinements of the profiles evaluated, to enable real-time strain estimation via pre-computation in the future.
Keywords: Traumatic brain injury, head impact, head angular motion, brain strains, pre-computation
1. Introduction
Traumatic brain injury (TBI) from blunt head impact is a leading cause of morbidity and mortality in the USA (CDC 2013). The importance of head rotation on brain strains and the resulting diffuse axonal injury (DAI) is well-known (Holbourn 1943; King et al. 2003). Consequently, the use of peak angular acceleration magnitude to assess brain injury risk and severity is virtually ubiquitous. However, angular velocity, instead of acceleration, is more predictive of brain strains (Kleiven 2006; Weaver et al. 2012; Takhounts et al. 2013; Ji and Zhao 2015). This can be conceptually explained via a simple “dimensional analysis”: the rotation-induced brain strain energy is likely proportional to the rotational kinetic energy. As they are each proportional to the square of strain and angular velocity magnitudes, respectively, so is an approximate proportion between strain and angular velocity, themselves (Ji and Zhao 2015). Therefore, more recent kinematics-based injury metrics have explicitly incorporated peak magnitude of angular velocity instead of that of angular acceleration (e.g., Rotational Injury Criterion (RIC), Power Rotational Head Injury Criterion (PRHIC) (Kimpara and Iwamoto 2012) and Brain Injury Criterion (BrIC) (Takhounts et al. 2013)).
Still, these kinematics-based metrics, alone, do not directly inform regional brain strains that are thought to initiate injury (King et al. 2003). In parallel, therefore, there has been substantial efforts to develop sophisticated computational models of the human head in order to convert impact kinematics into estimates of regional brain mechanical responses (see (Yang et al. 2011) for a recent review). While evidence does suggest that model-estimated responses are more effective in injury prediction than kinematic metrics (Zhang et al. 2004; Giordano and Kleiven 2014), the substantial computational cost (runtime and hardware) is a practical barrier to deploying head computational models for real-world applications (Goriely et al. 2015).
To address this challenge, Ji and co-workers have recently developed a pre-computation technique to substantially increase the simulation efficiency without significant degradation in model estimation accuracy, for both strain (Ji and Zhao 2015; Zhao and Ji 2015) and pressure (Zhao and Ji 2016). Essentially, this strategy treats a head injury model as a mathematical mapping function between impact kinematics and brain responses. By precomputing a large “look-up table” or a response hypersurface, brain strains are obtained via efficient interpolation/extrapolation without a time-consuming direct simulation. However, this approach requires a substantial reduction in the dimensionality in head rotational kinematics to generate brain responses from simplified impulse profiles (Ji and Zhao 2015). Obviously, the utility of this technique for real-world application critically depends on the feasibility of simplifying the angular velocity/acceleration profiles into idealized shapes. This requires an investigation on how the shape of head angular velocity/acceleration profiles affects brain strains in the first place.
Very limited investigations exist along this line of research. Yoganandan et al. employed a simplified two-dimensional (2D) finite element (FE) model of the head to study the effect of idealized angular acceleration (as opposed to velocity) impulse shapes and acceleration-deceleration separation time in coronal rotations (Yoganandan et al. 2008). They found that peak magnitudes of regional average strains depended on both brain region and pulse shape in biphasic rotations, while they were similar in mono-phasic accelerations when the peak magnitude of angular velocity remained identical (albeit, slightly larger with a shorter impulse duration). In contrast, Post et al. found that the shape significantly influenced brain strains in mono-phasic accelerations with an identical peak magnitude of angular velocity (e.g., maximum principal strain ranged 0.088–0.119 in coronal rotation) when using peak strains from a single element with a 3D head model and more realistic acceleration profiles (Post et al. 2012).
The relative insensitivity of peak angular acceleration magnitude on strains was observed when simulating rotations using different angular acceleration shapes while maintaining an identical peak velocity magnitude and impulse duration (triangular, sine, or haversine, with peak velocity magnitude differing by as much as 21.5%; (Ji and Zhao 2015)). Similarly, by varying both angular acceleration and impulse duration while maintaining an identical peak velocity magnitude, nearly the same strain magnitude was obtained, as verified by two independent head models (Kleiven 2006; Zhao and Ji 2015). However, a longer impulse duration with an identical peak velocity magnitude in an acceleration-only rotation decreased strains (Kleiven 2006; Zhao and Ji 2015), likely due to the increase in strain energy dissipation resulting from the brain’s viscoelastic properties. Regardless, these findings confirm that both peak angular velocity magnitude and impulse duration are important to brain strains.
Surprisingly, however, no study seems to exist that investigates how the shape of angular velocity (vs. acceleration) profiles, beyond characteristics such as peak magnitude and impulse duration, affects brain strains. Therefore, we conducted this study to evaluate differences in angular velocity-induced brain strains as a result of shape variation in temporal profiles. In addition, we also simplified the angular velocity profiles into idealized, triangulated acceleration/deceleration impulses and evaluated the resulting strain differences. These investigations on the strain response uncertainty could provide an important confidence measure in assessing the effectiveness of kinematics-based injury metrics, as they do not account for angular velocity shape variation. Perhaps more importantly, the comparison between the uncertainties resulting from shape simplification vs. shape variation could provide critical insights into the usability of the pre-computation technique for real-world application. If this is feasible, conceivably, the pre-computation technique could then facilitate on-field impact sensors to better predict and diagnose concussion using instantaneous estimation of brain strains (vs. kinematic variables alone) in the future.
2. Methods
2.1 Angular velocity profiles
Temporally validated kinematic profiles from on-field sensors appear yet to be developed (Beckwith et al. 2012; Allison et al. 2014). Typical or representative shapes of head angular velocity profiles do not seem to exist either. Therefore, we used the 58 reconstructed American National Football League (NFL) head impacts (Newman et al. 2000) for shape extraction. These impacts consist of full 6 degrees-of-freedom (DOFs) linear and rotational acceleration profiles, and have been used in previous model-based studies for concussion prediction (Zhang et al. 2004; Viano et al. 2005; Kleiven 2007).
The direction of rotation is important to brain strains (Kleiven 2006; Weaver et al. 2012; Zhao and Ji 2015). Unfortunately, current impact sensor technology for head angular motion measurement largely only focuses on the accuracy of peak magnitude of resultant angular acceleration or velocity (Beckwith et al. 2012; Camarillo et al. 2013; Allison et al. 2014). It does not yet consider the accuracy of directionality or its variation during head rotation, impulse duration, deceleration that always occur in real-world head impacts, initial velocity upon head impact, among others, that could be important to brain strains as well.
Given the current state-of-the-art, therefore, here we focused on studying how the shape of head angular velocity profiles affects brain strains, using a fixed impulse duration along a fixed rotational axis. This was a critical gap of knowledge to fill in order to understand the significance of developing temporally validated head angular kinematic profiles. In addition, it also enabled assessing the feasibility of the pre-computation technique to aid on-field head impact sensor for concussion diagnosis in the future. Importantly, this was a much needed extension to previous parametric studies that have similarly employed uniaxial head rotations but only considered angular acceleration (vs. angular velocity that is more predictive of strains) without probing shape variation (Kleiven 2006; Yoganandan et al. 2008; Post et al. 2012; Weaver et al. 2012).
Specifically, we simulated uniaxial coronal head rotations (from left to right; brain responses would be symmetric relative to the mid-sagittal plane when rotating in the opposite, right-to-left, direction) using the Dartmouth Head Injury Model (DHIM). This particular direction of rotation is known to cause large strains in the corpus callosum (Kleiven 2006; Zhao and Ji 2015) – a region often used to predict concussion (Giordano and Kleiven 2014; Hernandez et al. 2014). Instead of simulating impacts with arbitrary angular velocity shapes, here we further constrained head rotations from onset to full stop (i.e., the selected coronal angular velocity ascending from, and descending to, zero velocity magnitude). This was important to allow a unique determination of the impulse duration, known to be important to brain strains (Zhao and Ji 2015). Next, the angular velocity profiles were scaled to maintain an identical peak velocity magnitude ( ) and impulse duration (Δt) so that to isolate their shapes for investigation. The choice of a full excursion velocity profile (i.e., from onset to full stop, or acceleration followed by deceleration; (Takhounts et al. 2013)) instead of mono-phasic acceleration-only (Post et al. 2012; Weaver et al. 2012) was because deceleration always occurs in real-world head impacts (head motion would become unbounded if otherwise, which is not physical).
The reconstructed NFL head accelerations were originally collected at 10 kHz following SAE J211 protocol. Their profiles were pre-processed according to CFC 1000 requirements (Newman et al. 2000). These angular acceleration profiles were further filtered using a CFC 180 low-pass filter to minimize the influence of spurious mechanical noise on the angular acceleration calculations, as previously adopted (Newman et al. 2000; Kleiven 2007). Additional filters produced negligible effect on the accuracy of the acceleration profiles, themselves (Newman et al. 2005), while inherent errors (maximum error of 25% for resultant angular acceleration (Newman et al. 2005)) may have large effect. However, it must be noted that these profile inaccuracies were not related to the response differences evaluated in the current study. This was because the reference responses used for comparison here were simulated from the given acceleration profiles, rather than from their unknown “ground-truths”.
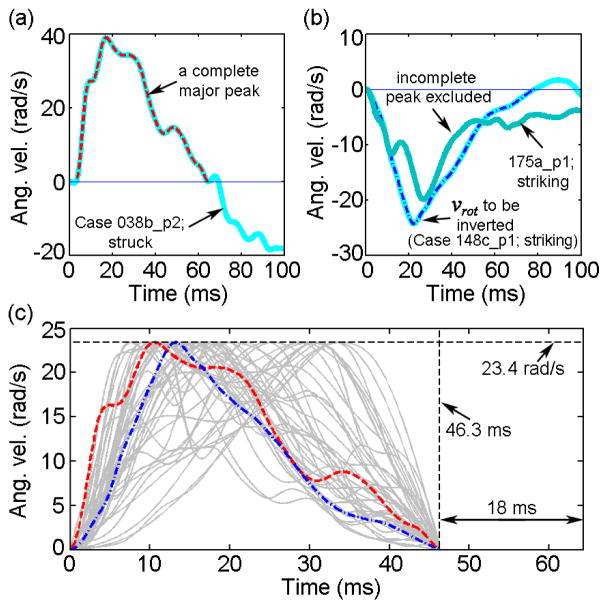
To simulate head coronal rotations, the x-components of the reconstructed angular acceleration profiles were numerically integrated (zero initial velocity or integration constant). The complete largest angular velocity peaks that captured coronal rotation from onset to full stop were identified (Fig. 1a and b). Profiles with negative velocity magnitudes were inverted to maintain a left-to-right rotation (i.e., to enforce a positive angular velocity; Fig. 1b). Profiles that did not record a full coronal stop were discarded to avoid challenges in uniquely determining the impulse duration (Fig. 1b). This led to 44 angular velocity profiles. They were further linearly scaled to maintain an identical peak velocity magnitude and duration, chosen to be their corresponding average values from all retained profiles (23.4 (±11.94) rad/s and 46.3 (±18.3) ms, respectively; Fig. 1c). For each angular velocity profile, an additional 18 ms of zero magnitude was appended to ensure capturing peak responses. The discontinuity resulting from the “sudden stop” was automatically smoothed (Abaqus 2016) to avoid unrealistic angular accelerations. Virtually for all of the simulated impacts, 99.5% of elements reached their peaks within the simulated time frame.
Fig. 1.
Illustration of angular velocity profile selection and scaling for impact simulation. The largest velocity peak capturing head rotation from onset to full stop in the coronal direction was first identified (a) and (b). Those not capturing a full stop (i.e., velocity not reaching zero) were discarded (b). The selected profiles were then scaled to maintain an identical peak angular velocity magnitude and impulse duration (c; those selected from (a) and (b) highlighted – major peaks were truncated and scaled to provide kinematic input for model simulations).
2.2 Angular velocity profile simplification
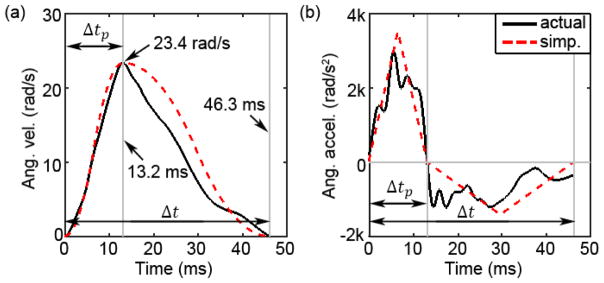
An important purpose of this study was to evaluate whether it was feasible to simplify head angular velocity/acceleration profiles into idealized shapes that can be uniquely determined via a few limited parameters (i.e., parameterization) without incurring substantial differences in brain strains. This was important to assess whether the pre-computation technique can be utilized in the future for real-time strain estimation for real-world head impacts. We chose to simplify the rotational kinematic profiles into idealized shapes by maintaining three parameters: peak angular velocity, the total impulse duration (Δt), as well as the time to reach the peak velocity (time-to-peak; Δtp). They were readily identified, as illustrated (Fig. 2). The velocity profile was first decomposed into an “acceleration” phase followed immediately by a “deceleration” phase with no separation time in between. Using peak angular velocity and Δtp , a triangulated acceleration impulse was then generated (Fig. 2b). Immediately following the acceleration, a triangulated deceleration impulse was similarly generated to maintain an identical duration for the combined acceleration/deceleration impulses. Integrating the acceleration/deceleration profiles (with a zero constant) easily produced the corresponding simplified angular velocity profile (Fig. 2a).
Fig. 2.
Illustration of how a typical angular velocity (a) or acceleration (b) profile is simplified into two triangulated acceleration/deceleration impulses uniquely determined by three independent parameters.
2.3 The Dartmouth Head Injury Model
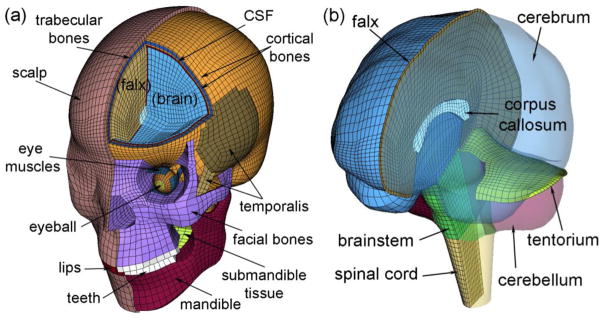
Details of the Dartmouth Head Injury Model (DHIM) description, material properties, and validation performances were reported previously (Ji et al. 2014b; Ji et al. 2015; Zhao et al. 2015). Briefly, the DHIM is a subject-specific head model composed of a total of 101.4 k nodes and 115.2 k elements with a combined mass of 4.562 kg for the whole head. The brain has a total of 56.6 k nodes and 55.1 k elements, with a combined mass of 1.558 kg. The average element sizes for the whole head and the brain are 3.2 ± 0.94 mm and 3.3 ± 0.79 mm, respectively. The brain is modeled with C3D8R hexahedral elements (Abaqus 2012) using a homogenous, second-order Ogden hyperviscoelastic material (Ogden 1984). The DHIM has successfully passed numerical convergence, mesh quality, and hourglass energy tests, as reported before (Ji et al. 2015; Zhao et al. 2016). In addition, the DHIM has been successfully validated against relative brain-skull displacement (Hardy et al. 2001; Hardy et al. 2007) and intracranial pressure responses (Nahum et al. 1977; Trosseille et al. 1992) from cadaveric experiments, as well as full-field strain responses in a live human volunteer (Sabet et al. 2008). The overall “good” to “excellent” validation at the low (~250–300 rad/s2 for the volunteer), mid (~1.9–2.3 krad/s2 for impact tests C755-T2 and C383-T1), and high (~11.9 krad/s2 for test C393-T4) peak magnitudes of angular accelerations provided important confidence of the accuracy of DHIM-estimated brain responses.
All brain responses were obtained from the DHIM via Abaqus/Explicit (Version 6.12; Dassault Systèmes, France; Intel Xeon X5560, 2.80 GHz, 126 GB memory, using 8 CPUs) with a temporal resolution of 1 ms. To simplify notation, we used ε to present element-wise peak maximum principal strains regardless of the time of occurrence.
3 Data analysis
To facilitate comparison, element-wise group average ε from the 44 simulated responses (ε̄) were computed to serve as reference. For each ε response, a volume-weighted average percentage difference (diff%) was defined to measure the magnitude difference relative to ε̄ :
| (Eqn. 1) |
where εi and are the ε and ε̄ values of the ith element (n elements in total), and Vi is its volume. Similarly, we evaluated pair-wise diff% between the 44 simulated ε responses, themselves, by computing the element-wise ε absolute differences between a given pair of impacts (total of 44×43/2! or 946 pairs). To evaluate the similarity in ε distribution or “pattern”, Pearson correlation coefficients between each ε and ε̄ as well as between pair-wise ε responses were computed. Analysis was conducted for the whole-brain as well as for three targeted regions including corpus callosum, midbrain, and the cortical region.
The response uncertainties due to shape variation in and simplification of angular velocity profiles were further assessed using a more familiar metric, cumulative strain damage measure (CSDM; (Takhounts et al. 2008)). The average and range of CSDM from the actual angular velocity profiles were computed for a range of strain thresholds. In addition, the signed differences in CSDM due to shape simplification of angular velocity profiles were also calculated. For illustration, responses most similar to, and most different from, ε̄, were identified. They were simplified into idealized angular acceleration/velocity profiles for illustration. Their strain responses were then compared to those directly simulated from the actual profiles.
To better understand the sources responsible for the observed differences in strain magnitude, we investigated the significance of time-to-peak values of the simplified angular velocity profiles, as they all had identical characteristics including the peak velocity magnitude and impulse duration. In addition, we studied the significance of variations between the pair of actual and simplified angular velocity profiles. This was conveniently carried out in the angular acceleration frequency domain, as the temporal differentiation readily captured any minute differences between the pair. Fourier series approximations were first obtained for the pair of angular acceleration profiles to compute their percent total power spectrum (PTPS). As the high-frequency content was effective in distinguishing profile shapes, the percentage of total power contributed by the frequency content beyond the dominant frequency was used to correlate with strain magnitude differences (Margulies and Thibault 1989).
Finally, to facilitate visualization, all responses were spatially resampled on a regular grid at a resolution of 2 mm to generate strain-encoded coronal images. All data analyses were performed in MATLAB (R2015a; Mathworks, Natick, MA).
4. Results
4.1 Group-wise strain response uncertainty
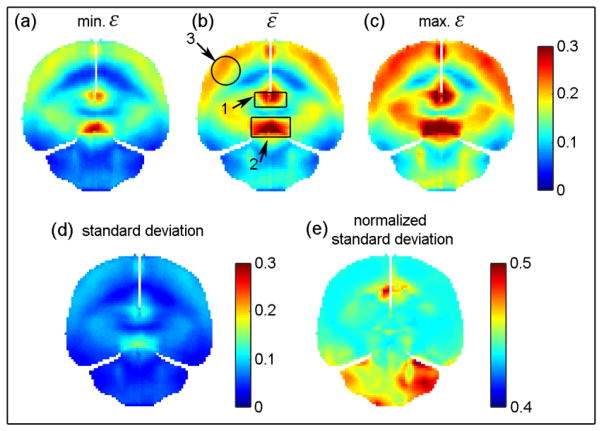
Fig. 4 illustrates the resampled pixel-wise minimum, average, and maximum ε along with the standard deviations of the simulated impacts using the actual angular velocity profiles. They were the “range of” and “representative” responses for the simulated group, but were not necessarily from a specific head impact. The pixel-wise differences between the maximum and minimum ε relative to ε̄ ranged 17.0–150.3% (average of 47.9±17.0%). The diff% and correlation coefficients between ε and ε̄ and between ε pairs are reported for the whole-brain and three selected regions: corpus callosum, midbrain, and cortical region (Table 1 and 2). These results represented the group-wise strain uncertainty due to shape variation in angular velocity profiles.
Fig. 4.
The minimum (a), average (b), and maximum (c) ε along with the standard deviation (d) (further normalized by the corresponding ε̄ (e)) on a representative resampled coronal plane. Note that these responses were not necessarily from a given specific head impact. Only regions corresponding to the brain parenchyma were resampled – other regions (e.g., falx and tentorium) appear as empty space. Three targeted regions were identified for further analysis. They were corpus callosum (1), midbrain (2), and cortical region (3; localized by a sphere of a radius of 15 mm). They had a size of 16.6 cc, 13.3 cc, and 13.8 cc, respectively.
Table 1.
Summary of diff% between ε andε̄, and between ε pairs from all simulated actual impacts, as well as between ε responses obtained from simplified (εsimp) and actual (εactual) angular velocity profiles.
| Diff% | |||
|---|---|---|---|
|
| |||
| Region of interest | Range | Average ± std. | |
| Whole brain | Between ε and ε̄ | 4.29–17.89 | 10.14±3.86 |
| Between εpairs | 2.19–34.81 | 14.14±6.18 | |
| Between εsimp and εactual | 1.70–23.14 | 9.87±5.88 | |
|
| |||
| Corpus callosum | Between ε and ε̄ | 2.72–19.89 | 7.40±4.18 |
| Between εpairs | 0.70–35.81 | 10.56±5.83 | |
| Between εsimp and εactual | 1.21–34.81 | 8.84±7.53 | |
|
| |||
| Midbrain | Between ε and ε̄ | 2.79–15.29 | 9.47±3.63 |
| Between εpairs | 1.02–28.02 | 13.20±5.62 | |
| Between εsimp and εactual | 2.00–27.58 | 10.09±7.00 | |
|
| |||
| Cortical region | Between ε and ε̄ | 1.53–16.30 | 6.69±4.28 |
| Between εpairs | 0.37–30.90 | 9.42±6.20 | |
| Between εsimp and εactual | 0.92–32.65 | 9.00±7.92 | |
Table 2.
Summary of Pearson correlation coefficients between ε and ε̄, and between ε pairs from all simulated actual impacts, as well as between εsimp and εactual (p<0.05 for all correlation coefficients).
| Correlation coefficient
| |||
|---|---|---|---|
| Region of interest | Range | Average ± std. | |
| Whole brain | Between ε and ε̄ | 0.94–0.99 | 0.98±0.01 |
| Between εpairs | 0.87–1.00 | 0.96±0.03 | |
| Between εsimp and εactual | 0.94–1.00 | 0.99±0.01 | |
|
| |||
| Corpus callosum | Between ε and ε̄ | 0.96–1.00 | 0.99±0.01 |
| Between εpairs | 0.91–1.00 | 0.97±0.02 | |
| Between εsimp and εactual | 0.93–1.00 | 0.99±0.01 | |
|
| |||
| Midbrain | Between ε and ε̄ | 0.82–0.99 | 0.95±0.04 |
| Between εpairs | 0.53–1.00 | 0.89±0.10 | |
| Between εsimp and εactual | 0.87–1.00 | 0.97±0.03 | |
|
| |||
| Cortical region | Between ε and ε̄ | 0.94–1.00 | 0.98±0.01 |
| Between εpairs | 0.86–1.00 | 0.97±0.03 | |
| Between εsimp and εactual | 0.94–1.00 | 0.99±0.01 | |
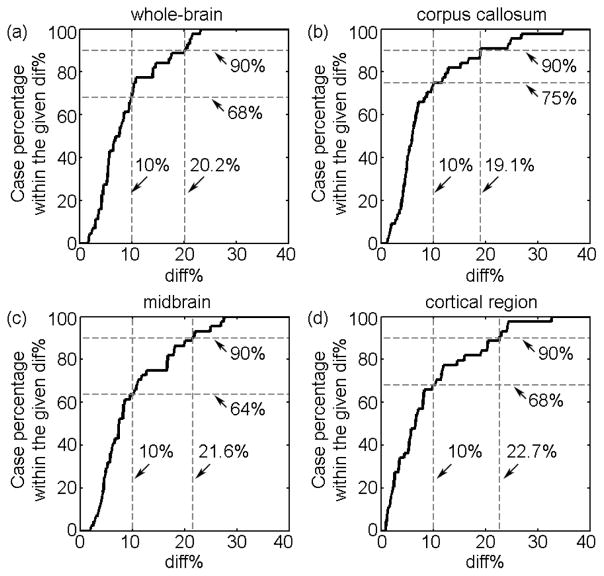
Similarly, the group-wise strain differences due to shape simplification in angular velocity profiles are also summarized (Table 1 and 2). For the majority of cases, the strain differences due to shape simplification were within those resulting from shape variation, especially when comparing against the uncertainty ranges between ε pairs (Table 3). To better evaluate the absolute magnitude of strain differences due to shape simplification, we plotted the percentage of impact cases that had a diff% within a given level, for a range of diff% thresholds (Fig. 5). Regardless of the region, 90% of the impact cases had a diff% within ~20%, while about 64–75% of the cases had a diff% within 10%, with the highest percentage in the corpus callosum.
Table 3.
Percentage and number (in parentheses) of cases out of the total of 44 selected impacts for which the diff% due to shape simplification of the angular velocity profiles were within that resulting from shape variation for the same head impact, as observed between and . The results are also provided against the response uncertainty range between pairs, for comparison.
| Whole-brain | Corpus callosum | Midbrain | Cortical region | |
|---|---|---|---|---|
| Between ε and ε̄ | 88.64% (39) | 93.18% (41) | 86.36% (38) | 81.82% (36) |
| Between ε pairs | 100% (44) | 100% (44) | 100% (44) | 97.73% (43) |
Fig. 5.
Percentage of cases whose diff% in strain resulting from simplified and actual angular velocity profiles as a function of diff% threshold, for the four selected regions. The percentages at a diff% level of 10% as well as the diff% values at a percentage level of 90% are shown.
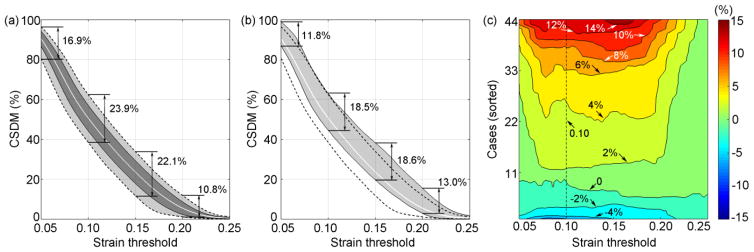
The CSDM uncertainty range due to shape variation in angular velocity profiles could reach up to 23.9% (Fig. 6a). The CSDM uncertainty magnitude due to shape simplification of angular velocity profiles were largely within those resulting from shape variation, except at high strain thresholds (e.g., 13.0% vs. 10.8% at a strain threshold of 0.2; Fig. 6b). To analyze the distribution of the CSDM signed differences due to shape simplification (i.e., CSDM from the simplified profile subtracted by that from the actual shape), their pair-wise values at every strain threshold were sorted. A contour plot was generated (Fig. 6c), which clearly indicated that for most of the cases, the signed differences were positive. This suggested that shape simplification of angular velocity profiles more frequently overestimated the CSDM relative to that generated from the actual angular velocity profiles. Therefore, an “upward shift” was observed for the signed CSDM difference range relative to the average CSDM obtained from simulating actual angular velocity profiles (Fig. 6b). The average overestimation was 3.91% with the majority of cases within 0–6% at a strain threshold of 0.1.
Fig. 6.
(a) The CSDM as a function of strain threshold, showing the average (curve), standard deviation (darker area), and range (lighter area). They were generated from the 44 simulated impacts using their actual angular velocity profiles as input. (b) The range of CSDM signed differences (shaded) between strains from simplified and actual angular velocity profiles. The average and range of CSDM in (a), shown as white and dashed curves, respectively, served as references for comparison. (c) Contour plot showing the magnitude of CSDM signed differences based on the 44 pairs of angular velocity profiles (simplified vs. actual).
4.2 Sources contributing to strain magnitude variation
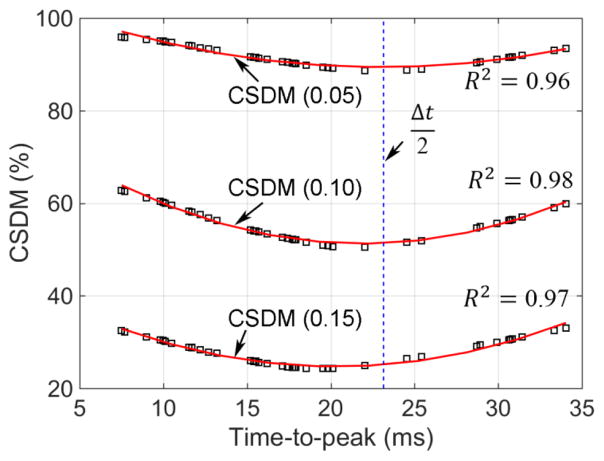
The CSDM and time-to-peak values (i.e., Δtp in Fig. 2) approximately followed a second-order polynomial relationship (R2 of 0.98, 0.97, and 0.97 for three selected strain thresholds, 0.05, 0.10, and 0.15, respectively; Fig. 7). The CSDM was the lowest when the time-to-peak was approximately near the center (e.g., the maximum and minimum CSDM differed by as much as 50.52% at a threshold of 0.10). Comparing strain responses from all of the simplified angular velocity profiles, we found the maximum diff% ranged from 17.10% (corpus callosum) to 21.17% (whole-brain), while the absolute difference in CSDM due to varying time-to-peak was 7.22%, 12.22%, and 8.76% at a strain threshold of 0.05, 0.1, and 0.15, respectively (Fig. 7).
Fig. 7.
CSDM for the whole-brain at three representative strain thresholds vs. time-to-peak values using the simplified angular velocity profiles, along with fitted curves based on second-order polynomial regressions.
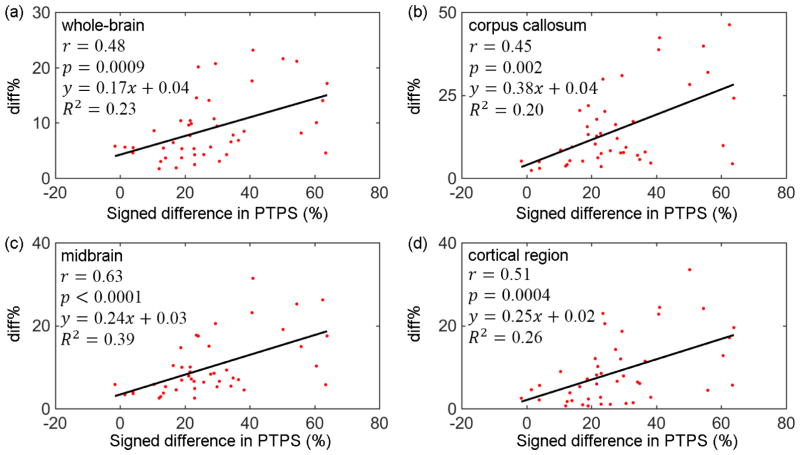
Significant, positive correlations existed for all regions between the strain magnitude diff% and the pair-wise differences in angular acceleration in terms of percent total power spectrum of the high frequency content (Fig. 8). This was consistent with findings from a previous analytical TBI study (Margulies and Thibault 1989).
Fig. 8.
Strain diff% between pair-wise simplified and actual angular velocity profiles vs. their signed differences in PTPS (percent total power spectrum) corresponding to the high frequency content in the angular acceleration domain. Pearson correlation coefficient (r) and coefficient of determination (R2) ranged from 0.45–0.63 and 0.20–0.39, respectively (p<0.05). (a) whole-brain; (b) corpus callosum; (c) midbrain; (d) cortical region.
4.3 Strain response uncertainty in selected cases
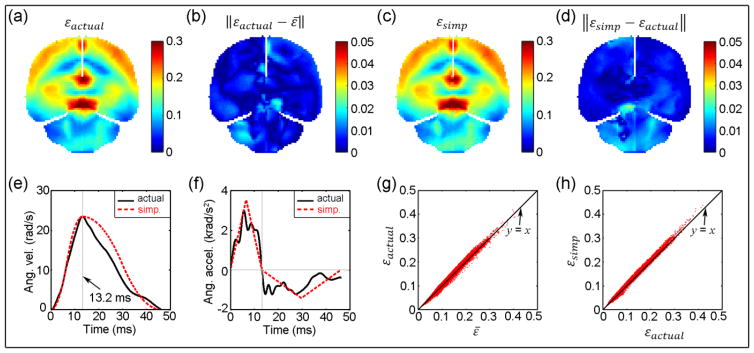
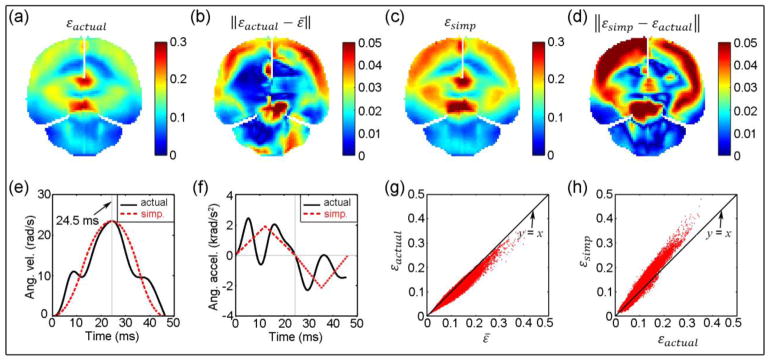
Two representative impacts were identified for further analysis. Their strains from the actual angular velocity profiles were most similar to, and most different from, ε̄, according to the diff% metric (Figs. 9 and 10). They represented a typical and an extreme case for strain response comparison. Strain maps from their simplified angular velocity profiles were also generated. For each selected case, the diff% and correlation coefficients due to angular velocity profile shape simplification are reported (Table 4).
Fig. 9.
Comparisons between strains resulting from actual (εactual) and simplified (εsimp) angular velocity profiles. (a): εactual with the smallest diff% relative toε̄; (b): absolute difference between εactual andε̄; (c): εsimp; (d): absolute difference between εsimp and εactual; (e) and (f): actual and simplified angular velocity and acceleration profiles, respectively; (g) and (h): comparison between element-wise εactual and ε̄, and between εsimp and εactual , respectively.
Fig. 10.
Similar comparisons for the case with the largest diff% relative to ε̄. Figure caption identical to that in Fig. 9.
Table 4.
Summary of diff% and correlation coefficients between ε responses due to shape simplification of angular velocity profiles for the two selected head impacts (p<0.05 for all correlation coefficients).
| Smallest diff% (Most similar to ε̄) | Largest diff% (Most different from ε̄) | ||
|---|---|---|---|
| Whole- brain | diff% corr. coef. |
5.43 1.00 |
21.60 0.97 |
| Corpus callosum | diff% corr. coef. |
4.53 0.99 |
16.79 0.99 |
| Midbrain | diff% corr. coef. |
4.35 0.99 |
21.92 0.97 |
| Cortical region | diff% corr. coef. |
3.50 1.00 |
32.65 0.99 |
5. Discussion
Developing a computationally efficient, yet sophisticated head injury model with high predictive power remains a major challenge (Goriely et al. 2015). For this reason, numerous empirically-derived, kinematics-based injury metrics have been developed as a convenient shortcut in an attempt to inform brain strains for injury risk and severity assessment. However, they do not account for variation in impact profile “shapes”, among others, that would inevitably cause uncertainty in the resulting strain and strain-induced injury risk. While a pre-computation technique can substantially improve the computational efficiency in estimating brain strains, it comes at the cost of simplifying head rotational kinematics into idealized profiles. Therefore, it is important to assess strain response uncertainty resulting from variation in and simplification of head angular motion, especially in terms of angular velocity.
5.1 Shape variation and simplification on strain magnitude uncertainty
By maintaining an identical peak magnitude of angular velocity and impulse duration to simulate head uniaxial rotations based on the reconstructed NFL impacts, we found that shape variation in angular velocity profiles could considerably influence brain strain magnitude. For example, the maximum difference in individual elements could reach 150.3% relative to the “average” or “typical” response, ε̄(Fig. 4). The regional average diff% could reach ~20% relative to ε̄in corpus callosum, and it could be even larger when comparing responses between ε pairs (e.g., more than 35% in corpus callosum; Table 1). On average, however, the strain magnitude uncertainty in terms of diff% was between ~7–10% relative to ε̄ for all of the simulated head impacts, regardless of brain region evaluated. In terms of CSDM, the uncertainty could reach more than 20% (Fig. 6) at strain thresholds of 0.1–0.15, which were often employed to assess injury (Kleiven 2007; Takhounts et al. 2008).
The strain magnitude uncertainty due to shape simplification of angular velocity profiles was found to be within that resulting from shape variation when comparing between ε pairs, virtually for all of the impacts and brain regions evaluated (except for one case in the cortical region; Table 1 and 3). In terms of average diff% values, they were all below those found between ε pairs, and were comparable to those between ε and ε̄ (Table 1). For the majority of impact cases (>80%), the diff% due to shape simplification was within that resulting from shape variation for the same angular velocity profile (i.e., between ε and ε̄), for all of the regions (Table 3). In terms of absolute magnitude of strain differences, 90% of the impact cases had a diff% within ~20% due to shape simplification, regardless of the region (Fig. 5). In comparison, about 64–75% of the cases had a diff% within 10%, with the highest percentage occurred in the corpus callosum. In terms of CSDM, the uncertainty range due to shape simplification was also within that resulting from shape variation for the majority of strain thresholds (Fig. 6). Shape simplification typically overestimated CSDM by 3.91% on average, and it was within a range of 0–6% for most of the cases at a stain threshold of 0.1 (Fig. 6c).
Collectively, these findings suggest that simplifying head angular velocity profiles is not likely to exacerbate the strain response uncertainty resulting from shape variation, itself. Therefore, at the minimum, using brain responses from the simplified (vs. actual) impact is not likely to degrade injury prediction performance relative to kinematics-based injury metrics. The latter of which do not account for variation in angular velocity profile shapes or the resulting uncertainty in brain strains. This is important, as it supports the feasibility for real-time strain estimation via pre-computation, which requires a substantial reduction in the dimensionality of input kinematics (Ji and Zhao 2015; Zhao and Ji 2015).
These observations were based on one set of fixed values of peak magnitude of angular velocity and impulse duration. However, we expect similar findings to follow with other sets of values, because similar results were obtained when we scaled the peak magnitude and impulse duration of the angular velocity profiles by either half (11.7 rad/s and 23.2 ms) or twice (46.8 rad/s and 92.6 ms), respectively (results not shown). The range of scaled values was sufficient to represent most of the mild to medium concussive head impacts in real-world (Fernandes and Sousa 2015). A set of regularly sampled values could then be used to establish a pre-computed strain response atlas, analogously to our previous effort using the largest angular acceleration peak (albeit, simplification was still similarly based on angular velocity to maintain its peak magnitude (Ji and Zhao 2015)).
5.2 Sources contributing to strain magnitude variation
Two independent sources could be considered as responsible for the observed strain magnitude variation. Among the simplified angular velocity profiles themselves, the time-to-peak value was an important factor. To maintain a fixed total impulse duration, an increase or decrease in time-to-peak or the acceleration phase would result in a reciprocal decrease or increase in the deceleration phase. The strong relationship between CSDM and the time-to-peak (Fig. 7) clearly indicated that the strain was the lowest when the acceleration and deceleration were approximately of equal temporal duration and acceleration magnitude.
Beyond the time-to-peak characteristics, another important factor was the differences between the pair of actual and simplified angular velocity profiles. This was conveniently characterized by their differences in angular acceleration profiles in the frequency domain. The larger the differences between the pair of angular acceleration profiles in terms of their percent total power corresponding to the high frequency content, the larger the difference in strain magnitude (Fig. 8), as expected and similarly observed before (Margulies and Thibault 1989). The resulting correlation coefficients were not particularly high (range 0.45–0.63), suggesting that additional investigations are necessary to better correlate strain variation with that in angular velocity/acceleration profiles (e.g., multiple “features” from the profiles vs. a single variable, PTPS for correlation; non-linear regression vs. simple linear correlation, etc.). Scrutinizing strain response “history” (vs. “cumulative” or peak responses in this study) may be necessary.
Nevertheless, understanding the causal relationships between angular velocity/acceleration profile and strain responses may have some important implications. Conceivably, an atlas of strain responses could be established using baseline, simplified angular velocity profiles where the acceleration and deceleration were of equal magnitude and duration. For a real-world angular velocity profile, strain responses could be first estimated based on the pre-computed atlas, with additional response compensations to account for the difference in time-to-peak and variation in angular velocity/acceleration profiles. Potentially, this compensation strategy may lead to an improved accuracy in strain estimation.
5.3 Shape variation and simplification on strain pattern uncertainty
Interestingly, the strain pattern or distribution of high/low strain exposures remained largely unchanged, regardless of whether actual or simplified angular velocity profiles were employed. The correlation coefficients of strain responses from the actual angular velocity profiles relative to the typical responses, ε̄, were nearly 1.0 on average. Even when considering responses between ε pairs, the correlation coefficients were still close to 1.0 (slightly lower for the midbrain, 0.89 on average; Table 2). For shape simplification of angular velocity profiles, all pairs of εsimp and εactual responses had a correlation coefficient of nearly 1.0 (again, slightly lower for the midbrain; Table 2). The same strain pattern was obtained (correlation coefficients of 0.89–0.99) even when scaling the angular velocity peak magnitude and duration to half or twice of the baseline values.
These findings suggest that brain strain response pattern was not sensitive to shape variation in or simplification of head angular velocity profiles. As illustrated in the element-wise strain distributions showing the response extrema and average values (Fig. 4), or in the two selected impact cases (Figs. 9 and 10), large strains consistently occurred in the corpus callosum, midbrain, and cortical areas. Certainly, the high strain regions would depend on the direction of rotation, which was fixed in this study. However, the more vulnerable regions along different directions can be easily localized via pre-computation (Ji and Zhao 2015). Potentially, this may allow utilizing more vulnerable, high strain regions for injury risk assessment. It awaits further investigation whether using responses in the more targeted brain regions could improve the performance of injury prediction over those based on the whole-brain (e.g., using CSDM (Takhounts et al. 2008) or its variant, BrIC (Takhounts et al. 2013)).
5.4 Characteristic response and illustration in selected cases
To facilitate comparison, an element-wise “average” response or ε̄ was generated, which may serve as the characteristic brain response of the simulated head impacts. A “typical” head angular velocity profile does not appear to exist, despite a few reports of typical head angular acceleration profiles obtained from principal component analysis (Ji et al. 2014a) or direct instrument measurement (Rowson and Duma 2011; Camarillo et al. 2013). Using the characteristic response, a head impact that generates brain responses most similar to the group average may be employed to represent the typical head impact. This response-guided, inverse technique may provide a useful, standardized approach to identify and characterize typical head impacts for more representative analysis. Based on all of the head angular velocity profiles simulated in this study, the one that led to strain responses most similar to ε̄ in terms of diff% is shown in Fig. 9a. This “typical” head angular velocity profile had a relatively shorter duration in “acceleration” than that in “deceleration” (13.2 vs. 33.1 ms), which was notably different from the idealized bi-phasic angular velocity profile employed to develop BrIC (equal magnitude and duration in acceleration and deceleration, with a total impulse duration of 25 ms (Takhounts et al. 2013), vs. 43.6 ms in this study).
Regardless, the ε responses from the two selected angular velocity profiles differed considerably in strain magnitude (diff% of 17.94%, 7.71%, 14.76%, and 15.30% between the ε pairs in the whole-brain, corpus callosum, midbrain, and cortical region, respectively, with CSDM of 53.02% and 39.81%, respectively, at a strain threshold of 0.1; Fig. 9a and Fig. 10a). However, their strain distributions were largely similar (correlation coefficient of 0.95, with p<0.001). The two angular velocity profiles also differed considerably in time-to-peak values (13.2 ms vs. 24.5 ms) as well as in the actual shape (relatively “smooth” with a single peak in velocity, vs. with an additional peak in acceleration phase and curve inflection in deceleration). On the other hand, it was obvious that a larger variation in angular velocity profile led to a large difference between εactual and εsimp (of an identical time-to-peak value) for the case in Fig. 10.
Finally, despite similarities between the actual and simplified angular velocity profiles for the case with ε most similar to ε̄ (correlation coefficient of 0.98 between the two profiles; Fig. 9e), their corresponding acceleration profiles could differ considerably in shape (correlation coefficient degraded to 0.93) and magnitude (peak magnitudes of angular accelerations of 3515 and 3962 rad/s2 for the two profiles, respectively; Fig. 9f). These findings, once again, suggest that angular velocity, instead of acceleration, be more relevant to brain strains.
5.5 Limitations and further thoughts
We have purposefully chosen to simulate uniaxial head rotations from onset to full stop, even though the reconstructed NFL kinematics comprise full DOFs head motion. The uniaxial head rotations did not account for potential changes in rotational directionality during impact. The truncated angular velocity profiles may not capture the entire head impact kinematics, and they did not consider any potential non-zero initial angular velocity that could be important to brain strains as well. In addition, the pulse-shaped angular velocity profiles, as previously adopted (Takhounts et al. 2013), may not capture all of the real-world head impacts (indeed, 16 out of 58 impacts were discarded because they did not cross zero velocity). However, it must be recognized that the current state-of-the-art on-field head impact sensor technology only focuses on the accuracy of resultant angular acceleration or velocity peak magnitude. It does not yet consider the temporal accuracy of head angular motion (Beckwith et al. 2012; Allison et al. 2014). Thus, the constrained head rotations simulated here, albeit somewhat limited, were a calculated, deliberate trade-off between laboratory-reconstructed arbitrary head motion and the sensor ability for accurate impact measurement on the field. Certainly, further investigation is necessary to assess strain uncertainty using unconstrained head angular motion. Regardless, our investigation here appeared to be a timely effort to better understand the significance of angular velocity profile shape variation on strain uncertainty, which may offer important insight into the development of temporally validated head angular motion profiles in the future.
Further, our study focusing on angular velocity (vs. acceleration) profile shapes was also a significant extension to previous studies (similarly considering uniaxial rotations) using idealized angular acceleration profiles and a 2D head model (Yoganandan et al. 2008), or realistic acceleration profiles but without deceleration which always occurs in real-world (Post et al. 2012). This was because head angular velocity is more predictive of brain strains, and is consequently considered the main mechanisms for mTBI (Takhounts et al. 2013). In addition, analyzing full-field brain responses as opposed to a sparse few elements (Yoganandan et al. 2008) or peak magnitude of a single element (Post et al. 2012) was also a notable advance.
Nevertheless, we have only evaluated uncertainty in strain but not in strain rate or the combination of strain and strain rate that could be important to the risk of brain injury (King et al. 2003). Additional investigations are necessary to characterize these rate-dependent response behaviors. In addition, errors from the reconstructed NFL head angular velocity profiles, themselves (Newman et al. 2005), were not considered in this study. However, this was not necessarily a limitation here, because our baseline reference responses were derived from the given angular velocity profiles, rather than from their unknown “ground-truths”. By isolating strain differences/errors due to shape variation in (and simplification of) angular velocity profiles from those resulting from actual sensor measurement, this allowed more targeted investigations of the different sources of error as well as their individual contributions to strain and injury risk uncertainties.
Indeed, an important design feature of the pre-computation strategy based on idealized angular velocity profiles is that the accuracy of the pre-computed brain strains depends on the head injury model only. If strain errors due to the difference in angular velocity profiles (idealized vs. actual) can be systematically probed and quantified (e.g., see Figs. 7 and 8), potentially, brain strains can then be easily compensated for. This may lead to an improved accuracy in brain strain estimation (Ji and Zhao 2015; Zhao and Ji 2015), thereby further supporting the potential utility of the pre-computation technique for real-world application.
Finally, it remains to be explored whether a pre-computed response atlas established from simplified angular velocity profiles can yield CSDM or average strains with an even higher correlation with respect to the directly simulated from actual profiles than kinematics-based metrics (Gabler et al. 2016). If feasible, the precomputed atlas may have the potential to facilitate the development of a tissue response-based injury metric in the future.
6. Conclusion
We found that the shape of head angular velocity profiles could significantly affect brain strain magnitude but not pattern or strain distribution, under uniaxial head rotations with identical peak velocity magnitude and duration. Strain uncertainty due to shape simplification of angular velocity profiles was found to be largely within that resulting from shape variation in actual angular velocity profiles. These findings provide important insight into: 1) the uncertainty or confidence in kinematics-based injury metrics; 2) the potential to use strains in targeted, more vulnerable brain regions (vs. whole-brain) for assessment of injury risk and severity; 3) a response-guided inverse approach to identify “typical” head impact kinematic profiles; and finally, 4) the feasibility to simplify head angular kinematics into idealized profiles, which is important to enable real-time strain estimation via pre-computation or to devise a tissue response-based injury metric in the future.
Fig. 3.
The DHIM showing color-coded head exterior (a) and intracranial components (b), which also includes part of the spinal cord to improve model biofidelity in the inferior region. The x-, y- and z-axis of the model coordinate system corresponds to the posterior-anterior, right-left, and inferior-superior direction, respectively.
Acknowledgments
Funding is provided by the NIH grants R01 NS092853 and R21 NS088781. The authors are grateful to The National Football League (NFL) Committee on Mild Traumatic Brain Injury (MTBI) and Biokinetics and Associates Ltd. for providing the reconstructed head impact kinematics data. In addition, the authors thank Dr. Richard M. Greenwald and Mr. Jonathan Beckwith at Simbex, LLC, for their help.
Footnotes
Conflict of interest
We have no competing interests.
References
- Abaqus. Abaqus 2016. 2016. Abaqus Online Documentation. [Google Scholar]
- Allison Ma, Kang YS, Bolte JH, et al. Validation of a helmet-based system to measure head impact biomechanics in ice hockey. Med Sci Sports Exerc. 2014;46:115–23. doi: 10.1249/MSS.0b013e3182a32d0d. [DOI] [PubMed] [Google Scholar]
- Beckwith JG, Greenwald RM, Chu JJ. Measuring head kinematics in football: correlation between the head impact telemetry system and Hybrid III headform. Ann Biomed Eng. 2012;40:237–48. doi: 10.1007/s10439-011-0422-2. [DOI] [PMC free article] [PubMed] [Google Scholar]
- Camarillo DB, Shull PB, Mattson J, et al. An instrumented mouthguard for measuring linear and angular head impact kinematics in American football. Ann Biomed Eng. 2013;41:1939–49. doi: 10.1007/s10439-013-0801-y. [DOI] [PMC free article] [PubMed] [Google Scholar]
- CDC. Report to Congress on Traumatic Brain Injury in the United States : Understanding the Public Health Problem among Current and Former Military Personnel 2013 [Google Scholar]
- Fernandes Fa, Sousa RJaD. Head injury predictors in sports trauma - A state-of-the-art review. Proc Inst Mech Eng Part H J Eng Med. 2015;229:592–608. doi: 10.1177/0954411915592906. [DOI] [PubMed] [Google Scholar]
- Gabler LF, Crandall JR, Panzer MB. Assessment of Kinematic Brain Injury Metrics for Predicting Strain Responses in Diverse Automotive Impact Conditions. Ann Biomed Eng. 2016 doi: 10.1007/s10439-016-1697-0. [DOI] [PubMed] [Google Scholar]
- Giordano C, Kleiven S. Evaluation of Axonal Strain as a Predictor for Mild Traumatic Brain Injuries Using Finite Element Modeling. 2014 doi: 10.4271/2014-22-0002. [DOI] [PubMed] [Google Scholar]
- Goriely A, Geers MGD, Holzapfel GA, et al. Mechanics of the brain: perspectives , challenges , and opportunities. Biomech Model Mechanobiol. 2015 doi: 10.1007/s10237-015-0662-4. [DOI] [PMC free article] [PubMed] [Google Scholar]
- Hardy WN, Foster CD, Mason MJ, et al. Investigation of Head Injury Mechanisms Using Neutral Density Technology and High-Speed Biplanar X-ray. Stapp Car Crash J. 2001;45:337–68. doi: 10.4271/2001-22-0016. [DOI] [PubMed] [Google Scholar]
- Hardy WN, Mason MJ, Foster CD, et al. A Study of the Response of the Human Cadaver Head to Impact. Stapp Car Crash J. 2007;51:17–80. doi: 10.4271/2007-22-0002. [DOI] [PMC free article] [PubMed] [Google Scholar]
- Hernandez F, Wu LC, Yip MC, et al. Six Degree of Freedom Measurements of Human Mild Traumatic Brain Injury. Ann Biomed Eng. 2014 doi: 10.1007/s10439-014-1212-4. [DOI] [PMC free article] [PubMed] [Google Scholar]
- Holbourn A. The mechanics of brain injuries. Lancet. 1943;2:438–441. [Google Scholar]
- Ji S, Ghadyani H, Bolander RP, et al. Parametric Comparisons of Intracranial Mechanical Responses from Three Validated Finite Element Models of the Human Head. Ann Biomed Eng. 2014a;42:11–24. doi: 10.1007/s10439-013-0907-2. [DOI] [PMC free article] [PubMed] [Google Scholar]
- Ji S, Zhao W. A pre-computed brain response atlas for instantaneous strain estimation in contact sports. Ann Biomed Eng. 2015;43:1877–1895. doi: 10.1007/s10439-014-1193-3. [DOI] [PMC free article] [PubMed] [Google Scholar]
- Ji S, Zhao W, Ford JC, et al. Group-wise evaluation and comparison of white matter fiber strain and maximum principal strain in sports-related concussion. J Neurotrauma. 2015;32:441–454. doi: 10.1089/neu.2013.3268. [DOI] [PMC free article] [PubMed] [Google Scholar]
- Ji S, Zhao W, Li Z, McAllister TW. Head impact accelerations for brain strain-related responses in contact sports: a model-based investigation. Biomech Model Mechanobiol. 2014b;13:1121–36. doi: 10.1007/s10237-014-0562-z. [DOI] [PMC free article] [PubMed] [Google Scholar]
- Kimpara H, Iwamoto M. Mild traumatic brain injury predictors based on angular accelerations during impacts. Ann Biomed Eng. 2012;40:114–26. doi: 10.1007/s10439-011-0414-2. [DOI] [PubMed] [Google Scholar]
- King AI, Yang KH, Zhang L, et al. Is head injury caused by linear or angular acceleration?. IRCOBI Conference; Lisbon, Portugal. 2003. pp. 1–12. [Google Scholar]
- Kleiven S. Evaluation of head injury criteria using a finite element model validated against experiments on localized brain motion, intracerebral acceleration, and intracranial pressure. Int J Crashworthiness. 2006;11:65–79. doi: 10.1533/ijcr.2005.0384. [DOI] [Google Scholar]
- Kleiven S. Predictors for Traumatic Brain Injuries Evaluated through Accident Reconstructions. Stapp Car Crash J. 2007;51:81–114. doi: 10.4271/2007-22-0003. [DOI] [PubMed] [Google Scholar]
- Margulies SS, Thibault LE. An analytical model of traumatic diffuse brain injury. J Biomech Eng. 1989;111:241–9. doi: 10.1115/1.3168373. [DOI] [PubMed] [Google Scholar]
- Nahum A, Smith R, Ward C. SAE Tech Pap No. 770922. 1977. Intracranial pressure dynamics during head impact. [Google Scholar]
- Newman J, Shewchenko N, Welbourne E. A proposed new biomechanical head injury assessment function-the maximum power index. Stapp Car Crash J. 2000;44:215–247. doi: 10.4271/2000-01-SC16. [DOI] [PubMed] [Google Scholar]
- Newman JA, Beusenberg MC, Shewchenko N, et al. Verification of biomechanical methods employed in a comprehensive study of mild traumatic brain injury and the effectiveness of American football helmets. J Biomech. 2005;38:1469–81. doi: 10.1016/j.jbiomech.2004.06.025. [DOI] [PubMed] [Google Scholar]
- Ogden RW. Non-linear elastic deformations. Dover Publications, Inc; Mineola, New York, NY, USA: 1984. [Google Scholar]
- Post A, Hoshizaki B, Gilchrist MD. Finite element analysis of the effect of loading curve shape on brain injury predictors. J Biomech. 2012;45:679–83. doi: 10.1016/j.jbiomech.2011.12.005. [DOI] [PubMed] [Google Scholar]
- Rowson S, Duma SM. Development of the STAR evaluation system for football helmets: integrating player head impact exposure and risk of concussion. Ann Biomed Eng. 2011;39:2130–40. doi: 10.1007/s10439-011-0322-5. [DOI] [PubMed] [Google Scholar]
- Sabet AA, Christoforou E, Zatlin B, et al. Deformation of the human brain induced by mild angular head acceleration. J Biomech. 2008;41:307–315. doi: 10.1016/j.jbiomech.2007.09.016. [DOI] [PMC free article] [PubMed] [Google Scholar]
- Takhounts EG, Craig MJ, Moorhouse K, et al. Development of Brain Injury Criteria (BrIC) Stapp Car Crash J. 2013;57:243–66. doi: 10.4271/2013-22-0010. [DOI] [PubMed] [Google Scholar]
- Takhounts EG, Ridella SA, Tannous RE, et al. Investigation of Traumatic Brain Injuries Using the Next Generation of Simulated Injury Monitor (SIMon) Finite Element Head Model. 2008;52:1–31. doi: 10.4271/2008-22-0001. [DOI] [PubMed] [Google Scholar]
- Trosseille X, Tarriere C, Lavaste F, et al. Development of a FEM of the human head according to a specific test protocol. Proceedings of 46th Stapp Car Conference; 1992. pp. 235–253. [Google Scholar]
- Viano DC, Casson IR, Pellman EJ, et al. Concussion in professional football: Brain responses by finite element analysis – Part 9. 2005 doi: 10.1227/01.NEU.0000186950.54075.3B. [DOI] [PubMed] [Google Scholar]
- Weaver AA, Danelson KA, Stitzel JD. Modeling brain injury response for rotational velocities of varying directions and magnitudes. Ann Biomed Eng. 2012;40:2005–18. doi: 10.1007/s10439-012-0553-0. [DOI] [PubMed] [Google Scholar]
- Yang K, Mao H, Wagner C, et al. Studies in Mechanobiology, Tissue Engineering and Biomaterials. Springer-Verlag; Berlin Heidelberg: 2011. Modeling of the Brain for Injury Prevention; pp. 69–120. [Google Scholar]
- Yoganandan N, Li J, Zhang J, et al. Influence of angular acceleration-deceleration pulse shapes on regional brain strains. J Biomech. 2008;41:2253–62. doi: 10.1016/j.jbiomech.2008.04.019. [DOI] [PubMed] [Google Scholar]
- Zhang L, Yang KH, King AI. A Proposed Injury Threshold for Mild Traumatic Brain Injury. J Biomech Eng. 2004 doi: 10.1115/1.1691446. [DOI] [PubMed] [Google Scholar]
- Zhao W, Ford JC, Flashman LA, et al. White Matter Injury Susceptibility via Fiber Strain Evaluation using Whole-Brain Tractography. J Neurotrauma. 2016;33 doi: 10.1089/neu.2015.4239. in press. [DOI] [PMC free article] [PubMed] [Google Scholar]
- Zhao W, Ji S. Parametric investigation of regional brain strain responses via a pre-computed atlas. IRCOBI Conference; Lyon, France. 2015. pp. 208–220. [Google Scholar]
- Zhao W, Ji S. Real-time, whole-brain, temporally resolved pressure responses in translational head impact. Interface Focus. 2016;6:20150091. doi: 10.1098/rsfs.2015.0091. [DOI] [PMC free article] [PubMed] [Google Scholar]
- Zhao W, Ruan S, Ji S. Brain pressure responses in translational head impact: a dimensional analysis and a further computational study. Biomech Model Mechanobiol. 2015;14:753–766. doi: 10.1007/s10237-014-0634-0. [DOI] [PMC free article] [PubMed] [Google Scholar]


