Abstract
Tropomyosin is a component of thin filaments that constitute myofibrils, the contractile apparatus of striated muscles. In vertebrates, except for fish, four TPM genes TPM1, TPM2, TPM3, and TPM4 are known. In zebrafish, there are six TPM genes that include the paralogs of the TPM1 (TPM1-1 & TPM1-2), the paralogs of the TPM4 gene (TPM4-1 & TPM4-2), and the two single copy genes TPM2 and TPM3. In this study, we have identified, cloned, and sequenced the TPM1-1κ isoform of the TPM1-1 gene and also discovered a new isoform TPM1-2ν of the TPM1-2. Further, we have cloned and sequenced the sarcomeric isoform of the TPM4-2 gene designated as TPM4-2α. Using conventional RT-PCR, we have shown the expression of the sarcomeric isoforms of TPM1-1, TPM1-2, TPM2, TPM3, TPM4-1, and TPM4-2 in heart and skeletal muscles. By qRT-PCR using both relative expression as well as the absolute copy number, we have shown that TPM1-1α, TPM1-2α, and TPM1-2ν are expressed mostly in skeletal muscle; the level of expression of TPM1-1κ is significantly lower compared to TPM1-1α in skeletal muscle. In addition, both TPM4-1α and TPM4-2α are predominantly expressed in heart. 2D Western blot analyses using anti-TPM antibody followed by Mass Spectrometry of the proteins from the antibody-stained spots show that TPM1-1α and TPM3α are expressed in skeletal muscle whereas TPM4-1α and TPM3α are expressed in zebrafish heart. To the best of our knowledge, this is by far the most comprehensive analysis of tropomyosin expression in zebrafish, one of the most popular animal models for gene expression study.
INTRODUCTION
Tropomyosins, a family of highly related actin-binding proteins, are present in cells of various organisms ranging from yeast to humans. In vertebrates, it has been known for some time that tropomyosins are encoded by four different genes, designated as TPM1, TPM2, TPM3, and TPM4. Each of the four TPM genes can form a multitude of isoforms via alternate splicing and/or using an alternate promoter [Gunning et al. 2008; Lees-Miller and Helfman, 1991; Schevzov et al. 2011]. However, in the last ten years, our knowledge about the tropomyosin gene number and structure in various organisms has been changed significantly. Unlike in avian [Fleenor et al., 1992], amphibian [Hardy et al., 1995; Thomas et al., 2010] or mammalian systems [Pieples and Wieczorek, 2000; Perry 2001], there are six TPM genes in fish. This was first reported in Fugu fish [Ikeda et al., 2003; Toramoto et al., 2004] followed by Zebrafish (Danio rerio) [Schevzov et al. 2011]. The fish tropomyosin genes are designated as TPM1-1, TPM1-2, TPM2, TPM3, TPM4-1, and TPM4-2. Of the six, TPM1-1 & TPM1-2 as well as TPM4-1 & TPM4-2 are duplicated paralogs. In fish, TPM2 and TPM3 are single copy genes equivalent to mammalian TPM2 and TPM3, respectively. The organization of TPM1-1 gene is highly conserved in vertebrates with exons 1a, 2a, 1b, 3, 4, 5, 6a, 6b, 7, 8, 9a, 9b, 9c, 9d, whereas the duplicated paralog TPM1-2 does not have exon 2a and 6a. Fish TPM2, unlike its other vertebrate counterparts, does not have exon 6a whereas fish TPM3 differs from other vertebrates by not having a second promoter nor exon 6a. The exon compositions in the duplicated paralog of TPM4 are very similar to the TPM4 gene in amphibians, avian, and humans.
Toramoto et al [2004] reported the TPM gene organization and the expression of various isoforms encoded by the six TPM genes in Fugu fish. However, the expression analysis of various TPM transcripts was carried out by conventional RT-PCR using gene and isoform specific primer-pairs with no Southern hybridization. Currently, there is no report on the quantification of various TPM transcripts in Fugu fish. On the basis of the ethidium bromide staining of the amplified DNA band on agarose gel, Toramoto et al (2004) inferred that the high molecular wt TPM1-1α and TPM1-2α are expressed in fast and slow skeletal muscle but very little in heart. As in amphibians [Spinner et al. 2002] and avian [Forry-Schaudies et al. 1990], TPM4-1α is expressed mostly in the heart. On the contrary, TPM4-2α is mostly expressed in fast and slow skeletal muscle but very little, if not at all, in heart. As in other vertebrates, TPM2α and TPM3α are expressed in both fast and slow skeletal muscle in Fugu fish.
It has been reported that the TPM4 gene is essential for cardiac contractility/function in zebrafish [Zhao et al., 2008]. Also, cDNAs of TPM1-1α [Accession # NM_001024467.1] and TPM1-2α [ Accession # M24635.1] have been cloned and sequenced from skeletal muscles. To the best of our knowledge, there is no report on comparative analyses of the expression of transcripts of various isoforms encoded by different TPM genes in zebrafish striated muscles. Therefore, we have undertaken a comprehensive study on tropomyosin RNA and protein isoform expression in zebrafish. As TPM2 and TPM3 are the two single copy genes in fish similar to other vertebrates we have focused mostly on TPM1-1, TPM1-2, TPM4-1, and TPM4-2.
In this report, we have employed conventional as well as qRT-PCR for determining the expression level of transcripts of sarcomeric isoforms of TPM1-1α, TPM1-2α, TPM4-1α, and TPM4-2α as well as the new TPM1-2ν isoform that we discovered in heart and skeletal muscles. Protein expression was analyzed by conventional and 2D Western blot analyses using anti-tropomyosin antibodies. Amino acid sequences of isolated peptides were determined by Mass Spectrometry. Expression constructs containing known TPM1-2α or a novel zebrafish isoform of TPM1-2ν were transfected into quail myotubes to determine whether they are incorporated into organized myofibrils in situ.
RESULTS
Identification of sarcomeric TPM1-1κ expressed in zebrafish striated muscles
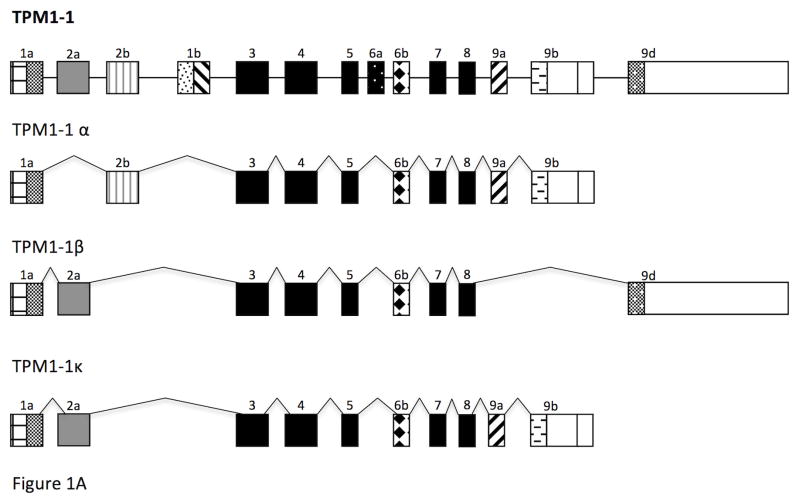
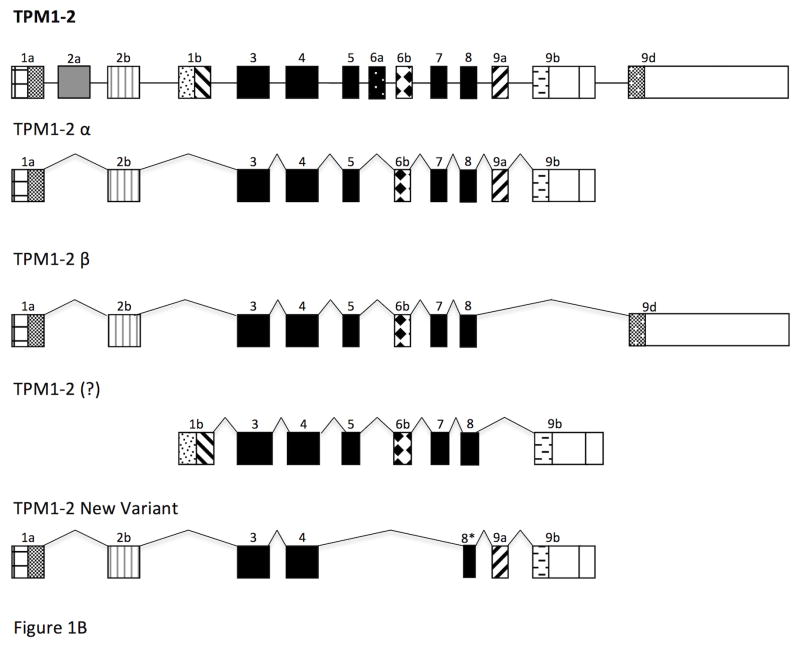
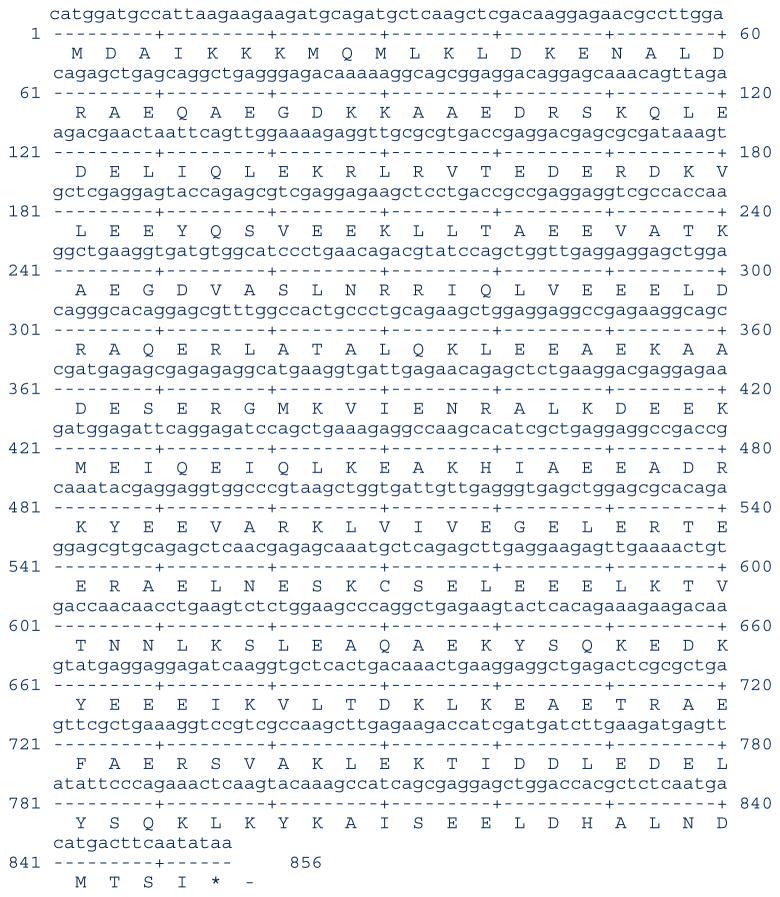
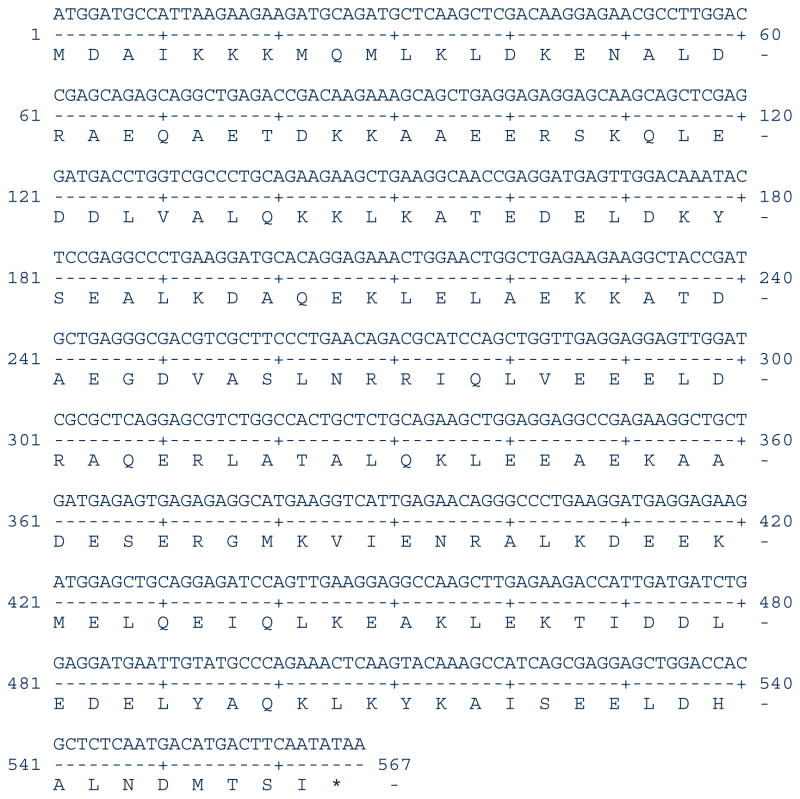
TPM1-1 and TPM1-2 are two paralogs, however, their exon compositions are somewhat different. TPM1-1 contains both exon 2a and 2b (Figure 1A) whereas TPM1-2 has only exon 2b (Figure 1B). The TPM1 gene in other vertebrates is known to generate two sarcomeric isoforms – TPM1α and TPM1κ. TPM1-1α consists of exon 1a, 2b, 3, 4, 5, 6b, 7, 8, and 9a/b whereas theTPM1κ contains all the same exons except that exon 2a replaces exon 2b (Figure 1A). Since TPM1-2 gene has only exon 2b, it cannot generate TPM1-2κ. To date, it is not known whether TPM1-1κ is expressed in zebrafish (Figure 1). We have addressed this issue using conventional RT-PCR with RNA from heart and skeletal muscle. The primer-pair for identification of TPM1-1κ was designed from published exon-specific nucleotides sequences of TPM1-1 as given in Table 1. The results depicted in Figure 2 show the ethidium bromide stained DNA bands amplified by the generic primer-pair both in heart (lane 1, panel A) and skeletal muscle (lane 2). No amplification was detected in lane 3, the negative control. When amplification was carried out with the TPM1-1κ specific primer-pair (see Table 1), TPM1-1κ expression was also evident in heart (lane 4, panel A) and in skeletal muscle (lane 5, panel A). No DNA was detected in primer-control (lane 6, panel A). The results were further confirmed by Southern blot hybridization with TPM1-1κ probe (panel B). As the generic primer-pair amplified both TPM1-1α and TPM1-1κ, the hybridization was positive with TPM1α probe (lanes 1 and 2 in panel C). However, TPM1-1α probe did not give any positive signal when the amplification was done with a TPM1-1κ specific primer-pair (lanes 4 and 5 in panel C). Our results strongly indicate that TPM1κ was expressed in heart and skeletal muscle in zebrafish as in axolotl [Thomas et al. 2010]. The expression of TPM1-1κ was further confirmed by determining the nucleotide sequences of the gel extracted DNA amplified by TPM1-1κ specific primer-pairs. The nucleotide as well as deduced amino acid sequences are given in Figure 3.
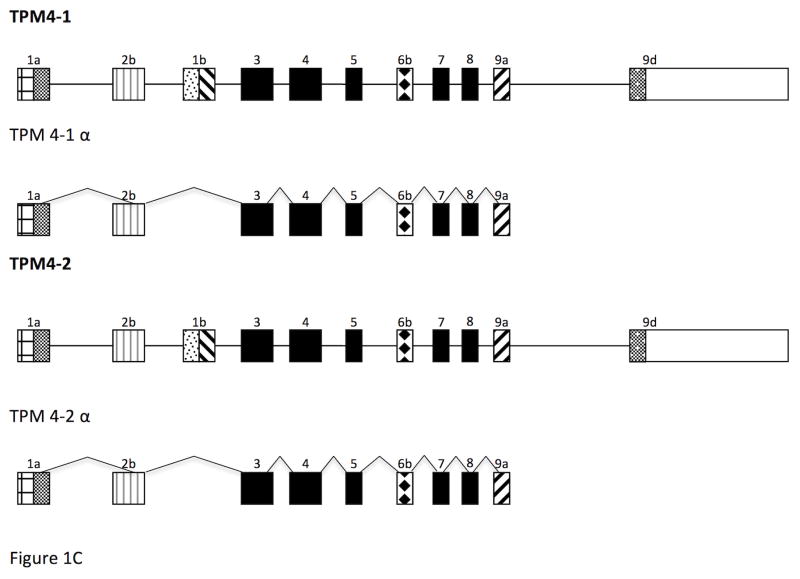
Figure 1. Alternative splicing pattern of TPM genes in zebrafish.
- TPM1-1
- TPM1-2
- TPM4-1 & TPM4-2
Table 1.
Nucleotide sequences of the primer-pairs used for conventional RT-PCR
| Primer Name | Gene | Isoform | Primer/Probe | Sequence | Reference |
|---|---|---|---|---|---|
| Gen TPM1-1α&κ(+) Gen TPM1-1α&κ(−) TPM1-1α. Pro.(+) TPM1-1κ Primer (+) TPM1-1κ Pro (+) |
TPM1-1 TPM1-1 TPM1-1 TPM1-1 TPM1-1 |
TPM1-1α & κ TPM1-1α & κ TPM1-1α TPM1-1κ TPM1-1κ |
Primer Primer Probe Prime Probe |
5′-CATGGATGCCATTAAGAAGAA-3′ 5′-AAGTCATGTCATTGAGAGCG-3′ 5′-CTTGAAGATGATCTGCTCGCAC-3′ 5′-TAGAAGACGAACTAATTCAG-3′ 5′-GGAAAAGAGGTTGCGCGTG-3′ |
|
| TPM1-2α (+) TPM1-2α (−) TPM1-2ν(−) |
TPM1-2 TPM1-2 TPM1-2 |
TPM1-2α TPM1-2α TPM1-2ν |
Primer Primer Primer |
5′-ACTCACACAGCCATGGAT-3′ 5′-GCCCGGAGCCGAGATGAGATGT-3′ 5′-TGGTCTTCTCAAGCTTGGCCTCCT-3′ |
M24635.1 M24635.1 This study |
| TPM2α(+) TPM2α(−) |
TPM2 TPM2 |
TPM2α TPM2α |
Primer Primer |
5′-ATGGAGGCCATCAAGAAGAA-3′ 5′-AGACAGAGGAGACCGAAAGAGT-3′ |
|
| TPM3α (+) TPM3α(−) |
TPM3 TPM3 |
TPM3α TPM3α |
Primer Primer |
5′-GTAACACATTAAAATGGCCGGAT-3′ 5′-TTAGAAACTATTGAGCTCGCTCA-3′ |
|
| TPM4-2(+) TPM4-2(−) TPM4-3(+) |
TPM4-2 TPM4-2 TPM4-2 |
TPM4-2α TPM4-2α |
Primer Primer for Nested PCR |
5′-TCCCTCACAGCAGCACAA-3′ 5′-CACAGATTCTGATTCAGTTATA-3′ 5′-ATGGAGGCCATCAAGAAGAA |
| Name | Gene | Isoform | Primer/Probe | Sequence | Reference |
|---|---|---|---|---|---|
| TPM4-1α (+) TPM4-1α (−) TPM4-1.Total(+) TPM4-1.Total(−) TPM4-1.Probe |
TPM4-1 TPM4-1 TPM4-1 TPM4-1 TPM4-1 |
TPM4-1α TPM4-1α Total transcripts Total transcripts |
Primer +ve Primer −ve Primer +ve Primer −ve Probe |
5′-CCATGGAGGCCATCAAGAA-3′ 5-CAGGGATGTCGTGTCATTGAGAGCATGA-3′ 5′-GCCCTGAACCGCAGGATT-3′ 5′-ATTTTTCCAGTTTGGCCACTGT-3′ 5′-AGAAGACAAGTATGAAGAAG-3′ |
NM001024467 NM_001024467 NM_001024467 NM_001024467 NM_001024467 |
Figure 2. Conventional RT-PCR amplification of TPM1α and TPM1κ with RNA from heart and skeletal muscle of Zebrafish.
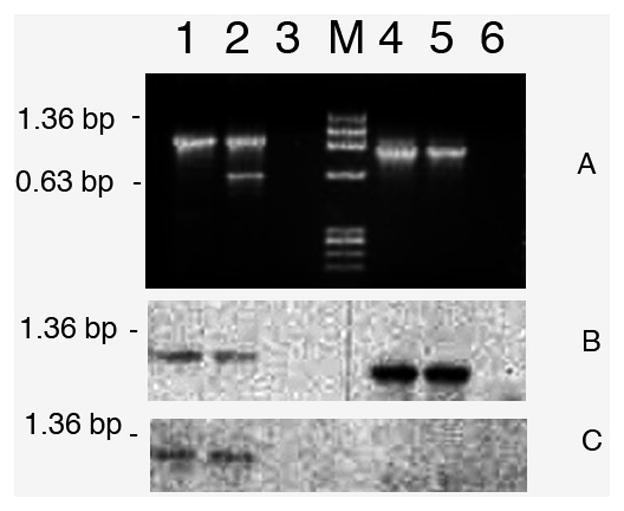
Lane 1. Amplification of both TPM1α and TPM1κ by generic primer-pair (Gen TPM1-1α&κ(+)/Gen TPM1-1α&κ(−) as given in Table 1) in heart; lane 2. Amplification of both TPM1α and TPM1κ by generic primer-pair in sk muscle; lane 3. Primer control; lane M. Marker; lane 4. Amplification of TPM1κ by isoform specific primer pair (TPM1-1κ Primer (+)/Gen TPM1-1α&κ(−) as given in Table 1) in heart; lane 5. Amplification of TPM1κ in skeletal muscle; lane 6. Primer control.
Figure 3. Nucleotide and deduced amino acid sequences of zebrafish TPM1-1κ.
The nucleotide sequence has been submitted in the GenBank (submission Id. 1968580)
Expression of TPM4-1 in zebrafish heart and skeletal muscles
The TPM4 gene in zebrafish is known to express a high molecular wt sarcomeric isoform designated as TPM4-1α and a low molecular wt isoform with exon 1b instead of exon 1a using a different promoter. We carried out conventional RT-PCR with RNA from heart and skeletal muscle using primer-pair specific for TPM4-1α and primer-pair that can amplify RNA for both short and long isoforms representing the total TPM4-1 transcripts. The results illustrated in Figure 4 show that TPM4-1α is expressed in heart (lane 1, panels A & B) but not in skeletal muscle (lane 2 in panels A & B). However, the total TPM4-1 transcripts are expressed in both heart and skeletal muscle (lanes 4 & 5 in panels A & B).
Figure 4. Conventional RT-PCR amplification of TPM4-1α and total TPM4-1 transcripts expressed in zebrafish heart and skeletal muscle.
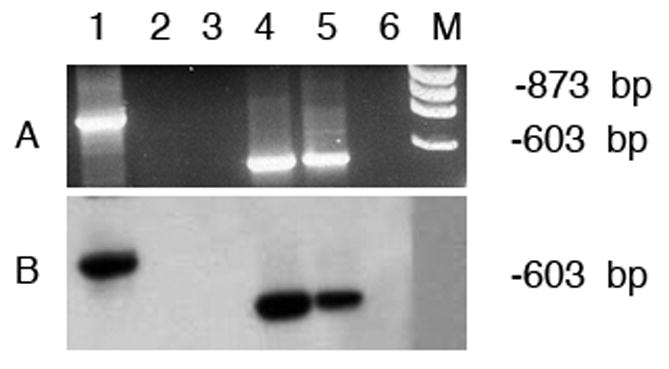
- Ethidium bromide staining of the agarose gel
- Hybridization with TPM4-1-specific probe
Lane 1.TPM4α in heart; lane 2. TPM4α in skeletal muscle; lane 3. Primer control; lane 4. Total TPM4-1 in heart; lane 5. Total TPM4-1 in skeletal muscle; lane 6. Primer control.
For lane 1to 3 PCR amplification was carried out with TPM4-1α specific primer-pair as shown in Table 1. The nucleotide sequences of the primer-pair used for the amplification of total TPM4-1 transcripts are also given in Table 1. Please note that the expression of TPM4-1α is practically undetectable in skeletal muscle (lane 2 in panels A and B). However, total TPM4 transcripts are present in both heart and skeletal muscle.
Identification, characterization, and expression of a new isoform of the TPM1-2 gene
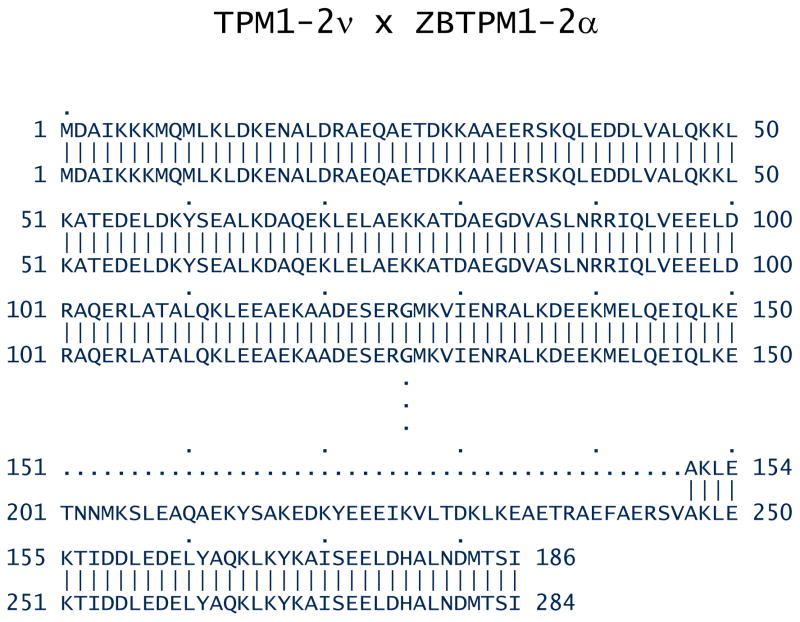
We designed a primer-pair to amplify the full length sarcomeric isoform TPM1-2α from the total skeletal muscle RNA using conventional RT-PCR. The nucleotide sequences of the primer-pairs are given in Table 1. The PCR-amplified DNA was cloned into a T/A cloning vector using our standard protocol [Denz et al. 2011]. Ten clones were randomly selected and the isolated DNA from the selected clones were sequenced. The nucleotide sequence from most of the clones were with full-length TPM1-2α but a few of the clones designated TPM1-2ν (Figure 5) had a shorter nucleotide sequence with a shorter open reading frame, which contains exons 1a, 2b, 3, 4, 8, & 9a/b and encodes 186 amino acid long polypeptide without altering the open reading frame (Figure 1B & Figure 5). Figure 6 demonstrates the comparison of the protein sequences encoded by TPM1-2α and TPM1-2ν. Next, we designed TPM1-2ν specific primer-pair and evaluated the expression of TPM1-2α and TPM1-2ν in heart and skeletal muscle using conventional RT-PCR. The level of expression of TPM1-2α and TPM1-2ν transcripts in zebrafish heart are practically undetectable. On the contrary, both TPM1-2α and TPM1-2ν are expressed in skeletal muscle, which was further confirmed by the subsequent quantification of expression of various TPM isoforms including TPM1-2ν in zebrafish striated muscle as stated in the following section.
Figure 5. Nucleotide and deduced amino acid sequences of the newly identified TPM1-2ν isoform from zebrafish striated muscle.
The nucleotide sequence has been submitted to the GenBan (submission Id: 1968589).
Figure 6.
Comparison of the deduced amino acid sequences of TPM1-2ν with the published TPM1-2α protein.
Expression analyses of TPM2α and TPM3α in heart and skeletal muscle using conventional RT-PCR
The data in Figure 7 indicate that both TPM2α and TPM3α transcripts are expressed in heart and skeletal muscle from adult zebrafish.
Figure 7. Conventional RT-PCR analyses on the expression of TPM 2α and TPM 3α in heart and skeletal muscle.
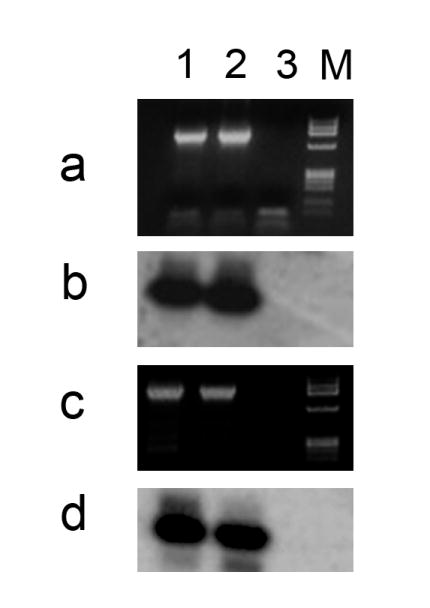
Panel a: Ethidium bromide staining of the PCR products amplified with TPM3α specific primer-pair as shown in Table 1.
Panel b. Southern hybridization of the TPM3α amplified DNA with TPM3α specific probe (5′-GCACATTGCTGAGGAGGCTGACCGC-3′).
Panel c. Ethidium bromide staining of the PCR amplified DNA with TPM2α specific primer-pair as given in Table 1.
Panel d. Southern hybridization of the TPM2α amplified DNA with TPM2α specific probe (5′-GATTCTTGAGGGTGAGCTTGAGC-3′).
Lanes 1: Heart; Lane 2: Sk muscle; Lane 3: Primer-control
Note that TPM2α and TPM3α transcripts are expressed both in heart and skeletal muscle.
Identification and characterization of TPM4-2α, the sarcomeric isoform of the TPM4-2 gene
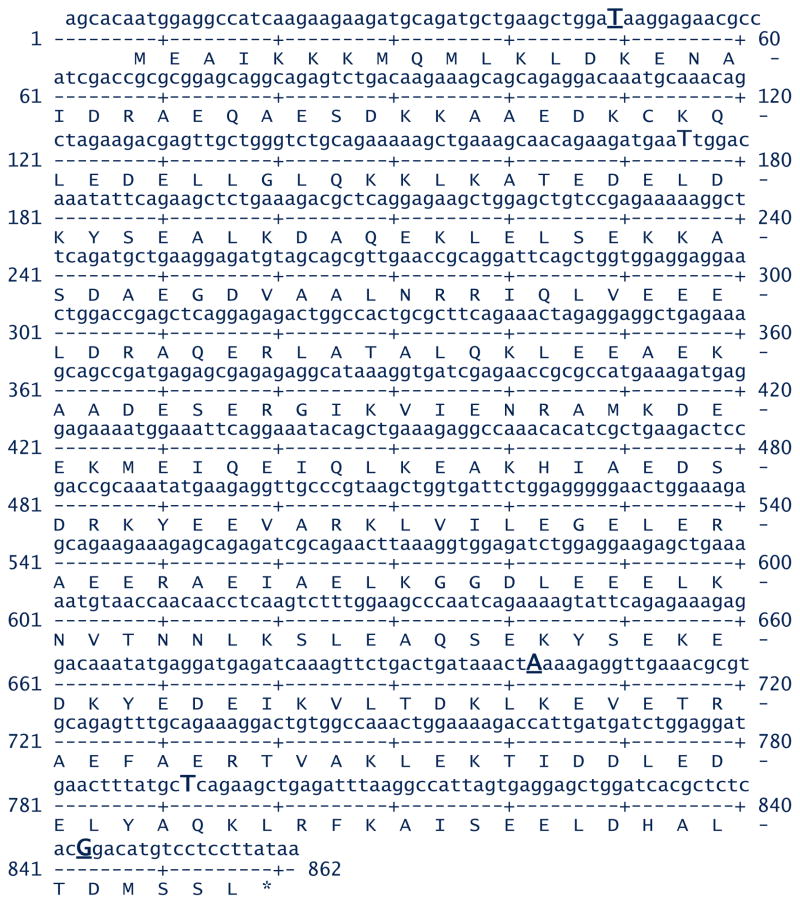
Recently, the predicted TPM4-2α nucleotide as well as deduced amino acid sequences have been posted in GenBank (accession # XM_005168448). We designed primer pairs (Table 1) and performed conventional RT-PCR with the cDNAs made of RNA from zebrafish heart and skeletal muscle. The mRNA copy numbers of TPM4-2α in striated muscle is most likely very low. Hence, hardly any discrete band in the agarose gel after staining with ethidium bromide was visible. We diluted the original PCR product (1:200) and used for second PCR amplification with a second set of nested primers (Table 1). A clear and distinct visible band was seen in the sample from heart RNA, whereas the signal was quite lighter in skeletal muscle. DNA was eluted from the band and was ligated to the T/A cloning vector. DNA was isolated from 10 colonies with positive identification and sequenced from both sides. The nucleotide as well as deduced amino acid sequences are shown in Figure 8. The nucleotide as well as deduced amino acid sequences of TPM4-2α from heart and skeletal muscle are identical. They match with the predicted sequence available in the GenBank (Accession # XM_005168448 ) with the exception of 4 nucleotides, which are shown in bold larger font and underlined. These four nucleotide changes cause only silent mutation and no changes in the amino acids.
Figure 8. Nucleotide and deduced amino acid sequences of the TPM4-2α isoform from zebrafish striated muscle.
The nucleotide sequence has been submitted to the GenBan (submission Id: 1968883).
qRT-PCR for determining relative expression of TPM1-1α, TPM1-1κ, TPM1-2α, TPM1-2ν, TPM4-1α, and TPM4-2α in heart and skeletal muscle
We analyzed the qRT-PCR results by 2^-(ddCT) method using zebrafish 18S rRNA as the reference gene to determine the relative expression of TPM1-1α and TPM1-1κ. It is to be noted that TPM1-1α and TPM1-1κ have the identical N- and C- terminal ends. Hence, both isoforms contains exon 9b at the C-terminus. In order to eliminate the interference of other isoforms, we used an exon 9 specific reverse primer to make the 1st strand cDNA with total RNA from heart and skeletal muscle. Melt curve data show different unique melting temperatures for TPM1-1α and TPM1-1κ (data not shown). Also, agarose gel electrophoresis of the PCR amplified DNA for TPM1-1α or TPM1-1κ shows a single band for each of them. Hence, each primer pair recognizes only TPM1-1α or TPM1-1κ amplified DNA. The results presented in Figure 9 indicate that the level of expression of TPM1-1α in zebrafish skeletal muscle is significantly higher compared to its expression in cardiac muscle. On the other hand, the level of expression of TPM1-1κ is comparable in heart and skeletal muscle (Figure 9).
Figure 9. Relative expression of TPM1-1α and TPM1-1κ in zebrafish heart and skeletal muscle.
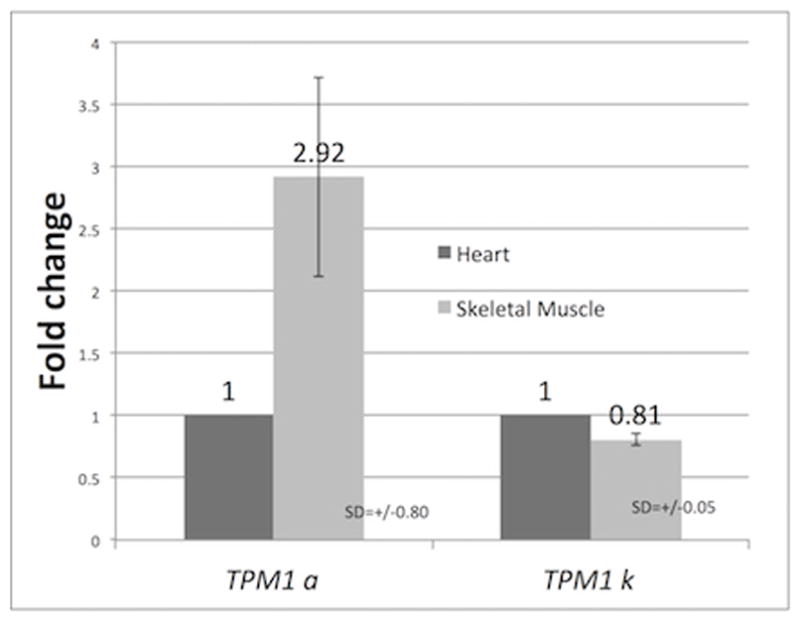
Fold changes of TPM1-1α and TPM1-1κ in zebrafish heart and skeletal muscle. qRT-PCR was carried out in triplicate with isoform specific primer-pairs sequences of which are given in Table 2. Zb. Zb.Fish.TPM1-1α(+)/Zb.Fish.TPM1-1α(−) and Zb.Fish. TPM1-1κ(+)/ Zb.Fish. TPM1-1κ(−) were used for TPM1α and TPM1-1κ respectively. The primer-pair used for 16S rRNA is given in Table 2. The cDNA was made with Zb.Fish.TPM1-1Ex9A(−).
Next, we determined the relative expression of TPM1-2α and the new variant TPM1-2ν in heart and skeletal muscle. Again, both isoforms contain identical N and C-terminal ends. As stated above we used a TPM1-2 specific oligonucleotide from exon 9 to make the cDNA. The nucleotide sequences of different oligonucleotides used are given in Table 1 and Table 2 The results presented in Figure 10 indicate that the relative expression of both the isoforms is significantly higher in skeletal muscle. On the contrary, the relative expression of TPM4-1α and TPM4-2α is significantly higher in cardiac muscle (Figure 11). In case of TPM4-1α, the cDNA was made with an oligo dT primer and exon 9A specific oligonucleotide (as presented in Table 2) was used for cDNA of TPM4-2α.
Table 2.
Nucleotide sequences of the primer-pairs used for qRT-PCR
| Name | Gene | Isoform | Primer/cDNA | Sequence | Reference |
|---|---|---|---|---|---|
| Zb.Fish.TPM4-1α (+) Zb.Fish.TPM4-1α (−) Zb.Fish.TPM4-1Ex9A(−) |
TPM4-1 TPM4-1 TPM4-1 |
TPM4-1α TPM4-1α TPM4-1 |
Primer Primer cDNA |
5′-AGAAGACAAGTATGAAGAAG-3′ 5′-GTAGAGCGAGACAGATGGAT-3′ 5′CAGGGATGTCGTGTCATTGAGAGCATGA-3 |
BC085518 BC085518 BC085518 |
| Zb.Fish. TPM4-2α (+) ZB.Fish. TPM4-2α(−) ZB.Fish.TPM4-2 Ex9A(−) |
TPM4-2 TPM4-2 TPM4-2 |
TPM4-2α TPM4-2α TPM4−2 |
Primer Primer cDNA |
5′-AAGAGGACAAATATGAGGAT-3′ 5′-ATACCATCTATAGGCACTCAT-3′ 5′-CACAGTTCTGATTCAGTTATA-3′ |
|
| Zb.Fish.TPM1-1α(+) Zb.Fish.TPM1-1α(−) Zb.Fish. TPM1-1κ(+) Zb.Fish. TPM1-1κ(−) Zb.Fish.TPM1-1Ex9A(−) |
TPM1-1 TPM1-1 TPM1-1 TPM1-1 TPM1-1 |
TPM-1α TPM-1α TPM-1κ TPM-1κ TPM-1α&κ |
Primer Primer Primer Primer cDNA |
5′-AGAAAGCTGCGGAGGACAAAT-3′ 5′-TCCTCCACCAGCTGAATCCTG-3′ 5′-CAGTTAGAAGACGAACTAA-3′ 5′-ACATCACCTTCAGCCTTG-3′ 5′-AAGTCATGTCATTGAGAGCG-3′ |
NM_001024467.1 NM_001024467.1 This study This study NM_001024467.1 |
| Zb.Fish.TPM1-2α(+) Zb.Fish.TPM1-2α(−) Zb.Fish.TPM1-2ν (+) Zb.Fish.TPM1-2ν (−) |
TPM1-2 TPM1-2 TPM1-2 TPM1-2 |
TPM1-2α TPM1-2α TPM1-2NeW TPM1-2New |
Primer Primer Primer Primer |
5′-TGACTGACAAGCTGAAGGAGG-3′ 5′-GCCCGGAGCCGAGATGAGATGT-3′ 5′-CCCTGAACAGACGCATCCAGC-3′ 5′-TGGTCTTCTCAAGCTTGGCCTCCT-3′ |
M24635.1 M24635.1 This study M24635.1 M24635.1 |
| Zb.Fish. 18S.rRNA (+) Zb.Fish. 18S.rRNA (−) |
18s rRNA 18s rRNA |
- - |
Primer Primer |
5′-GTGGAGCGATTTGTCTGGTT-3′ 5′-TTATGACCTGCGCTTACTGG-3′ |
FJ915075.1 FJ915075.1 |
Figure 10. Relative expression of TPM1-2α and TPM1-2ν in zebrafish heart and skeletal muscle.
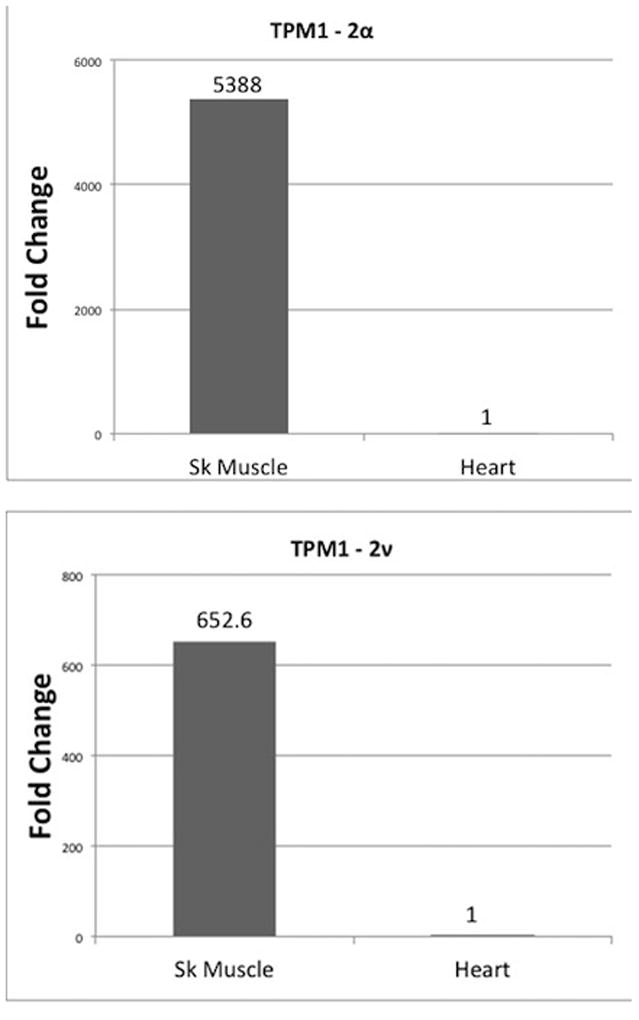
qRT-PCR was carried out in triplicate with isoform specific primer-pairs sequences of which are given in Table 2. The primer used for 16S rRNA is shown in Table 2.
Figure 11. Relative expression of TPM4-1α and TPM4-2 α in zebrafish heart and skeletal muscle.
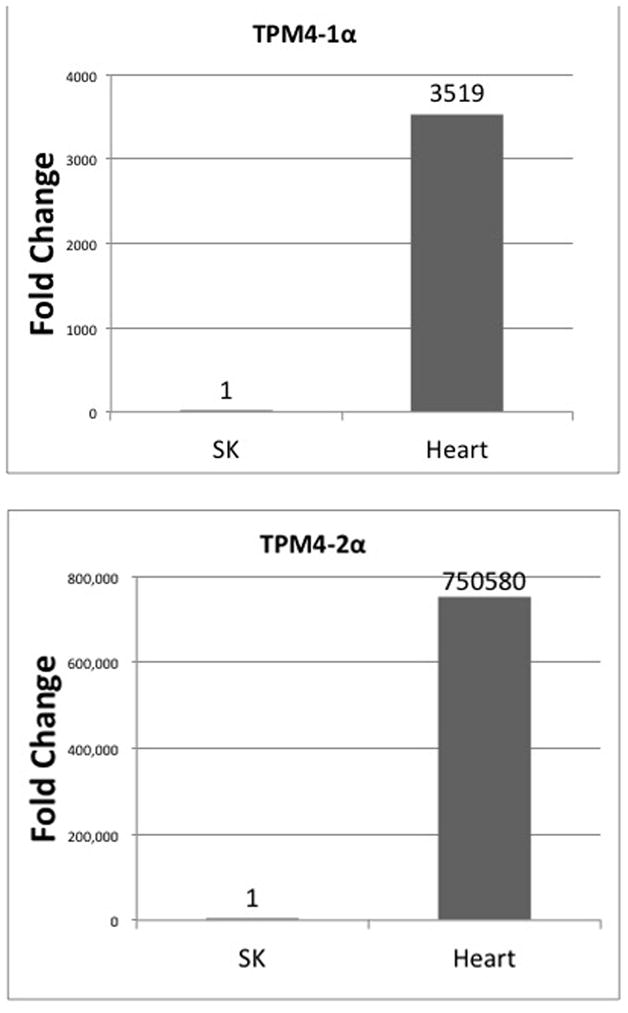
qRT-PCR was carried out in triplicate with isoform specific primer-pairs sequences of which are given in Table 2. The nucleotide sequences of the Primer-pair for amplification of 16 S rRNA is presented in Table 2. cDNA for TPM4-2 were made with Exon (A(−) oligonucleotide (Table 2) whereas oligo dT was used for TPM4-1α cDNA.
TOP: TPM4-1α; Bottom: TPM4-2α
Determination of absolute copy number of various TPM isoforms in zebrafish heart and skeletal muscle (Table 3)
Table 3.
Copy number of TPM1-1α, TPM1-2α, TPM1-2New variant, & TPM4-1α
| TPM isoform | Copy number (number of copies per μgm of total RNA | ||
|---|---|---|---|
| Heart | Skeletal Muscle | Sk muscle:Heart | |
| TPM1-1α | 2.36 × 10^4 ± 2.05 × 10^3 | 2.24 x 10^7 ± 1.15 × 10⁵ | 949 |
| TPM1-2α | 7.72 × 10^5 ± 1.2 × 10⁴ | 5.14 × 10^8 + 8.5 × 10^6 | 665 |
| New TPM1-2 variant | 8.82 × 10^2 + 10^1 | 1.31 × 10^5 + 9.2 × 10^2 | 148 |
| TPM4-1α | 1.56 × 1.75^8 ±1.75 × 10^6 | 5.39 × 10^4 ± 1.42 × 10^3 | 0.0003 |
The quantification of copy number of different TPM isoforms was carried out using our published protocol [Nan et al., 2015; Dube et al., 2014]. The standard curves for different isoforms are not shown. The results presented in Table 3 showed the copy number for each isoform in heart and skeletal muscle. Of all the isoforms, the copy number of TPM1-2α per μg of total RNA is highest in skeletal muscle (5.14 × 10^8), followed by the expression of TPM4-1α in zebrafish cardiac muscle, which is 1.56 X 10^8. Again, as was found with relative expression results, the expression of TPM4-1α is much higher in heart compared to skeletal muscle. The expression pattern of TPM1-1α is higher in skeletal muscle. The results of the expression of various isoforms using two different methods are very similar. It is important to point out that the expression of TPM1-2α is about 10^4 fold higher than the expression of TPM1-2ν isoform in skeletal muscle. Again, the expression of both isoforms is significantly higher in skeletal muscle (Table 3).
Transfection of pYFPN1.TPM1-2α and pYFPN1.TPM1-2ν in quail myotubes
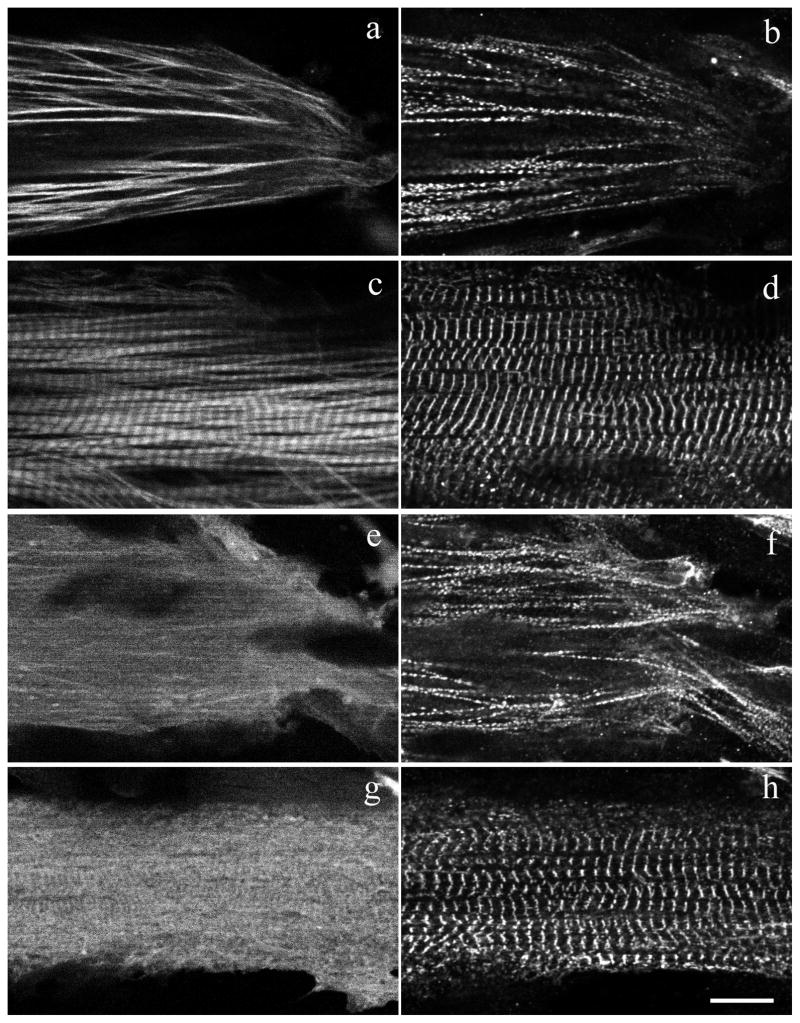
The newly discovered isoform TPM1-2ν, like the sarcomeric isoform TPM1-2α (Figure 2A), contains exon 1a and exon 9a/b at the N-terminus and C-terminus ends, respectively. However, exons 5, 6b, 7, and 8 are missing in TPM1-2ν. In order to examine whether this new isoform can localize in organized myofibrils in vivo, we made fusion protein constructs of pYFPN1.TPM1-2α and pYFPN1.TPM1-2ν. Each expression construct was transfected into quail skeletal muscle myotubes and cells were then fixed after three days and stained with anti-alpha-actinin monoclonal antibody (Figure 12). In the peripheral areas of transfected myotubes, especially at the spreading ends and sides (Figure 12a and 12b), the full length YFP.TPM1-2α was incorporated in a non-striated pattern in the premyofibrils and nascent myofibrils as defined by White et al [2014]. Distal to the ends of the myotubes and in the shafts of myotubes, YFP.TPM1-2α was most prominently localized in banded patterns (Figure 12c) reflecting the aligned thin filaments of the I-bands of mature myofibrils [White et al 2014; Sanger et al. 2017]. On the other hand, YFP.TPM1-2ν fusion protein exhibits a mostly diffuse cytoplasmic background with weak localization in the myofibrils in both the spreading ends and the central regions of the myotubes (Figure 12 e, g). The expression of YFP.TPM1-2α and YFP.TPM1-2ν does not affect the myofibrils in myotubes as indicated by alpha-actinin antibody staining (Figure 12b, d, f, h).
Figure 12. Fluorescence image of quail myotubes transfected with YFP fused zebrafish and TPM1-2ν.
Skeletal muscle myotubes were transfected with YFP fused zebrafish TPM1-2α (a,c) and TPM1-2ν (e,g). Cells were then fixed and stained with alpha-actinin antibody to localize premyofibrils at the spreading end of myotubes (b,f) and mature myofibrils in the central regions of myotubes (d,h). Note that the YFP-TPM1-2α localized in both premyofibrils (a,b) and mature myofibrils (c,d), while YFP-TPM1-2ν is in the mostly diffused area in cells with very weak localization in the myofibrils (e–h). The expression of YFP-TPM1-2ν does not affect myofibrils in the myotube (f,h). Bar = 10 μm.
2D Western blot analyses with protein extracts of adult zebrafish skeletal muscle and heart with CH1 monoclonal antibody that recognizes the tropomyosin isoforms with exon 9a peptide at the C-terminus
Figure 13 shows the 2D PAGE stained with Coomassie blue before western blotting and panel b depicts signals on the x-ray film exposed on the blot after being treated with ECL. Three spots were identified and marked as A, C, and X (Figure 13b). The results suggest that there are at least 3 detectable CH1 positive tropomyosin molecules present in the extract from adult zebrafish skeletal muscle. It is to be noted that each of these spots represents high molecular wt (32 kD and above) tropomyosin protein. However, we have failed to detect the presence of a low molecular wt CH1-positive tropomyosin protein with a molecular mass ~28 kDa like TPM1-2ν in zebrafish skeletal muscle. Similarly, in adult zebrafish heart extract we have identified two CH1 positive protein spots (above 32 kDa) designated as D and E (Figure 13d). Again, we did not detect CH1 positive tropomyosin with a mass lower than 28 kDa.
Figure 13. 2D western blot analyses with extracts from adult zebrafish Heart and skeletal muscle.
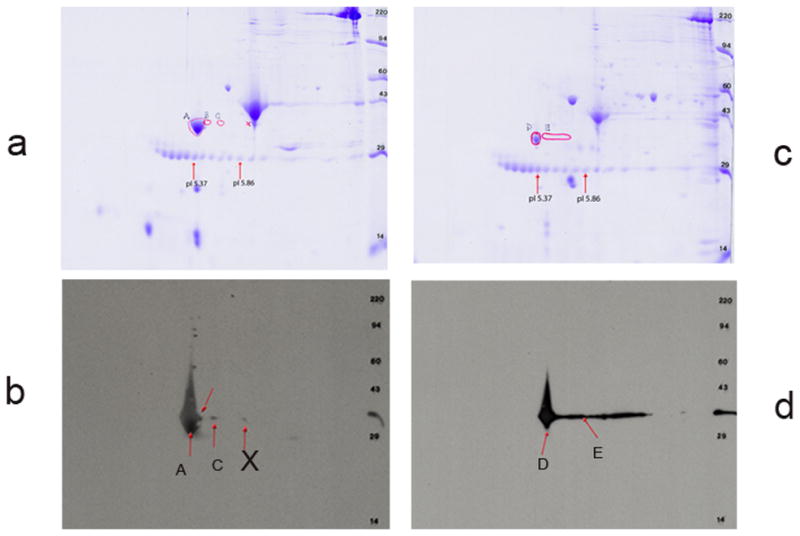
- The Coomassie stained zebrafish skeletal muscle protein across the gel.
- The PVDF filter was stained with CH1 monoclonal antibody followed by treatment with secondary antibody as mentioned under materials and methods, and subsequently treated with ECL and exposed to x-ray film. Developed X-ray film was superimposed on the top of the Coomassie stained second gel as well as on the Coomassie stained PVDF filter. Three spots A, C, X were marked, excised and was used for extraction of protein for subsequent Mass spectrometric analyses.
- The Coomassie stained zebrafish cardiac muscle protein across the gel.
- Same as in b. However, in this gel 2 spots D & E were marked for subsequent Mass Spectrometric analyses.
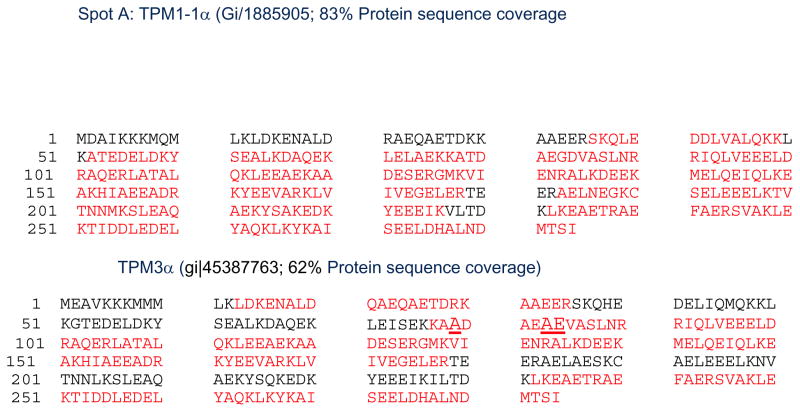
In the next step, each of the protein spots that were separated by 2D PAGE and stained by Coomassie dye were excised, washed and the proteins from the gel were treated/processed according to the published protocol (please see the method section) for LC-MS/MS analyses using NanoAcuity UPLC (Micromass/Waters, Milford, MA) coupled to a Q-TOF Ultima API MS (Micromass/Waters, Milford, MA). The raw data were processed using ProteinLynx Global Server (PLGS, version 2.4) software. Mascot and PLGS database search provided a list of proteins for each gel band. To eliminate false positive results, for the proteins identified by either one peptide or a mascot score lower than 25, we verified the MS/MS spectra that led to identification of a protein. In spot A, a total of 51 peptide sequences with 2309 Mascot Score identified TPM1-1α (gi|18859505) with MW 32774. Peptide sequences cover 83% of the identified zebrafish protein TPM1-1α (Figure 14). Subsets of these peptides also identify the presence of zebrafish TPM3α protein in zebrafish skeletal muscle extract (Spot A2 in Figure 14) covering 62% of the protein sequence. The peptide LDKENALDQAEQAETDRKAAEER, a signature peptide of TPM3 in exon 1a, was detected. Again, the peptide KAADAEAEVASLNR is also a typical TPM3 specific peptide that was also being sequenced.
Figure 14. Identification of amino acid sequences from the peptides extracted from spot A after 2D western blot analyses of zebrafish skeletal muscle extracts with CH1 antibodies.
Red color letters indicates the isolated peptides that have been sequenced by Mass spectrometry.
Top: TPM1-1α
Bottom: TPM3α. Note that peptide from amino acid residue 13 to 35 in exon 1α is specific form TPM3 and also the peptide LEISEKKAADAEAEVASLNR from 176 to 190 in TPM3α is different from TPM1-1α isoform. The altered amino acid residues marked in larger font and underlined.
The results indicate that both TPM1-1α and TPM3α are expressed in zebrafish skeletal muscle.
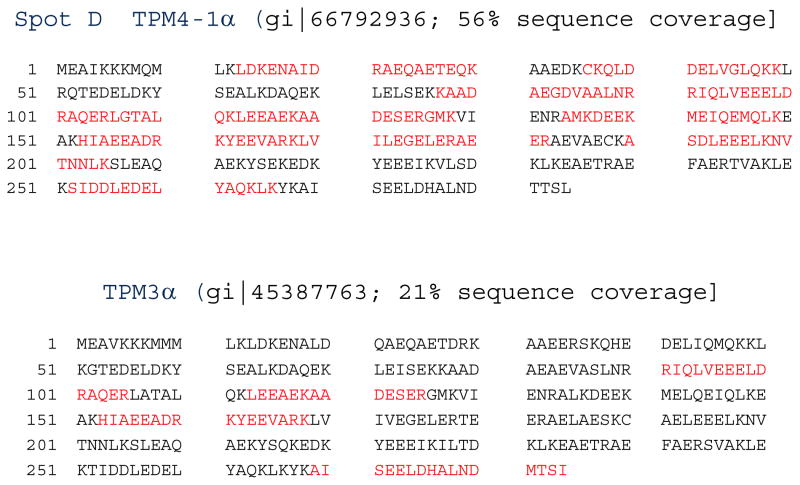
As mentioned earlier the 2D Western blot was also carried out with extract from adult heart tissue and CH1 monoclonal antibody. Two spots with a positive signal were marked D and E in (panel c in Figure 13d). From Spot D, 33 peptides were extracted. Twenty four of them with 875 Mascot Score were aligned with TPM4-1α of MW 32846 (gi|66792936) and the remaining 9 peptide sequences with Mascot Score 349 aligned with TPM3α of MW 32941 (gi|45387763 ) with 21% protein sequence coverage (Figure 15). The results strongly suggest that TPM4-1α is the major sarcomeric TPM isoform expressed in adult hearts. In addition, adult zebrafish hearts may also express TPM3α protein. The expression of a lower quantity of TPM3α protein in human cardiac tissues has also been recently reported [Marston et al. 2013].
Figure 15. Identification of amino acid sequences from the peptides extracted from spot D after 2D western blot analyses of zebrafish heart extracts with CH1 antibodies.
Top: TPM4-1α
Bottom: TPM3α
DISCUSSION
An ancient segmental duplication or whole genome duplication in fish lineage [Ikeda et al., 2003; Smith et al., 2002; Amores et al., 1998] resulted the creation of the paralogs of TPM1 and TPM4 genes in Fugufish and zebrafish. Both paralogs TPM1-1 & TPM1-2 as well as TPM4-1 & TPM4-2 co-exist in zebrafish. Interestingly, the protein sequences of TPM1-1α and TPM1-2α are ~98% identical suggesting that both copies of TPM-1 paralogs are capable of performing the same/identical function within the cells. This is also true for TPM4-1α and TPM4-2α [Toramoto et al., 2004]. The retention of both copies of these paralogs implies that each is under strong selective pressure such that there is a very little change in the coding regions. The non-coding regions and/or the regulatory region of one or both members of the paralog may undergo mutational alterations. As a result, the transcriptional efficiency of both copies of the gene decrease significantly and each of them produces fewer copy numbers of transcripts, which are sufficient enough for maintaining an effective concentration of the protein(s) in vivo [Toramoto et al. 2004]. Hence, both copies of genes are essential for cellular function(s). Higher intracellular concentration of TPM1 protein(s) does not necessarily mean that it requires a large number of corresponding transcripts. Two different groups independently reported that the ablation of the TPM1 gene resulting in a single copy of the gene in mice reduced TPM1α transcript levels to half but the protein concentration of the sarcomeric TPM1α in the ablated mice was the same, if not identical to wild type [Blanchard et al. 1997; Rethinasamy et al., 1998]. This is due to a variable translational efficiency of TPM1α transcripts, which in turn, regulate the expression level of the gene product [Dube et al., 2014]. In order to comprehend the reason for the co-existence of both members of the TPM1 and/or TPM4 paralogs in zebrafish, one would need more information about the quantity of transcripts as well as the corresponding protein(s) for each isoform of the TPM1-1 and TPM1-2 genes. This is true also for TPM4-1 and TPM4-2 paralogs. As TPM1 has more than 15 different isoforms, it would be a huge task to quantify all the different transcripts as well as the corresponding TPM1 proteins. Lack of isoform specific anti-tropomyosin antibodies would make protein quantification extremely difficult, if not impossible. Various isoforms of tropomyosin are expressed in striated muscles, smooth muscles, and non-muscle cells thereby performing a variety of functions [Lees-Miller and Helfman, 1991]. In this study, we have analyzed only the isoforms expressed in striated muscles involved in muscle contraction in zebrafish. Thus, we have quantified the expression of the transcripts of sarcomeric isoforms only. Also, for protein expression, we have performed 2D western blot analyses using CH1 monoclonal antibody followed by Mass spectrometry that allowed us to assess the expression of the various tropomyosin proteins in cardiac and skeletal muscles in zebrafish.
TPM1 in other vertebrates generates two alternatively spliced sarcomeric isoforms- TPM1α and TPM1κ [Thomas et al. 2010]. Using conventional RT-PCR with isoform specific-primer pairs we have found that TPM1-1κ is expressed in zebrafish heart and skeletal muscle (Figure 2). We have cloned and sequenced the PCR amplified cDNA of TPM1-1κ (Figure 3). Our qRT-PCR, using isoform specific primer-pairs show that the relative expression of TPM1-1α compared to TPM1-1κ is higher in skeletal muscle. However, the expression of TPM1-1κ is comparable in heart and skeletal muscle (Figure 9). We have also performed qRT-PCR to determine the relative expression of TPM1-2α and TPM1-2ν in heart and skeletal muscle. The relative expression of TPM1-2α like TPM1-1α is significantly higher in skeletal muscle (Figure 10). Finally, the relative expression of both TPM4-1α and TPM4-2α is significantly higher in zebrafish heart compared to skeletal muscle (Figure 11). It is to be noted that our finding on the higher expression level of TPM4-2α in zebrafish heart compared to skeletal muscles is quite different from its expression in Fugu fish. TPM4-2α was found to be expressed mostly in skeletal muscles [Toramoto et al. 2004]. Further, we have determined the absolute copy number of the transcripts of TPM1-1α, TPM1-2α, TPM1-2ν, and TPM4-1α in heart and skeletal muscle (Table 3). The expression levels of TPM1-1α and TPM1-2α are practically identical – about 600–1000 fold higher in skeletal muscle compared to heart. On the contrary, the expression level of TPM4-1α is much higher in heart (>3333 fold). The transcription pattern as well as transcriptional efficiency of TPM1-1α and TPM1-2α are comparable (Figures 9 & 10; Table 3); whereas TPM4-1α expression is very cardiac-specific, which is true for TPM4α expression in avian as well as amphibian species.
From transcript analyses, one can argue TPM1-1α and TPM1-2α may be involved in myofibrillogenesis primarily in skeletal muscles. So, for the effective concentration of sarcomeric TPM1 protein within the cell both gene products are required. In cardiac myofibrillogenesis a lower amount of TPM1 protein is required so the transcriptional efficiency or splicing event or both are significantly lower. This means that transcripts of both paralog genes are lower in quantity. Protein analyses will provide further information about the magnitude of the expressed TPM molecules encoded by the each of the paralog genes. We performed western blot analyses of the extracts from heart and skeletal muscles with CH1 monoclonal antibodies that recognize all sarcomeric tropomyosin with exon 9a peptide at the C-terminus ends. We found strong signals at the ~32–40 kD region suggesting that sarcomeric TPM proteins are expressed in heart and skeletal muscle. As isoform specific anti-TPM antibodies are not available, therefore we performed 2D western blot analyses with CH1 monoclonal antibodies. Protein was extracted from the gel spots (with positive signal) and amino acid sequences were determined using Mass spectrometry. In hearts, the expression of TPM4-1α and TPM3α were detected. A large number of extracted peptide are being sequenced that led to the sequencing of 83% of TPM4-1α isoform. This most likely suggests that a relatively high concentration of TPM4-1α protein is present in zebrafish heart. Our finding is consistent with the report that TPM4-1 is essential for cardiac contractility in zebrafish [Zhao et al, 2008]. Although TPM3α is known to be expressed mostly in slow muscles in mammalian systems, recently its low level of expression has been reported in human hearts [Marston et al., 2013]. In fact, our own unpublished results also indicate a low level of expression of TPM3α in human cardiac tissues. Also, TPM2α has long been known to be expressed in mammalian hearts including humans at a very low level (~5% of the total sarcomeric TPM) [Rajan et al. 2010]. Interestingly, transcripts of both TPM1-1α and TPM1-2α are expressed in zebrafish heart, however, we were unable to detect the expression any of the corresponding proteins in zebrafish heart. Our inability to detect TPM1-1α and TPM1-2α in zebrafish heart could be due to extremely low levels of expression.
TPM protein expression in zebrafish skeletal muscle is rather interesting. The results depicted in Figure 14 show the expression level of TPM1-1α in skeletal muscle. As the number of peptides and percent of protein sequences are high one can assume that the expression level of TPM1-1α is very high in skeletal muscle. The protein expression is consistent with results on the expression of TPM1-1α transcripts (Figure 9). The next most abundant TPM protein in zebrafish skeletal muscle is TPM3α, which is also consistent with fact that TPM3α is expressed primarily in slow muscles in other species. Our conventional RT-PCR also show that the level of expression of TPM3α is much higher in skeletal muscle compared to to its expression in heart (Figure 7). The most striking finding is the absence of the TPM1-2α protein in skeletal muscle. The expression of transcripts of TPM1-1α and TPM1-2α are high and comparable and the expression of TPM1-1α protein in skeletal muscle is high still we were unable to detect TPM1-2α specific protein. One of the reasons could be due to a very low level of expression of TPM1-2α protein compared to TPM1-1α protein. As a result, we were unable to detect peptide(s) specific for TPM1-2α prepared from the CH1 positive spot “A” (Figures 14 and 15). Another possibility is that although both paralogs can make a similar quantity of transcripts, the translational efficiency of TPM1-2α is very poor or may undergo translational repression due the mutation at the regulatory sequences at the UTRs regions. Additionally, the newly discovered alternatively spliced isoform TPM1-2ν may compete with TPM1-2α transcripts and thereby exert an inhibitory effect. It is to be noted that both 5′UTR and 3′UTR of the two transcripts are identical. If it is true that TPM1-2α transcripts undergo translational repression in skeletal muscle this finding itself justifies the co-existence of the TPM1 paralogs in zebrafish.
Zhao et al [2008] reported that a heart-specific TM isoform of TPM4-1 gene is essential for myofibril assembly and heartbeat in zebrafish. McKeown et al [2014], however, pointed out that a lack of confirmed association of TPM4α protein with thin filaments makes it unclear whether the myofibril assembly defects observed in TPM4-deficient zebrafish represent primary or indirect events. These authors also suggest that the primary direct evidence for a role of TM in myofibril assembly comes from the Mexican axolotl, in which the naturally occurring cardiac mutation eliminates TM expression and disrupts cardiac myofibril assembly via aberrant intracellular targeting of a host of thin filament and sarcomere-associated proteins and lack of coalescence of organized sarcomeres [ Lemanski 1979; Zajdel et al., 1998, 1999, 2003; McLean et al., 2006]. It is important to point out that more than one isoform of sarcomeric TPM proteins for example, TPM1α, TPM1κ, and TPM4α, are expressed in axolotl hearts. In tropomyosin deficient cardiac mutant axolotl hearts, however, all these sarcomeric tropomyosin proteins are practically absent. One can promote myofibrillogenesis in mutant axolotl hearts in situ either by lipofecting total tropomysin protein or by ectopically expressing axolotl TPM1α or murine TPM1α or axolotl TPM1κ or axolotl TPM4α protein [Denz et al., 2004; Zajdel et al., 1998,1999, 2007; Spinner et al. 2002]. Conversely, ectopic expression of murine TPM2α protein fails to promote myofibrillogenesis in cardiac mutant axolotl hearts [Zajdel et al. 1998]. Although the transcript analyses show that TPM1-1α, TPM1-2α, and TPM4-1α are expressed in zebrafish heart, we were unable to detect the presence of TPM1-1α and TPM1-2α protein there [Figure 15]. On the contrary, Mass Spectrometry results indicate that TPM4-1α is the major sarcomeric TPM protein present in zebrafish heart. We believe, our finding is consistent with the reported finding that TPM4 is essential for myofibril assembly and heartbeat in zebrafish [Zhao et al. 2008]. Comparison of the αTM1−/− phenotype in mice with the phenotype of cardiac mutant axolotls is instructive for elucidating the mechanisms of αTM1 (TPM1) function in cardiac myofibril assembly in mice. However, it is an oversimplification to state that absence of only αTM1 leads to widespread abnormalities leading to failure of myofibril assembly and a lack of contraction and beating in cardiac mutant axolotl hearts. In mouse hearts, while TPM1α is the major (~95%) component, TPM2α is only ~5% of the total sarcomeric tropomyosin [Rajan et al., 2010]. TPM3α is not expressed in mouse heart [Pieples and Wieczorek, 2000]. As TPM4 gene is truncated, TPM4α is not expressed in rodent hearts [Lees-Miller & Helfman, 1991; Perry 2001]. Hence, it is not surprising that embryonic hearts in TPM1 −/− mice also shows the phenotype [McKeown et al., 2014] mimicking the cardiac mutant axolotl hearts devoid of sarcomeric isoforms encoded by several TPM genes [Lemanski 1973; Zajdel et al., 1998, 2007; Spinner et al., 2002].
Two of our observations deserve special attention. First, we have cloned and sequenced TPM4-2α from zebrafish heart. Our results as depicted in Figure 8 show that the deduced amino acid sequences are exactly same as in the predicted sequences available in the GenBank (XM_005168448) except for four silent mutations as pointed out in Figure 8. This could be due to the difference in the strain of zebrafish. As far as the transcript expression is concerned, TPM4-2α is expressed more in zebrafish heart compared to skeletal muscle (Figure 11). We do not know whether the expression pattern is somewhat different in various stages of development. It is worth mentioning that the expression of TPM4-2α in Fugu fish is primarily in skeletal muscle [Toramoto et al. 2004]. To our defense, we would like to point out that Singh et al. [2016] reported the expression TPM4-2 in bulbus arteriosus of zebrafish. In their study, these researchers using RNA sequencing data generation and subsequent alignment technology showed that Tpm-1 and TPM4b (TPM4-2) are expressed primarily in bulbus arteriosus but not in other heart chambers like atrium and ventricle. Singh et al [2016] using one of the most modern technologies, however, failed to detect the expression of a cardiac specific tropomyosin isoform like TPM4-1α in any of the zebrafish heart chambers, which is puzzling since TPM4-1α has been reported to be an essential tropomyosin isoform for beating zebrafish heart [Zhao et al. 2008].
Our other novel observation is the finding of an alternatively spliced isoform TPM1-2ν of the TPM1-2 gene. As shown in Figures 1B and 5, this novel isoform has exon 1a, 2b, 3, 4, 8, and 9a/b with an open reading frame. Although its mRNA is expressed in skeletal muscle like TPM1-2α, we could not detect a ~24 kD protein in our western blot with CH1 monoclonal antibody the epitope of which is at the C-terminus end encoded by exon 9a. However, when it was ectopically This property may reflect GFP-TPM1-2ν decreased ability to bind to actin filaments in the presence of native tropomyosin competition (Dome et al., 1988), a property it does not share with the zebrafish GFP-TPM1-2α. expressed as a GFP fusion protein in quail myotubes, the fusion protein, unlike TPM1-2α, was mostly diffused in cells with very weak localization in myofibrils (Figure 12 e, g).
One can wonder what other role TPM1-2ν may play in skeletal muscle. TPM1-2ν may somehow control/influence the translation of the sarcomeric isoform TPM1-2α in skeletal muscle. In support, one may argue that, although mRNA level is high, hardly any TPM1-2α protein could be detected in zebrafish skeletal muscle. In order to address this issue, we are planning to create transgenic zebrafish ectopically expressing GFP.TPM1-2ν or GFP.TPM1-2α in skeletal muscle using an expression construct with a zebrafish skeletal muscle-specific promoter.
In summary, this is the first report that reveals the characterization and expression of transcripts of various sarcomeric TPM isoforms like TPM1-1κ, TPM4-2α in striated muscles that has never been done before. Also, our discovery of the new TPM1-2ν isoform and its localization in myotubes by confocal microscopy deserves further investigations. Finally, our 2D Western blot analyses followed by Mass Spectrometric determination of protein expression divulge the sarcomeric TPM protein expression in zebrafish heart and skeletal muscles.
Materials and Methods
RNA isolation from heart and skeletal muscle of adult zebrafish
Zebrafish were obtained from the zebrafish colony of Dr. Joseph Sanger here at the Upstate Medical University. The animals were cooled in ice-cold solution and then killed instantly by decapitation prior to dissecting the heart and skeletal muscle samples for protein and nucleic acid analyses. All operations were carried out following the institutional CHUA guidelines. Specific tissues were dissected and placed in liquid nitrogen. The frozen tissues were homogenized with an RNAase-Free disposable petal (Fischer Scientific) in Tri Reagent included with the Ribo-pure RNA extraction kit (Ambion, Thermo Fischer) following the manufacturer’s instruction. The concentration of the isolated RNA was determined by measuring the absorbance in a spectrophotometer. The quality of RNA was determined by Capillary Electrophoresis using 2100 Bio analyzer, Agilent Technologies. The RIN (RNA Integrity Number) of RNA samples of heart and skeletal muscles are 9.2 and 8.90, respectively, suggesting the RNA we used were of good quality.
Conventional RT-PCR
All pre PCR and post PCR experiments were done by different personnel in different buildings using separate equipment and separate ventilation so as to avoid carryover contamination. For RT-PCR, 0.5 μg of RNA in a total volume of 40μL was used to synthesize cDNA with SuperScriptRII (Life Technologies, Grand Island, NY) and oligo-dT primers following the manufacturer’s specifications. For each PCR 3 μL of cDNA was used and various isoform RNAs were amplified using the isoform specific primer-pairs as previously described [Denz et al., 2011; Thurston et al., 2009]. The nucleotide sequences of the primer-pairs for amplification of various isoforms are given in the legend under each figure. The PCR amplified DNAs were run in an agarose gel and stained with ethidium bromide and was subsequently used for Southern hybridization using an appropriate/isoform specific probe following the method as described earlier [Denz et al., 2011; Thurston et al., 2009]. The nucleotide sequences of the oligonucleotide probe are stated Table 1 and also in the corresponding Figure legend.
In separate experiments, the PCR amplified DNAs were run in an agarose gel and stained with ethidium bromide and the stained bands were excised from the gel. DNA was extracted from the excised bands using a MinElute Gel extraction kit from Qiagen (Valencia, CA) following the manufacturer’s direction. Part of the DNA was used for sequencing and part of the gel extracted DNAs were ligated and cloned into the T/A cloning vector (Life Technologies) following our published protocol [Denz et al., 2011; Thurston et al., 2009]. Positive clones were identified by PCR using the gene-specific as well as isoform specific primer-pairs previously described. Vectors or constructs were grown in E. coli, and the DNA was extracted using Qiagen mini-prep kit (Valencia, CA). The isolated DNA was sequenced (Cornell University Life Science Core Laboratories Center, Ithaca, NY). Each clone was sequenced in both directions.
Real-Time PCR
Real-time quantitative RT-PCR
qRT-PCR analysis of cDNA template was performed using the LightCycler 480 Real-Time PCR System as described before [ Dube et al., 2014; Nan et al., 2015 ] Reactions were carried out in a 384-well plate using the LightCycler 480 SYBR Green I Master kit (Roche). Briefly, each well contained a total volume of 10 μl reaction solution, of which 2 μl was cDNA template and 8 μl was SYBR green mix (5 μl 1 × SYBR green Master mix, 2.8 μl of PCR-grade water, and 0.2 μl of 10 μM primer pair). Primers for real-time PCR for various TPM isoforms are listed in Table 2. In many cases, cDNA was made with an oligonucleotide specific for exon 9a/b that allowed us to make a gene specific cDNA corresponding to the mRNA containing exon 9/b as in various sarcomeric isoforms. We were able to avoid any subsequent PCR amplification of non-sarcomeric TPM isoforms. Amplification in the absence of a cDNA template was also evaluated to insure a lack of signal due to primer dimerization and extension or carryover. Data were analyzed using both relative and absolute quantification methods. Relative quantification of qRT-PCR data was performed using the delta CT (sample CT minus 18S rRNA CT) and delta delta CT (sample delta CT minus comparator delta CT) methods [Livak and Schmittgen, 2001; Pffaffl, 2007; Yuan et al. 2006]. A comparative value was calculated using the formula X−delta delta CT, where “X” equals the efficiency of specific primer pairs. This is similar to the 2−delta delta CT method but corrects for the assumption that the reaction is occurring with 100% efficiency. Efficiencies (E) were determined using dilution series of isoform-specific plasmid clones with respective isoform-specific primers pairs. The LightCycler 480 software plotted the CT at each concentration against the logarithm of the dilutions of the clone, generating a linear regression curve that calculated efficiency based on the formula E =10[−1/slope]. Efficiency of 18S rRNA was determined by serial dilution of zebrafish cDNAs generated with specific primer.
For determination of absolute copy number, optical density was taken of various zebrafish isoform specific clones (for example, TPM1-1α, TPM1-1κ, TPM1-2α, TPM1-2ν, TPM4-1α, TPM4-2α ) separately using a spectrophotometer. The copy number per volume of clone in solution was determined using the equation number of copies = (ng of plasmid DNA × 6.02 X 10²³)/(bp length of plasmid × 1 × 109 × 650), which was simplified by Andrew Staroscik at the URI Genomics and Sequencing Center. A dilution series of each clone was done for 1 × 101–1 × 10⁴ copies of template, which was used to create a standard curve after amplification (Table 3) [Thomas et al., 2010; Thurston et al., 2009]. For better accuracy, each sample in the dilution series was run in triplicate.
Statistical Analyses
The means, standard deviations, and comparative analyses of each data set for statistical significance were done using paired Student’s t-test.
Preparation of YFP Plasmids for transfection
The cDNAs of TPM1-2α and TPM1-2ν were PCR amplified with the following primer-pair:
ZB.YFP.TPM1-2.EcoR1 (+): 5′-TGGAATTCCTATGCCATTAAGAAGAA-3′
ZB.YFP.TPM1-2.Sal1 (−): 5′-TAGTCGACGGTATTGAAGTCATGTCATTGAGAGC-3′.
The amplified DNA was cloned into pYFP-N1 (Clontech) plasmid using the techniques previously described [Sanger et al., 2009; Wang et al., 2005].
Quail cultures, transfection, and imaging
Skeletal myoblasts were isolated from the breast muscles of 9-day old quail embryos and plated on collagen-coated MatTek glass bottom culture dishes (MatTekCorp., Ashland, MA) [Dabiri et al., 1999]. The cells were transfected after 2 days of culture with plasmids encoding YFP-fused tropomyosin isoforms using FuGene HD transfection reagent according to previous methods [Wang et al., 2007, 2008]. Cells intended for immunostaining were fixed, permeabilized and stained with anti-alpha-actinin antibody, Alexa Fluor594 secondary antibody. Fluorescence images were acquired on a Leica SP5 confocal microscope.
2D (Two-dimensional) Western blot analyses
Two-dimensional western blot analyses of the extracts of heart and skeletal muscle of adult zebrafish were performed for us by Kendrick Labs, Inc. (Madison, WI). Zebrafish were obtained from the zebrafish colony of Dr. Joseph Sanger at Upstate Medical University. The frozen heart and skeletal muscle tissues were lysed in 150–350 μl of osmotic lysis buffer (containing 10× nuclease stock, phosphatase inhibitor stocks [I and II], and protease inhibitor stock) and 50–150 μl of SDS boiling buffer without reducing agents. The samples were homogenized with a micropipette, pulled through a small bore needle, and heated in a boiling water bath for five minutes. The protein concentrations of the samples were determined using the BCA Assay [Smith et. al., 1985 and Pierce Chemical Co., Rockford, IL]. Samples were then lyophilized and redissolved as indicated in 1:1 diluted SDS Boiling Buffer: Urea sample Buffer with reducing agents before loading. Gel loading and sample preparation are given in Table 4. The Coomassie blue-stained PVDF membrane was desktop scanned, destained in 100% methanol, rinsed briefly in Tween-20 tris buffered saline (TTBS), and blocked for two hours in 5% non fat dry milk (NFDM) in TTBS. The blot was incubated in primary antibody (anti Tropomyosin-Clone CH1 [Developmental Studies Hybridoma Bank] diluted 1:10,000 in 2% NFDM TTBS) overnight and rinsed 3 × 10 minutes in TTBS. The blot was placed in secondary antibody (anti-mouse IgG-HRP [GE Healthcare, Cat # NA931V, Lot # 9621358] diluted 1:2,000 in 2% NFDM TTBS) for two hours, rinsed as above, treated with ECL, and exposed to x-ray film. The developed x-ray film when superimposed on the coomassie stained protein gel, 6 spots were exhibited (as in Figure 13). The gel spots were excised, washed, and trypsinized following the published protocols [Shevchenko et al. 1996; Darie et al., 2011; Sokolowska et al., 2012]. The resulting peptides were extracted twice with 5% formic acid/50 mM ammonium bicarbonate/50% acetonitrile and once with 100% acetonitrile under moderate shaking. The peptide mixture was then dried in a speed-vac, solubilized in 20μL of 0.1% formic acid/2% acetonitrile.
Table 4.
Table 1. Key to 2D Gel Loading and Sample Preparation.
| Gel ID # | Sample | μl loaded | μg loaded | Treatment | BCA Total μg |
|---|---|---|---|---|---|
| 2938 #1 | Skeletal muscle from zebrafish | 50 | 200 | Coomassie | 6,410 |
| 2938 #2 | Skeletal muscle from zebrafish | 50 | 200 | Anti-Tropomyosin | |
| 2938 #3 | Heart from zebrafish | 50 | 165 | Coomassie | 330 |
| 2938 #4 | Heart from zebrafish | 50 | 165 | Anti-Tropomyosin |
LC-MS/MS
The peptides mixture was analyzed by reverse phase liquid chromatography (LC) and MS (LC-MS/MS) using a NanoAcuity UPLC (Micromass/Waters, Milford, MA) coupled to a Q-TOF Ultima API MS (Micromass/Waters, Milford, MA), according to published procedures [Darie et al., 2011; Sokolowska et al., 2012; Shevchenko et al., 1996]. Briefly, the peptides were loaded onto a 100 μm × 10 mm NanoAquity BEH130 C18 1.7 μm UPLC column (Waters, Milford, MA) and eluted over a 150 minute gradient of 2–80% organic solvent (ACN containing 0.1% FA) at a flow rate of 400 nL/min. The aqueous solvent was 0.1% FA in HPLC water. The column was coupled to a Picotip Emitter Silicatip nano-electrospray needle (New Objective, Woburn, MA). MS data acquisition involved survey MS scans and automatic data dependent analysis (DDA) of the top three ions with the highest intensity ions with the charge of 2+, 3+ or 4+ ions. The LC-MS/MS was triggered when the MS signal intensity exceeded 10 counts/second. In survey MS scans, the three most intense peaks were selected for collision-induced dissociation (CID) and fragmented until the total LC-MS/MS ion counts reached 10,000 or for up to 6 seconds each. The entire procedure used was previously described. Calibration was performed for both precursor and product ions using 1 pmol GluFib (Glu1-Fibrinopeptide B) standard peptide with the sequence EGVNDNEEGFFSAR and the monoisotopic doubly-charged peak with m/z of 785.84.
Data processing and protein identification
The raw data were processed using ProteinLynx Global Server (PLGS, version 2.4) software as previously described by Darie et al [2011].
Acknowledgments
The project was supported by Grant Number AR-57063 from NIAMS/NIH (JMS and JWS). Funds were also granted from HLB/NIH (HL-080426. JMS and JWS). JWS is also indebted to the Hendricks Fund for support of this work. The work was supported by a grant from the Department of Medicine and Barbara Kopp Cancer Research Fund to BJP and a funding from College of Health Professionals, Upstate Medical University to DKD.
References
- Amores A, Force A, Yan YL, Joly L, Amemiya C, Fritz A, Ho RK, Langeland J, Prince V, Wang YL, et al. Zebrafish hox clusters and vertebrate genome evolution. Science. 1998;282:1711–1714. doi: 10.1126/science.282.5394.1711. [DOI] [PubMed] [Google Scholar]
- Blanchard EM, Iizuka K, Christe M, Conner DA, Geisterfer-Lowrance A, Schoen FJ, Maughan DW, Seidman CE, Seidman JG. Targeted ablation of the murine alpha-tropomyosin gene. Circ Res. 1997;81:1005–1010. doi: 10.1161/01.res.81.6.1005. [DOI] [PubMed] [Google Scholar]
- Dabiri GA, Ayoob JC, Turnacioglu KK, Sanger JM, Sanger JW. Use of green fluorescent proteins linked to cytoskeletal proteins to analyze myofibrillogenesis in living cells. Methods Enzymol. 1999;302:171–86. doi: 10.1016/s0076-6879(99)02017-0. [DOI] [PubMed] [Google Scholar]
- Darie CC, Deinhardt K, Zhang G, Cardasis HS, Chao MV, Neubert TA. Identifying transient protein-protein interactions in EphB2 signaling by blue native PAGE and mass spectrometry. Proteomics. 2011;11:4514–4528. doi: 10.1002/pmic.201000819. [DOI] [PMC free article] [PubMed] [Google Scholar]
- Denz CR, Narshi A, Zajdel RW, Dube DK. Expression of a novel cardiac-specific tropomyosin isoform in humans. Bioch Biophys Res Commun. 2004;320:1291–1297. doi: 10.1016/j.bbrc.2004.06.084. [DOI] [PubMed] [Google Scholar]
- Denz CR, Zhang C, Jia P, Du J, Huang X, Dube S, Thomas A, Poiesz BJ, Dube DK. Absence of mutation at the 5′-upstream promoter region of the TPM4 gene from cardiac mutant axolotl (Ambystoma mexicanum) Cardiovasc Toxicol. 2011;11:235–243. doi: 10.1007/s12012-011-9117-z. [DOI] [PubMed] [Google Scholar]
- Dome JS, Mittal B, Pochapin MB, Sanger JM, Sanger JW. Incorporation of fluorescently labeled actin and tropomyosin into muscle cells. Cell Diff. 1988;23:37–52. doi: 10.1016/0045-6039(88)90035-8. [DOI] [PubMed] [Google Scholar]
- Dube DK, Dube S, Abbott L, Alshiekh-Nasany R, Mitschow C, Poiesz BJ. Cloning, Sequencing, and the Expression of the Elusive Sarcomeric TPM4α Isoform in Humans. Mol Biol Int. 2016;2016:3105478. doi: 10.1155/2016/3105478. [DOI] [PMC free article] [PubMed] [Google Scholar]
- Dube DK, McLean MD, Dube S, Poiesz BJ. Translational Control of Tropomyosin Expression in Vertebrate Hearts. The Anatomical Record. 2014;297:1585–1595. doi: 10.1002/ar.22978. [DOI] [PubMed] [Google Scholar]
- Fleenor DE, Hickman KH, Lindquester GJ, Devlin RB. Avian cardiac tropomyosin gene produces tissue-specific isoforms through alternative RNA splicing. J Muscle Res Cell Motil. 1992;13:55–63. doi: 10.1007/BF01738428. [DOI] [PubMed] [Google Scholar]
- Forry-Schaudies S, Maihle NJ, Hughes HS. Chicken cardiac tropomyosin and a low-molecular-weight nonmuscle tropomyosin arerelated by alternative splicing. Cell Growth Differ. 1990;1:473–481. [PubMed] [Google Scholar]
- Gunning P, O’Neill G, Hardeman E. Tropomyosin based regulation of the actin cytoskeleton in time and space. Physiological Reviews. 2008;88:1–35. doi: 10.1152/physrev.00001.2007. [DOI] [PubMed] [Google Scholar]
- Hardy S, Theze N, Lepetit D, Allo MR, Thiebaud P. The Xenopus laevis TM-4 gene encodes non-muscle and cardiac tropomyosin isoforms through alternative splicing. Gene. 1995;156:265–270. doi: 10.1016/0378-1119(94)00929-m. [DOI] [PubMed] [Google Scholar]
- Ikeda D, Toramoto T, Ochiai Y, Suetake H, Suzuki Y, Minoshima S, Shimizu N, Watabe S. Identification of novel tropomyosin 1 genes of pufferfish (Fugu rubripes) on genomic sequences and tissue distribution of their transcripts. Molecular Biology Reports. 2003;30:83–90. doi: 10.1023/a:1023995208279. [DOI] [PubMed] [Google Scholar]
- Lees-Miller JP, Helfman DM. The molecular basis for tropomyosin diversity. Bioessays. 1991;13:429–437. doi: 10.1002/bies.950130902. [DOI] [PubMed] [Google Scholar]
- Lemanski LF. Role of tropomyosin in actin filament formation in embryonic salamander heart cells. J Cell Biol. 1979;82:227–238. doi: 10.1083/jcb.82.1.227. [DOI] [PMC free article] [PubMed] [Google Scholar]
- Livak KJ, Schmittgen TD. Analysis of relative gene expression data using real-time quantitative PCR and 2-δδCT method. Methods. 2001;25:402–408. doi: 10.1006/meth.2001.1262. [DOI] [PubMed] [Google Scholar]
- Marston SB, Copeland O, Messer AE, MacNamara E, Nowak K, Zampronio CG, Ward DG. Tropomyosin isoform expression and phosphorylation in the human heart in health and disease. J Muscle Res Cell Motil. 2013;34:189–197. doi: 10.1007/s10974-013-9347-8. [DOI] [PubMed] [Google Scholar]
- McKeown CR, Nowak RB, Gokhin DS, Fowler VM. Tropomyosin is required for cardiac morphogenesis, myofibril assembly, and formation of adherens junctions in the developing mouse embryo. Developmental Dynamics. 2014;243:800–817. doi: 10.1002/dvdy.24115. [DOI] [PMC free article] [PubMed] [Google Scholar]
- McLean MD, Zajdel RW, Dube S, Thurston H, Dube DK. Tropomodulin expression in developing hearts of normal and cardiac mutant Mexican axolotl. Cardiovasc Toxicol. 2006;6:85–98. doi: 10.1385/ct:6:2:85. [DOI] [PubMed] [Google Scholar]
- Nan C, Dube S, Matoq A, Mikesell L, Abbott L, Alshiekh-Nasany R, Chionuma H, Huang X, Poiesz BJ, Dube DK. Expression of sarcomeric tropomyosin in striated muscles in axolotl treated with shz-1, a small cardiogenic molecule. Cardiovascular Toxicology. 2015;15:29–40. doi: 10.1007/s12012-014-9265-z. [DOI] [PubMed] [Google Scholar]
- Perry SV. Vertebrate tropomyosin: distribution, properties and function. J Muscle Res Cell Motil. 2001;22:5–49. doi: 10.1023/a:1010303732441. [DOI] [PubMed] [Google Scholar]
- Pffaffl MW. A new mathematical model for relative quantification in realtime RT-PCR. Nucleic Acids Research. 2001;25:402–408. doi: 10.1093/nar/29.9.e45. [DOI] [PMC free article] [PubMed] [Google Scholar]
- Pieples K, Wieczorek DF. Tropomyosin 3 increases striated muscle isoform diversity. Biochemistry. 2000;39:8291–8297. doi: 10.1021/bi000047x. [DOI] [PubMed] [Google Scholar]
- Pittenger MF, Kazzaz JA, Helfman DM. Functional properties of non-muscle tropomyosin isoforms. Current Opinion in Cell Biology. 1994;6:96–104. doi: 10.1016/0955-0674(94)90122-8. [DOI] [PubMed] [Google Scholar]
- Rajan S, Jagatheesan G, Karam CN, Alves ML, Bodi I, Schwartz A, Bulcao CF, D’Souza KM, Akhter SA, Boivin GP, et al. Molecular and functional characterization of a novel cardiac-specific human tropomyosin isoform. Circulation. 2010;121:410–418. doi: 10.1161/CIRCULATIONAHA.109.889725. [DOI] [PMC free article] [PubMed] [Google Scholar]
- Rethinasamy P, Muthuchamy M, Hewett T, Boivin G, Wolska BM, Evans C, Solaro RJ, Wieczorek DF. Molecular and physiological effects of alpha-tropomyosin ablation in the mouse. Circ Res. 1998;82:116–123. doi: 10.1161/01.res.82.1.116. [DOI] [PubMed] [Google Scholar]
- Sanger JW, Wang J, Holloway B, Du A, Sanger JM. Myofibrillogenesis in skeletal muscle cells in zebrafish. Cell Motility and the Cytoskeleton. 2009;66:556–566. doi: 10.1002/cm.20365. [DOI] [PMC free article] [PubMed] [Google Scholar]
- Sanger JW, Wang J, Fan Y, White J, Mi-Mi Lei, Dube DK, Sanger JM, Pruyne D. Assembly and maintenance of myofibrils in living muscle cells. In: Jocksuch B, editor. The Actin Cytoskeleton. Vol. 235. Springer Verlag; 2017. Handbook of Experimental Pharmacology. (in press) [DOI] [PubMed] [Google Scholar]
- Schevzov G, Whittaker SP, Fath T, Lin JJ, Gunning PW. Tropomyosin isoforms and reagents. Bioarchitecture. 2011;1:135–164. doi: 10.4161/bioa.1.4.17897. [DOI] [PMC free article] [PubMed] [Google Scholar]
- Shevchenko A, Wilm M, Vorm O, Mann M. Mass spectrometric sequencing of proteins silver-stained polyacrylamide gels. Anal Chem. 1996;68:850–858. doi: 10.1021/ac950914h. [DOI] [PubMed] [Google Scholar]
- Singh AM, Sivdas A, Sabharwal A, Vellarikal SK, Jayarajan R, Verma A, Kapoor S, Joshi A, Scaria V, Sivasubbu S. Chamber specific gene expression landscape of zebrafish heart. PLoS ONE. 2016;11:e0147823. doi: 10.1371/journal.pone.0147823. doi:10.1371. [DOI] [PMC free article] [PubMed] [Google Scholar]
- Smith PK, Krohn RI, Hermanson GT, Mallia AK, Gartner FH, Provenzano MD, Fujimoto EK, Goeke NM, Olson BJ, Klenk DC. Measurement of protein using bicinchoninic acid. Anal Biochem. 1985;150:76–85. doi: 10.1016/0003-2697(85)90442-7. [DOI] [PubMed] [Google Scholar]
- Sokolowska I, Dorobantu C, Woods AG, Macovei A, Branza-Nichita N, Darie CC. Proteomic analysis of plasma membranes isolated from undifferentiated and differentiated HepaRG cells. Proteome Sci. 2012;10:47. doi: 10.1186/1477-5956-10-47. [DOI] [PMC free article] [PubMed] [Google Scholar]
- Spinner BJ, Zajdel RW, McLean MD, Denz CR, Dube S, Mehta S, Choudhury A, Nakatsugawa M, Dobbins N, Lemanski LF, et al. Characterization of a TM-4 type tropomyosin that is essential for myofibrillogenesis and contractile activity in embryonic hearts of the Mexican axolotl. J Cell Biochem. 2002;85:747–761. doi: 10.1002/jcb.10178. [DOI] [PubMed] [Google Scholar]
- Toramoto T, Ikeda D, Ochiaia Y, Minoshima S, Shimizu N, Watabe S. Multiple gene organization of pufferfish Fugu rubripes tropomyosin isoforms and tissue distribution of their transcripts. Gene. 2004;331:41–51. doi: 10.1016/j.gene.2004.01.013. [DOI] [PubMed] [Google Scholar]
- Thomas A, Rajan S, Thurston HL, Masineni SN, Dube P, Bose A, Muthu V, Dube S, Wieczorek DF, Dube DK. Expression of a novel tropomyosin isoform in axolotl heart and skeletal muscle. J Cell Biochem. 2010;110:875–881. doi: 10.1002/jcb.22599. [DOI] [PMC free article] [PubMed] [Google Scholar]
- Thurston HL, Prayaga S, Thomas A, Guharoy V, Dube S, Poiesz BJ, Dube DK. Expression of Nkx2.5 in wild type, cardiac mutant, and thyroxine-induced metamorphosed hearts of the Mexican axolotl. CardiovasToxicol. 2009;9:13–20. doi: 10.1007/s12012-009-9030-x. [DOI] [PubMed] [Google Scholar]
- Wang J, Fan Y, Dube DK, Sanger JM, Sanger JW. Jasplakinolide reduces actin and tropomyosin dynamics during myofibrillogenesis. Cytoskeleton (Hoboken) 2014;71:513–29. doi: 10.1002/cm.21189. [DOI] [PMC free article] [PubMed] [Google Scholar]
- Wang J, Sanger JM, Kang S, Thurston H, Abbott LZ, Dube DK, Sanger JW. Ectopic expression and dynamics of TPM1alpha and TPM1kappa in myofibrils of avian myotubes. Cell Motil Cytoskeleton. 2007;64:767–76. doi: 10.1002/cm.20221. [DOI] [PubMed] [Google Scholar]
- Wang J, Sanger JM, Sanger JW. Differential effects of latrunculin- A on myofibrils in cultures of skeletal muscle cells: insights into mechanisms of myofibrillogenesis. Cell Motil Cytoskeleton. 2005;62:35–47. doi: 10.1002/cm.20083. [DOI] [PMC free article] [PubMed] [Google Scholar]
- White J, Barro MV, Makarenkova HP, Sanger JW, Sanger JM. Localization of sarcomeric proteins during myofibril assembly in cultured mouse primary skeletal myotubes. Anat Rec (Hoboken) 2014;297:1571–84. doi: 10.1002/ar.22981. [DOI] [PMC free article] [PubMed] [Google Scholar]
- Wieczorek DF. Regulation of alternatively spliced α-tropomyosin gene expression by nerve extract. Journal of Biological Chemistry. 1988;263:10456–10463. [PubMed] [Google Scholar]
- Yuan JS, Reed A, Chen F, Stewart CN. Statistical analysis of real-time PCR data. BMC Bioinformatics. 2006;7:85–101. doi: 10.1186/1471-2105-7-85. [DOI] [PMC free article] [PubMed] [Google Scholar]
- Zajdel RW, McLean MD, Lemanski SL, Muthuchamy M, Wieczorek DF, Lemanski LF, Dube DK. Ectopic expression of tropomyosin promotes myofibrillogenesis in mutant axolotl hearts. Dev Dyn. 1998;213:412–420. doi: 10.1002/(SICI)1097-0177(199812)213:4<412::AID-AJA6>3.0.CO;2-C. [DOI] [PubMed] [Google Scholar]
- Zajdel RW, Dube DK, Lemanski LF. The cardiac mutant Mexican axolotl is a unique animal model for evaluation of cardiac myofibrillogenesis. Exp Cell Res. 1999;248:557–566. doi: 10.1006/excr.1999.4419. [DOI] [PubMed] [Google Scholar]
- Zajdel RW, Denz CR, Lee S, Dube S, Ehler E, Perriard E, Perriard JC, Dube DK. Identification, characterization, and expression of a novel alpha-tropomyosin isoform in cardiac tissues in developing chicken. J Cell Biochem. 2003;89:427–39. doi: 10.1002/jcb.10504. [DOI] [PubMed] [Google Scholar]
- Zajdel RW, Thurston H, Prayaga S, Dube S, Poiesz BJ, Dube DK. A reduction of tropomyosin limits development of sarcomeric structures in cardiac mutant hearts of the Mexican axolotl. Cardiovasc Toxicol. 2007;7:235–246. doi: 10.1007/s12012-007-9000-0. [DOI] [PubMed] [Google Scholar]
- Zeece MG, Robson RM, Bechtel PJ. Interaction of alphaactinin, filamin and tropomyosin with F-actin. Biochim Biophys Acta. 1979;581:365–370. doi: 10.1016/0005-2795(79)90258-7. [DOI] [PubMed] [Google Scholar]
- Zhao L, Zhao X, Tian T, Lu Q, Skrbo-Larssen N, Wu D, Kuang Z, Zheng X, Han Y, Yang S, et al. Heart-specific isoform of tropomyosin 4 is essential for heartbeat in zebrafish embryos. Cardiovasc Res. 2008;80:200–208. doi: 10.1093/cvr/cvn177. [DOI] [PubMed] [Google Scholar]


