

Abstract
Purpose
To evaluate Arg‐Gly‐Asp (RGD)‐conjugated human ferritin (HFn) iron oxide nanoparticles for in vivo magnetic resonance imaging (MRI) of vascular inflammation and angiogenesis in experimental carotid disease and abdominal aortic aneurysm (AAA).
Materials and Methods
HFn was genetically engineered to express the RGD peptide and Fe3O4 nanoparticles were chemically synthesized inside the engineered HFn (RGD‐HFn). Macrophage‐rich left carotid lesions were induced by ligation in FVB mice made hyperlipidemic and diabetic (n = 14), with the contralateral right carotid serving as control. Murine AAAs were created by continuous angiotensin II infusion in ApoE‐deficient mice (n = 12), while control mice underwent saline infusion (n = 8). All mice were imaged before and after intravenous injection with either RGD‐HFn‐Fe3O4 or HFn‐Fe3O4 using a gradient‐echo sequence on a whole‐body 3T clinical scanner, followed by histological analysis. The nanoparticle accumulation was assessed by the extent of ‐induced carotid lumen reduction (% lumen loss) or aortic ‐weighted signal intensity reduction (% SI [signal intensity] loss).
Results
RGD‐HFn‐Fe3O4 was taken up more than HFn‐Fe3O4 in both the ligated left carotid arteries (% lumen loss; 69 ± 9% vs. 36 ± 7%, P = 0.01) and AAAs (% SI loss; 47 ± 6% vs. 20 ± 5%, P = 0.01). The AAA % SI loss correlated positively with AAA size (r = 0.89, P < 0.001). Histology confirmed the greater accumulation and colocalization of RGD‐HFn‐Fe3O4 to both vascular macrophages and endothelial cells.
Conclusion
RGD‐HFn‐Fe3O4 enhances in vivo MRI by targeting both vascular inflammation and angiogenesis, and provides a promising translatable MRI approach to detect high‐risk atherosclerotic and aneurysmal vascular diseases.
Level of Evidence: 1
J. Magn. Reson. Imaging 2017;45:1144–1153
Keywords: RGD, iron, nanoparticles, angiogenesis, atherosclerosis, aneurysms
Vascular inflammation and angiogenesis have been found to be key contributors to vascular diseases, including atherosclerosis and abdominal aortic aneurysm (AAA). Macrophages play a key role in vascular inflammation, producing proteases such as matrix metalloproteinases that can degrade the extracellular matrix of the vessel wall, contributing to the development, expansion, and rupture of both atherosclerotic plaques1 and AAAs.2, 3 Vascular angiogenesis has also been reported to be associated with atherosclerotic plaque growth and rupture.4 For AAAs, preclinical and clinical studies demonstrate the significant association of mural neovascularization with aneurysm progression and rupture.5, 6, 7, 8 Therefore, both vascular macrophage infiltration and neoangiogenesis represent biological markers for targeted imaging and potential therapy of these vascular diseases.
The αvβ3 integrin, a cell surface glycoprotein receptor, is well known as an indicator of vascular angiogenesis, being upregulated on neovessel endothelial cells.9 It has also been shown that atherosclerotic macrophages express high levels of αvβ3 integrin.10 Arg‐Gly‐Asp (RGD) is an extensively studied short peptide that binds to the αvβ3 integrin.11 Thus, αvβ3 integrin‐targeted imaging using RGD is expected to detect vascular inflammation in addition to angiogenesis.
Previously, we introduced engineered human ferritin protein‐cage nanoparticles as fluorescence imaging and magnetic resonance imaging (MRI) agents for detecting vascular macrophages in murine carotid arteries.12 As protein cages are genetically encoded materials, a cell‐targeting peptide such as RGD can be added to these nanoparticles using well‐established genetic engineering techniques.13 We have previously developed a human ferritin mutant bearing RGD peptide on its exterior surface and demonstrated the targeting abilities of the RGD‐conjugated ferritin nanoparticles toward macrophages and angiogenic endothelial cells in vitro and in murine carotid and AAA disease using fluorescence techniques.14, 15
In contrast to fluorescence, MRI offers a more clinically translatable imaging modality; plus, MRI can provide excellent complementary information on the vessel lumen and vessel wall tissue characteristics.16, 17 Ferritin also has advantages for clinical translation, as it is a naturally occurring human circulating protein.
The purpose of this study was to evaluate the potential of RGD‐conjugated human ferritin iron oxide nanoparticles for in vivo MRI to assess vascular inflammation and angiogenesis in murine carotid arteries and AAAs.
Materials and Methods
Animal Preparation
All animal procedures were approved by the Administrative Panel on Laboratory Animal Care. All animals were anesthetized with inhaled 2% isoflurane for surgical and imaging procedures and recovered with free access to food and water.
Carotid
Macrophage‐rich carotid lesions were induced in a total of 14 FVB/NJ mice as described previously.12, 18 In brief, after 8‐week‐old male mice were fed a high‐fat diet for 4 weeks and rendered diabetic by administration of five daily intraperitoneal injections of streptozotocin, the left common carotid artery was ligated below the bifurcation to develop macrophage‐rich neointimal proliferation. The nonligated right common carotid artery served as a control.
AAA
Murine AAAs were induced in apolipoprotein E‐deficient (apo‐E–/–) mice, as described previously.6, 19 A total of 20 male mice, 14 to 18 weeks of age, were studied after continuous angiotensin II infusion via subcutaneous implanted osmotic mini‐pumps (n = 12) or after receiving mini‐pumps loaded with saline alone (n = 8). Transabdominal 40 MHz B‐mode ultrasound (US) imaging (Vevo 770 Imaging System and RMV 704 microvisualization scan head, Visualsonics, Toronto, Canada) was performed to monitor aortic diameter in vivo (in the longitudinal and transverse scan plane) for up to 21 days, as previously described,6 with >25% diameter increase from baseline (1.0‐1.2 mm) defined as AAA.
Nanoparticle Preparation
Ferritin is composed of 24 subunits which self‐assemble to form a cage‐like protein of 12 nm exterior diameter with an 8 nm diameter interior cavity. As previously described,13, 20 the recombinant human heavy‐chain ferritin (HFn) protein cage was heterologously expressed and purified from E. coli. The RGD‐4C peptide (CDCRGDCFC) was genetically introduced as a fusion to the N‐terminus of HFn subunit, so that 24 copies of the RGD‐4C peptides were displayed on the exterior surface of the protein cage. By transmission electron microscopy and dynamic light scattering analyses, both RGD‐4C peptide conjugated HFn (RGD‐HFn) and HFn are similar in both size and morphology.13 In the present study, we chemically modified the targeted (RGD‐HFn) and nontargeted (HFn) nanoparticles to be MRI agents, as described previously.20 In brief, magnetite (Fe3O4) was synthesized in the interior cavities of RGD‐HFn and HFn at loading factors of 5000Fe per cage (magnetite diameter: 5–7 nm, exterior diameter: 12 nm), giving R2 relaxivity of 93 mM–1s–1 at 1.5T, which was comparable to that of ultrasmall superparamagnetic iron oxide (USPIO) contrast agents.20 The injected dose was adjusted to 25 mg/kg of Fe in each animal, resulting in 1.35–1.38 mg protein cage per animal.
In Vivo MRI
Noninvasive in vivo MRI of RGD‐HFn‐Fe3O4 and HFn‐Fe3O4 was performed on a whole‐body 3T MRI scanner (Signa HDx, GE Healthcare, Milwaukee, WI) with installed gradients (50 mT/m, 150 T/m/s) and a phased array mouse coil (RAPID MR International, Columbus, OH). To detect the effects of the iron oxide nanoparticles, bright‐blood images were acquired using a gradient echo sequence (repetition time / echo time [TR/TE] = 100/10 msec, slice thickness = 1.0 mm, field of view [FOV] = 3 cm, matrix = 256 × 256, flip angle [FA] = 60, number of excitations [NEX] = 10).
Carotid
At 14 days after carotid ligation, mice were scanned to acquire the preinjection images, then injected intravenously with either RGD‐HFn‐Fe3O4 (RGD+ group, n = 7) or HFn‐Fe3O4 (RGD– group, n = 7), followed by serial MRI at 24 and 48 hours postinjection. The scans were performed through the transverse plane of the carotid arteries, encompassing six consecutive axial slices located above and including the top of the aortic arch as a landmark to match serial scans.
AAA
At 14‐21 days after mini‐pump implantation, AAA and control mice were scanned for the preinjection images. Then AAA mice were injected intravenously with either RGD‐HFn‐Fe3O4 (AAA RGD+ group, n = 6) or HFn‐Fe3O4 (AAA RGD– group, n = 6), followed by serial MRI at 24 and 48 hours postinjection. Control mice were also injected with RGD‐HFn‐Fe3O4 (control aorta RGD+ group, n = 4) or HFn‐Fe3O4 (control aorta RGD– group, n = 4), followed by MRI. The scans were performed through the transverse plane of the abdominal aorta, encompassing 12 consecutive axial slices located above and including the right renal artery as a landmark to match serial scans.
Image Analysis
Carotid
The nanoparticle accumulation in the carotid wall was assessed by manual tracing to measure the ‐induced signal loss on the carotid lumen images, as described previously.12, 21 Specifically, the percent reduction in carotid lumen size postinjection was measured at the slice just above the top of the aortic arch:
AAA
The angiotensin II‐induced murine AAA lesions are typically suprarenal and can involve aortic dissection.22 Thus, to assess the nanoparticle accumulation in the AAA lesion comprehensively, the relative ‐weighted signal intensity (SI) loss of the aortic area was used, as reported previously.23 Regions of interest (ROIs) were traced manually around the most aneurysmal segment of the suprarenal aorta as well as an unaffected normal infrarenal aortic segment. This allowed normalizing the AAA SI to the SI of normal aorta. The percent reduction in the normalized AAA SI was measured:
Additionally, the largest area of the suprarenal aorta was measured in AAA and control mice on the preinjection MRI.
Histology
Carotid arteries and aortic segments were cut into two 3‐mm sections. These sections were embedded immediately in optimum cutting temperature (OCT) compound (Sakura Finetek USA, Torrance, CA) and flash‐frozen in liquid nitrogen. Five‐μm frozen sections corresponding to the slices analyzed on MRI (carotid arteries just above the top of the aortic arch or most aneurysmal segments of the suprarenal aortae) were used for the following staining procedures. For Perl's iron staining to confirm the localization of RGD‐HFn‐Fe3O4 or HFn‐Fe3O4, frozen sections were fixed in formalin for 1 hour, washed in distilled water, and then immersed in the mixed solution of 5% potassium ferrocyanide and 5% hydrochloric acid for 30 minutes. The sections were counterstained with nuclear fast red. For immunohistochemistry, frozen sections were fixed in acetone for 10 minutes, washed in phosphate‐buffered saline, and then incubated overnight at 4°C with antimouse Mac‐3 (carotid) or CD‐11b (AAA) antibody to stain for macrophages (BD Biosciences, San Jose, CA) or antimouse CD‐31 antibody to stain for endothelial cells (BD Biosciences, San Jose, CA). Sections were then incubated for 30 minutes at room temperature with biotinylated secondary antibodies. Antigen‐antibody conjugates were detected with avidin‐biotin‐horseradish‐peroxidase complex (Vector Laboratories, Burlingame, CA) according to the manufacturer's instructions; 3‐amino‐9‐ethylcarbazole was used as chromogen. Sections were counterstained with hematoxylin.
To quantify the uptake of RGD‐HFn‐Fe3O4 or HFn‐Fe3O4, Perl's iron‐stained individual cells were counted (original magnification ×200 for carotid and ×100 for aorta) per cross‐sectional area (CSA) in five sections of each group. Additionally, Perl's iron staining and immunohistochemistry were compared to examine colocalization of the iron oxide nanoparticles with macrophages and endothelial cells.
Statistics
All data are expressed as mean ± SEM (standard error of the mean). A paired Student's t‐test was used to compare ligated left carotid vs. nonligated right carotid arteries and to compare MRI measurements for pre‐ vs. postinjection timepoint. An unpaired t‐test was used to compare AAA vs. saline‐infused control mice and to compare RGD+ and RGD– groups. The Pearson coefficient was used to calculate the correlation between aortic size parameters (diameter and area) and % SI loss, as well as between histological quantification of the nanoparticle uptake and % lumen loss or % SI loss. All analyses were performed using JMP 7.0.1 statistical software (SAS Institute, Cary, NC). P < 0.05 was considered statistically significant.
Results
In Vivo MRI After Administration of RGD‐HFn‐Fe3O4 or HFn‐Fe3O4
Carotid
MRI prior to the nanoparticle administration showed the ligated left carotid artery, as expected, was smaller than the nonligated right carotid artery (Fig. 1A, Pre). Post‐nanoparticle injection, MRI images of both RGD+ and RGD– groups showed a reduction in lumen size of the ligated left carotid arteries due to signal loss at 24 and 48 hours (Fig. 1A, 24 and 48 hr), confirmed by the quantitative measurement of the % lumen loss (Fig. 1B). The % lumen loss of the ligated left carotid arteries was significantly greater in the RGD+ than in the RGD– group (Fig. 1B; 24 hr: 57 ± 6% vs. 30 ± 8%, P = 0.02; 48 hr: 69 ± 9% vs. 36 ± 7%, P = 0.01). The % lumen loss of the ligated left carotid arteries tended to increase from 24 to 48 hours, but the difference between 24 and 48 hours did not reach statistical significance in either RGD+ (P = 0.15) or RGD– (P = 0.10) group. In the control (nonligated) right carotid arteries, luminal area reduction was not seen (Fig. 1A) and the % lumen loss was not significant in the RGD+ or RGD– group (Fig. 1B).
Figure 1.
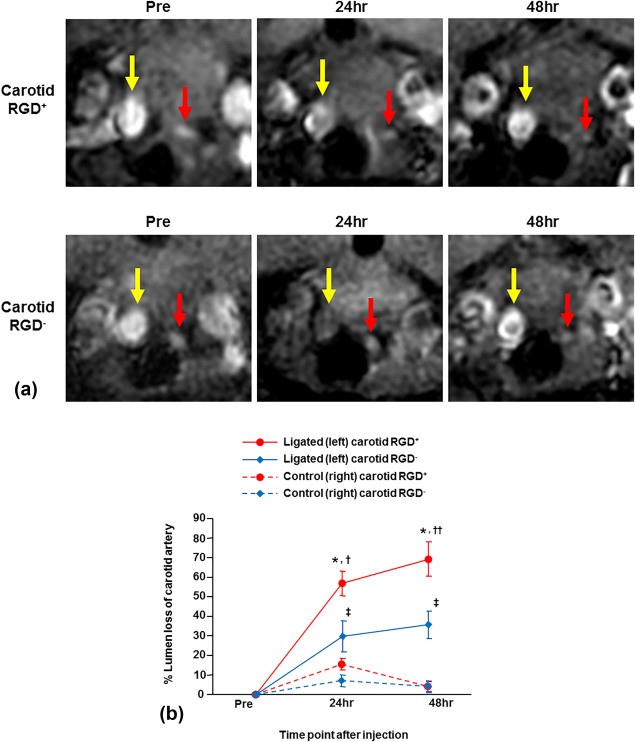
Serial in vivo MRI of carotid arteries with RGD‐HFn‐Fe3O4 or HFn‐Fe3O4. A: The ligated left carotid arteries (red arrows) were smaller than the nonligated right carotid arteries (yellow arrows) prior to RGD‐HFn‐Fe3O4 or HFn‐Fe3O4 injection (Pre). After the injection, signal loss of the ligated left carotid artery was seen at 24 and 48 hours in both RGD+ and RGD– mice, but was greater in RGD+ mice. Luminal area reduction was not seen in the control (nonligated) right carotid artery in either group. B: By quantitative analysis, the ligated left carotid artery showed significant percent reduction in lumen area (% lumen loss) at 24 and 48 hours in both RGD+ and RGD– groups, but the % lumen loss of RGD+ group was significantly greater. The control right carotid artery showed minimal % lumen loss in both groups. *P < 0.001 vs. Pre, P < 0.001 vs. right carotid, †P = 0.02 vs. RGD– group, ††P = 0.01 vs. RGD– group, ‡P < 0.05 vs. Pre, P < 0.05 vs. right carotid.
AAA
For both the RGD+ and RGD– groups, the US‐determined AAA diameters obtained just prior to MRI were similar (1.83 ± 0.10 mm vs. 1.75 ± 0.10 mm, P = 0.59). MRI prior to the nanoparticle administration clearly visualized the aneurysmal site in the suprarenal aortic segment (Fig. 2A, AAA Pre), and the area of the most aneurysmal suprarenal aorta measured on preinjection MRI was also similar between groups (4.01 ± 0.33 mm2 vs. 3.78 ± 0.15 mm2, P = 0.53). Post‐nanoparticle injection, the AAA signal decreased more in the RGD+ group compared to the RGD– group (Fig. 2A, AAA 24 and 48 hr). Quantitative analysis showed significant AAA % SI loss at 24 and 48 hours in both groups, but the % SI loss was significantly greater in the RGD+ than in the RGD– group (Fig. 2B; 24 hr: 40 ± 7% vs. 19 ± 6%, P = 0.04; 48 hr: 47 ± 6% vs. 20 ± 5%, P = 0.01). The % SI loss of AAA tended to increase from 24 to 48 hours in the RGD+ group, but the difference between 24 and 48 hours did not reach significance (P = 0.12), and the % SI loss did not increase from 24 to 48 hours in the RGD– group (P = 0.84). In the saline control mice, signal reduction in suprarenal aorta was not seen (Fig. 2A) and the calculated % SI loss of suprarenal aorta was not significant in either the RGD+ or RGD– group (Fig. 2B).
Figure 2.
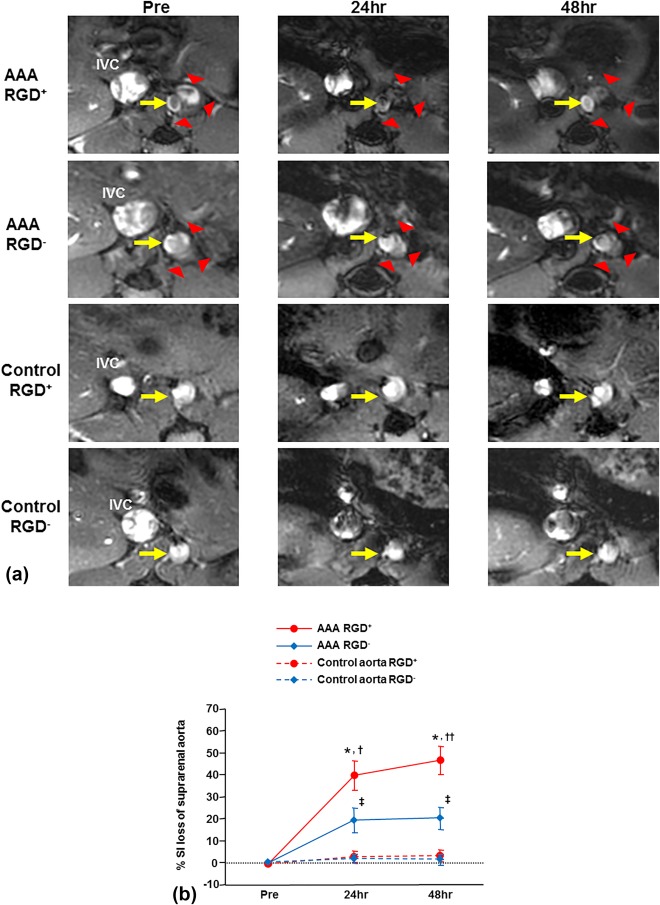
Serial in vivo MRI of abdominal aortic aneurysms (AAA) and control aortae with RGD‐HFn‐Fe3O4 or HFn‐Fe3O4. A: The aneurysmal site (red arrowheads) and aortic lumen (yellow arrows) in the suprarenal aorta are clearly seen prior to RGD‐HFn‐Fe3O4 or HFn‐Fe3O4 injection (AAA‐Pre). After the injection, signal loss of the AAA was seen at 24 and 48 hours in RGD+ mice, with more limited signal loss in RGD– mice. In the saline control mice, signal loss in the suprarenal aorta was not seen in either group. B: By quantitative analysis, the AAA showed significant percent reduction in the normalized signal intensity (% SI loss) at 24 and 48 hours in both RGD+ and RGD– groups, but the % SI loss of RGD+ group was significantly greater. The suprarenal aorta of saline control mice showed minimal % SI loss in both groups. *P < 0.01 vs. Pre, P < 0.01 vs. control aorta, †P = 0.04 vs. RGD– group, ††P = 0.01 vs. RGD– group, ‡P < 0.05 vs. Pre, P < 0.05 vs. control aorta.
RGD Enhances Correlation Between AAA Growth and Aortic Signal Loss
The % SI loss at 48 hours postinjection in the RGD+ group (n = 10) correlated positively and strongly with both the aortic diameter on US (Fig. 3A; r = 0.89, P = 0.0005) and the aortic cross‐sectional area on MRI (Fig. 3B; r = 0.89, P = 0.0006). In contrast, the % SI loss in the RGD– group (n = 10) showed more moderate correlation with aortic US diameter (Fig. 3A; r = 0.63, P = 0.05) and MRI area (Fig. 3B; r = 0.71, P = 0.02).
Figure 3.
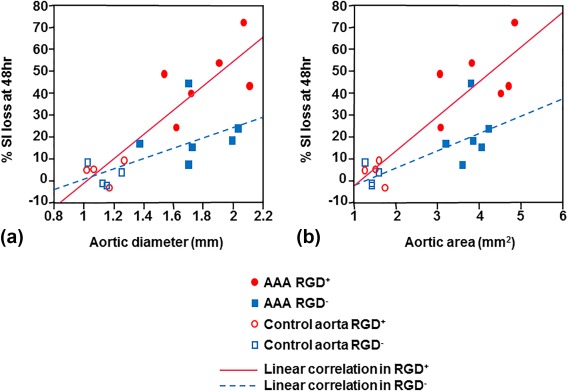
Correlation between aortic size and aortic signal loss at 48 hours. In the mice injected with RGD‐HFn‐Fe3O4 (RGD+ group, n = 10 total; six AAA [red filled circles] and four control [red open circles] mice), the % SI loss at 48 hours was positively and strongly correlated with aortic diameter on ultrasound (A; r = 0.89, P = 0.0005) and aortic area on MRI (B; r = 0.89, P = 0.0006). In the mice injected with HFn‐Fe3O4 (RGD– group, n = 10 total; six AAA [blue filled squares] and four control [blue open squares] mice), the % SI loss at 48 hours was more moderately correlated with aortic diameter (A; r = 0.63, P = 0.05) and area (B; r = 0.71, P = 0.02).
Histological Analysis
Carotid
Mac‐3 immunohistochemistry demonstrated substantial macrophage infiltration in the neointima and adventitia of the ligated left carotid arteries (Fig. 4A). Perl's iron staining of the carotid lesion exhibited more iron in the neointima and adventitia in the RGD+ group than in the RGD– group, confirmed by the quantification of cellular uptake (60 ± 7 vs. 25 ± 3 stained cells/CSA, P = 0.002), with colocalization to macrophages (Fig. 4A). CD‐31 immunohistochemistry showed positive staining only in the endothelial lining of the vessel lumen, but was nearly absent in the neointima and adventitia (Fig. 4A). The control right carotid arteries showed very little Perl's iron staining in either group (Fig. 4A), confirmed by the quantification of cellular uptake (RGD+, 5 ± 1 stained cells/CSA; RGD–, 4 ± 1 stained cells/CSA). The cellular uptake of the iron oxide nanoparticles was closely correlated with the % lumen loss on MRI of the corresponding ligated left carotid artery at 48 hours (Fig. 4B; n = 10, r = 0.92, P = 0.0002).
Figure 4.
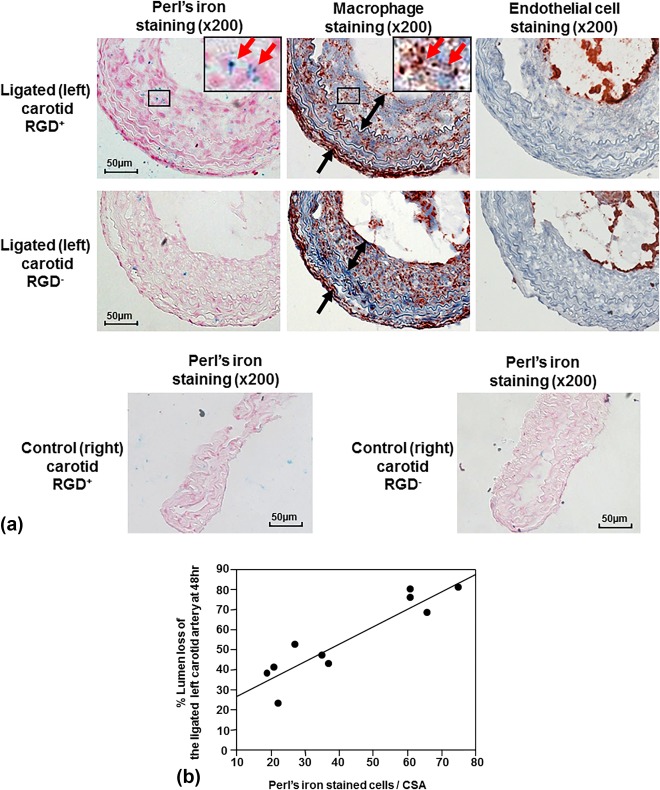
Histological analysis of carotid arteries and correlation with signal loss on MRI. A: Immunohistochemical staining of the ligated left carotid lesions showed substantial macrophage infiltration of the neointima (two‐headed arrows) and peri‐adventitia (arrows). Perl's iron staining showed greater accumulation of RGD‐HFn‐Fe3O4 in the neointima (ligated carotid RGD+) compared to HFn‐Fe3O4 (ligated carotid RGD–), colocalizing with macrophages (outline region). Immunohistochemical staining also showed positive endothelial cell staining along the luminal border, but few endothelial cells in the neointima and adventitia. The control right carotid arteries showed minimal Perl's iron staining in both RGD+ and RGD– groups. B: There was a close correlation between the total number of Perl's iron‐stained cells and % lumen loss in the ligated left carotid artery (n = 10, r = 0.92, P = 0.0002).
AAA
CD‐11b immunohistochemistry demonstrated mural macrophage infiltration in the AAA and CD‐31 immunohistochemistry demonstrated the expression of endothelial cells along the aortic lumen and within the AAA wall (Fig. 5A). Perl's iron staining exhibited more iron in the media and adventitia in the RGD+ group than in the RGD– group, confirmed by the quantification of cellular uptake (474 ± 51 vs. 277 ± 29 stained cells/CSA, P = 0.01), with colocalization to both macrophages and endothelial cells (Fig. 5A). The suprarenal aortae from the control mice showed very little Perl's iron staining (Fig. 5A), confirmed by the quantification of cellular uptake (RGD+, 11 ± 2 stained cells/CSA; RGD–, 14 ± 2 stained cells/CSA). The cellular uptake of the iron oxide nanoparticles was closely correlated with the % SI loss on MRI of the corresponding AAA at 48 hours (Fig. 5B; n = 10, r = 0.83, P = 0.003).
Figure 5.
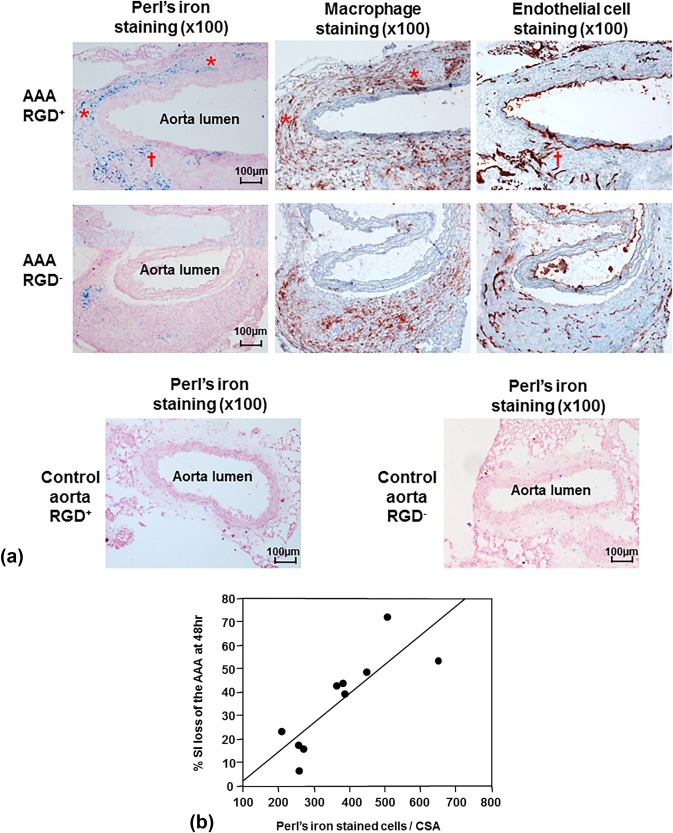
Histological analysis of abdominal aortic aneurysms (AAA) and correlation with signal loss on MRI. A: Immunohistochemical AAA staining showed mural macrophage infiltration and endothelial cell expression within the AAA wall. Perl's iron staining showed greater accumulation of RGD‐HFn‐Fe3O4 in the media and adventitia of AAA wall (AAA RGD+) compared to HFn‐Fe3O4 (AAA RGD–), colocalizing with both macrophages (asterisks) and endothelial cells (dagger). The control aortic wall showed minimal Perl's iron staining in both RGD+ and RGD– groups. B: There was a close correlation between the total number of Perl's iron‐stained cells and % SI loss in the AAA (n = 10, r = 0.83, P = 0.003).
Discussion
We have shown that incorporation of an RGD targeting peptide onto the iron oxide containing HFn nanoparticles can enhance in vivo MRI of vascular inflammation and angiogenesis in both murine carotid and AAA disease. Our results from this study suggest that targeted HFn with RGD is a promising in vivo MRI agent that may provide a translatable approach to comprehensive detection of high‐risk atherosclerotic and aneurysmal vascular diseases.
The cage structure of HFn enables the encapsulation of iron oxide in the interior cavity, with comparable MRI properties and macrophage uptake in vitro to established iron oxide MRI contrast agents, such as dextran‐coated ferumoxides and ferumoxtran‐10.20 We have reported the potential value of the mineralized magnetite HFn as an in vivo molecular MRI agent to detect murine vascular macrophages.12 This cage structure can be further bioengineered to impart the additional functionality of cell‐specific targeting.13 The current results demonstrate that this advantage can be applied to enhance in vivo MRI evaluation of key biological processes in vascular diseases.
Histological analysis showed colocalization of RGD‐HFn‐Fe3O4 to both macrophages infiltrating the vessel wall (carotid and AAA) and adventitial endothelial cells (AAA), with greater uptake compared to nontargeted HFn‐Fe3O4 in both carotid and AAA lesions. The αvβ3 integrin can be expressed on cells other than macrophages and endothelial cells, such as smooth muscle cells.9, 10 However, we have previously shown limited contribution of smooth muscle cells to RGD‐HFn uptake in either the carotid or AAA model.15
MRI has the potential to combine the noninvasive assessment of both structural and molecular characteristics of vascular disease.24 In human carotid disease, MRI enables the assessment of not only the degree of luminal stenosis but also plaque tissue characteristics, such as lipid core and intraplaque hemorrhage.17 Nontargeted USPIO contrast agents have shown potential to assess human carotid plaque inflammation.25 For human AAA disease, the feasibility of dynamic gadolinium‐enhanced MRI to assess both AAA anatomy and vessel tissue/wall characteristics has been reported recently.26 Additionally, a human pilot study has shown that uptake of non‐targeted USPIO in AAAs identifies cellular inflammation and appears to distinguish the patients with more rapidly progressive AAA expansion.27
In the current study, targeted imaging of vascular inflammation and angiogenesis measured by RGD‐HFn‐Fe3O4 uptake correlated well with murine AAA development (aortic diameter on US and area on MRI). Plus, for both carotid and AAA disease, the degree of signal loss on MRI correlated well with histologic evidence of RGD‐HFn‐Fe3O4 uptake. Translation to humans would allow MRI, with a single agent, to detect two critical biological features of vascular disease (ie, vascular inflammation and angiogenesis) and may provide more accurate risk stratification and therapeutic monitoring.
Molecular MRI using iron oxide nanoparticles typically relies on signal loss, which can be challenging to interpret. Thus, the application of "positive contrast" methods to high‐field small‐animal MRI systems for iron detection may be advantageous.28 The degree of signal change can be affected by B0 inhomogeneity and gradient nonlinearity, plus geometric distortion affects spatial precision. A relatively small FOV was used and these effects should be the same for RGD‐targeted and nontargeted nanoparticle imaging. Most important, the same imaging protocol was used pre‐ and postcontrast with image analysis based on relative changes normalized to precontrast images ± normal vessel segments. Our current MRI results show internal consistency in that our measurements of signal reduction correlate well with uptake of iron oxide nanoparticles by histology.
The study design includes several limitations. While our murine carotid ligation model develops abundant inflammation, it does not fully replicate the human lesion, with evidence of intraplaque angiogenesis notably absent. Thus, while MRI with RGD‐HFn‐Fe3O4 detects murine carotid inflammation, this study does not show this approach can detect plaques vulnerable to rupture. Our angiotensin II‐induced AAA model is well established and advantageous in not requiring aortic surgery (minimizing nonspecific inflammation/angiogenesis), but it does involve both aortic dissection and dilatation. Also, murine AAAs develop over weeks, rather than decades, so the model cannot fully represent human AAA biology and progression. In addition, the sample size was relatively small and did not include testing of contrast dose and full time course. The injected dose of RGD‐HFn‐Fe3O4 was set to a typical level for animal imaging (25 mg/kg of Fe),29 but would require further testing in humans. As for the optimal timing of MRI, we saw a nonsignificant increase in the signal change with RGD‐HFn‐Fe3O4 from 24 and 48 hours after injection, but further studies on the best timepoint are needed.
In conclusion, the present study demonstrates that RGD targeting of human ferritin iron oxide nanoparticles significantly enhances in vivo MRI detection of vascular inflammation and angiogenesis in experimental carotid and AAA disease. RGD‐conjugated human ferritin iron oxide nanoparticles have potential as translatable MRI agents to assess high‐risk biological activity of vascular diseases in vivo.
Conflict of Interest
MM is currently on partial leave‐of‐absence from Stanford and an employee of Verily Life Sciences.
Acknowledgments
Contract grant sponsor: The Stanford Division of Cardiovascular Medicine and Department of Electrical Engineering have MRI research agreements with GE Healthcare. Contract grant sponsor: National Institutes of Health; contract grant numbers: R01 HL078678, P50 HL083800, R01‐EB012027; Contract grant sponsor: American Heart Association; contract grant number: 13SDG16970075; Contract grant sponsor: Stanford Cardiovascular Institute (2010 Younger Fellowship Award).
References
- 1. Jager NA, Westra J, Golestani R, et al. Folate receptor‐β imaging using 99mTc‐folate to explore distribution of polarized macrophage populations in human atherosclerotic plaque. J Nucl Med 2014;55:1945–1951. [DOI] [PubMed] [Google Scholar]
- 2. Ciavarella C, Alviano F, Gallitto E, et al. Human vascular wall mesenchymal stromal cells contribute to abdominal aortic aneurysm pathogenesis through an impaired immunomodulatory activity and increased levels of matrix metalloproteinase‐9. Circ J 2015;79:1460–1469. [DOI] [PubMed] [Google Scholar]
- 3. Toczek J, Meadows JL, Sadeghi MM. Novel molecular imaging approaches to abdominal aortic aneurysm risk stratification. Circ Cardiovasc Imaging 2016;9:e003023. [DOI] [PMC free article] [PubMed] [Google Scholar]
- 4. Van der Donckt C, Van Herck JL, Schrijvers DM, et al. Elastin fragmentation in atherosclerotic mice leads to intraplaque neovascularization, plaque rupture, myocardial infarction, stroke, and sudden death. Eur Heart J 2015;36:1049–1058. [DOI] [PMC free article] [PubMed] [Google Scholar]
- 5. Vijaynagar B, Bown MJ, Sayers RD, Choke E. Potential role for anti‐angiogenic therapy in abdominal aortic aneurysms. Eur J Clin Invest 2013;43:758–765. [DOI] [PubMed] [Google Scholar]
- 6. Tedesco MM, Terashima M, Blankenberg FG, et al. Analysis of in situ and ex vivo vascular endothelial growth factor receptor expression during experimental aortic aneurysm progression. Arterioscler Thromb Vasc Biol 2009;29:1452–1457. [DOI] [PMC free article] [PubMed] [Google Scholar]
- 7. Sano M, Sasaki T, Hirakawa S, et al. Lymphangiogenesis and angiogenesis in abdominal aortic aneurysm. PLoS One 2014;9:e89830. [DOI] [PMC free article] [PubMed] [Google Scholar]
- 8. Rouer M, Xu BH, Xuan HJ, et al. Rapamycin limits the growth of established experimental abdominal aortic aneurysms. Eur J Vasc Endovasc Surg 2014;47:493–500. [DOI] [PubMed] [Google Scholar]
- 9. Melemenidis S, Jefferson A, Ruparelia N, et al. Molecular magnetic resonance imaging of angiogenesis in vivo using polyvalent cyclic RGD‐iron oxide microparticle conjugates. Theranostics 2015;5:515–529. [DOI] [PMC free article] [PubMed] [Google Scholar]
- 10. Razavian M, Marfatia R, Mongue‐Din H, et al. Integrin‐targeted imaging of inflammation in vascular remodeling. Arterioscler Thromb Vasc Biol 2011;31:2820–2826. [DOI] [PMC free article] [PubMed] [Google Scholar]
- 11. Arap W, Pasqualini R, Ruoslahti E. Cancer treatment by targeted drug delivery to tumor vasculature in a mouse model. Science 1998;279:377–380. [DOI] [PubMed] [Google Scholar]
- 12. Terashima M, Uchida M, Kosuge H, et al. Human ferritin cages for imaging vascular macrophages. Biomaterials 2010;32:1430–1437. [DOI] [PMC free article] [PubMed] [Google Scholar]
- 13. Uchida M, Flenniken ML, Allen M, et al. Targeting of cancer cells with ferrimagnetic ferritin cage nanoparticles. J Am Chem Soc 2006;128:16626–16633. [DOI] [PubMed] [Google Scholar]
- 14. Uchida M, Willits DA, Muller K, et al. Intracellular distribution of macrophage targeting ferritin‐ironoxide nanocomposite. Adv Mater 2009;21:458–462. [Google Scholar]
- 15. Kitagawa T, Kosuge H, Uchida M, et al. RGD‐conjugated human ferritin nanoparticles for imaging vascular inflammation and angiogenesis in experimental carotid and aortic disease. Mol Imaging Biol 2012;14:315–324. [DOI] [PMC free article] [PubMed] [Google Scholar]
- 16. Varma N, Hinojar R, D'Cruz D, et al. Coronary vessel wall contrast enhancement imaging as a potential direct marker of coronary involvement: integration of findings from CAD and SLE patients. JACC Cardiovasc Imaging 2014;7:762–770. [DOI] [PMC free article] [PubMed] [Google Scholar]
- 17. Zhang Y, Guallar E, Qiao Y, Wasserman BA. Is carotid intima‐media thickness as predictive as other noninvasive techniques for the detection of coronary artery disease? Arterioscler Thromb Vasc Biol 2014;34:1341–1345. [DOI] [PubMed] [Google Scholar]
- 18. Terashima M, Ehara S, Yang E, et al. In vivo bioluminescence imaging of inducible nitric oxide synthase gene expression in vascular inflammation. Mol Imaging Biol 2011;13:1061–1066. [DOI] [PMC free article] [PubMed] [Google Scholar]
- 19. Maegdefessel L, Spin JM, Raaz U, et al. miR‐24 limits aortic vascular inflammation and murine abdominal aneurysm development. Nat Commun 2014;5:5214. [DOI] [PMC free article] [PubMed] [Google Scholar]
- 20. Uchida M, Terashima M, Cunningham CH, et al. A human ferritin iron oxide nano‐composite magnetic resonance contrast agent. Magn Reson Med 2008;60:1073–1081. [DOI] [PubMed] [Google Scholar]
- 21. Kosuge H, Sherlock SP, Kitagawa T, et al. FeCo/graphite nanocrystals for multi‐modality imaging of experimental vascular inflammation. PLoS One 2011;6:e14523. [DOI] [PMC free article] [PubMed] [Google Scholar]
- 22. Kitagawa T, Kosuge H, Chang E, et al. Integrin‐targeted molecular imaging of experimental abdominal aortic aneurysms by (18)F‐labeled Arg‐Gly‐Asp positron‐emission tomography. Circ Cardiovasc Imaging 2013;6:950–956. [DOI] [PMC free article] [PubMed] [Google Scholar]
- 23. Miyama N, Dua MM, Schultz GM, et al. Bioluminescence and magnetic resonance imaging of macrophage homing to experimental abdominal aortic aneurysms. Mol Imaging 2012;11:126–134. [PubMed] [Google Scholar]
- 24. Sadat U, Jaffer FA, van Zandvoort MA, Nicholls SJ, Ribatti D, Gillard JH. Inflammation and neovascularization intertwined in atherosclerosis: imaging of structural and molecular imaging targets. Circulation 2014;130:786–794. [DOI] [PMC free article] [PubMed] [Google Scholar]
- 25. Metz S, Beer AJ, Settles M, et al. Characterization of carotid artery plaques with USPIO‐enhanced MRI: assessment of inflammation and vascularity as in vivo imaging biomarkers for plaque vulnerability. Int J Cardiovasc Imaging 2011;27:901–912. [DOI] [PubMed] [Google Scholar]
- 26. Nguyen VL, Backes WH, Kooi ME, et al. Quantification of abdominal aortic aneurysm wall enhancement with dynamic contrast‐enhanced MRI: feasibility, reproducibility, and initial experience. J Magn Reson Imaging 2014;39:1449–1456. [DOI] [PubMed] [Google Scholar]
- 27. Richards JM, Semple SI, MacGillivray TJ, et al. Abdominal aortic aneurysm growth predicted by uptake of ultrasmall superparamagnetic particles of iron oxide: a pilot study. Circ Cardiovasc Imaging 2011;4:274–281. [DOI] [PubMed] [Google Scholar]
- 28. Trotier AJ, Lefrançois W, Van Renterghem K, Franconi JM, Thiaudière E, Miraux S. Positive contrast high‐resolution 3D‐cine imaging of the cardiovascular system in small animals using a UTE sequence and iron nanoparticles at 4.7, 7 and 9.4 T. J Cardiovasc Magn Reson 2015;17:53. [DOI] [PMC free article] [PubMed] [Google Scholar]
- 29. Tang TY, Muller KH, Graves MJ, et al. Iron oxide particles for atheroma imaging. Arterioscler Thromb Vasc Biol 2009;29:1001–1008. [DOI] [PubMed] [Google Scholar]