Abstract
Plasma membrane monoamine transporter (PMAT) is a newly discovered monoamine transporter belonging to the equilibrative nucleoside transporter family. Highly expressed in the brain, PMAT represents a major uptake2 transporter that may play a role in monoamine clearance. Although human PMAT has been functionally characterized at the molecular level, rodent models are often used to evaluate PMAT function in ex vivo and in vivo studies. The aim of this study was to examine if there is potential species difference in the functional characteristics of PMAT between human, rat and mouse. A set of transfected cells stably expressing human PMAT (MDCK/hPMAT), rat Pmat (MDCK/rPmat) and mouse Pmat (Flp293/mPmat) were constructed. In MDCK/hPMAT, MDCK/rPmat and Flp293/mPmat cells, cellular localization analyses revealed that hPMAT, rPmat and mPmat are expressed and mainly localized to the plasma membranes of cells. The uptake of MPP+, serotonin and dopamine by MDCK/hPMAT, MDCK/rPmat and Flp293/mPmat cells was significantly increased compared with those by the mock transfection control. In contrast, two nucleosides, uridine and adenosine, minimally interacted with PMAT/Pmat in all species. The hPMAT-, rPmat- and mPmat-mediated uptakes of MPP+, serotonin and dopamine were saturable, with Km values of 33.7 µM, 70.2 µM and 49.5 µM (MPP+),116 µM, 82.9 µM and 231 µM (serotonin), and 201 µM, 271 µM and 466 µM (dopamine), respectively, suggesting similar substrate affinities between human and rodent PMAT/Pmat. The prototypical inhibitors, decynium 22 and GBR12935, also showed similar inhibition potencies between species. In conclusion, the present study demonstrated interspecies similarities in the functional characteristics of human and rodent PMAT/Pmat, which indicate a practical utility of rat and mouse animal models for further investigating and extrapolating the in vivo function of PMAT in humans.
Keywords: PMAT, Monoamine, Species difference, Human, Rat, Mouse
1. Introduction
The plasma membrane monoamine transporter (PMAT) belongs to the family of solute carrier (SLC) 29 transporters, which consists of four members termed human equilibrative nucleoside transporter (ENT) 1–4 (Baldwin et al., 2005). ENT1–3 exclusively interact with nucleosides and nucleobases, while human ENT4 exhibits no significant interaction with nucleosides or nucleobase analogs. We previously demonstrated that human ENT4 mainly interacts with organic cations such as monoamine neurotransmitters (Engel et al., 2004). Due to its distinct substrates specificity from other ENT members, we designated ENT4 to PMAT to be consistent with its physiological substrate profile (Engel et al., 2004).
PMAT is a plasma membrane transporter with low-affinity and high-capacity for monoamine neurotransmitters including dopamine and serotonin (Duan and Wang, 2010; Engel et al., 2004). Because PMAT is highly expressed in the brain, it is thought to play an important role in homeostasis of brain monoamines in concert with high affinity neurotransmitter transporters such as the dopamine transporter (DAT), serotonin transporter (SERT), and norepinephrine transporter (NET) (Engel et al., 2004). PMAT is also found in the small intestine and the kidney, which are important organs for drug disposition (The Guideline Development Group, 2008; Zhou et al., 2007a). Indeed, we previously indicated that PMAT is expressed in the apical membrane of human enterocytes and may play a role in oral absorption of metformin, a positively charged antihyperglycemic drug, and possibly other cationic drugs (Zhou et al., 2007a).
Interestingly, the substrate and inhibitor specificity of PMAT largely overlaps with that of the organic cation transporters (OCTs), which belong to the SLC22 transporter family, expressed in various tissues (Engel and Wang, 2005; Koepsell, 2004; Koepsell et al., 2007, 2003). In fact, recent reports showed that biogenic amines,1-methyl-4-phenylpyridinium (MPP+), and metformin are trans-ported by both PMAT and OCTs in membrane potential- and Na+-independent manners (Engel and Wang, 2005; Engel et al., 2004; Koepsell, 2004; Koepsell et al., 2003; Sweet and Pritchard, 1999; Wright and Dantzler, 2004; Zhou et al., 2007a). Accordingly, PMAT is now regarded as a polyspecific organic cation transporter and is considered to play a role in disposition of various organic cations including biogenic amines.
The overlapping substrate specificity between PMAT and OCTs makes it difficult to distinguish the relative contribution of PMAT and OCTs to monoamine and organic cation uptake in vivo. As a result, the in vivo function of PMAT remains unclear. Experimental animal models, especially gene knock out mice, would be useful in evaluating the contribution of PMAT in monoamine uptake. In addition, rat is frequently used in pharmacokinetic studies. In this case, it is essential to consider potential species differences in PMAT function in study design, data analysis and interpretation. However, most of the functional studies carried out to date have been focused on human PMAT. Although two studies have examined the uptake properties of rat or mouse Pmat towards MPP+, comprehensive interspecies analyses have not been performed on monoamine substrates and prototype PMAT inhibitors (Okura et al., 2011; Duan and Wang, 2013). In the present study, we focused on the most commonly used animal models rat and mouse to explore potential differences in PMAT function between human and experimental animals. Here, we established transfected cell lines stably expressing human PMAT, rat and mouse Pmats, and performed interspecies comparison for PMAT/Pmat in terms of substrate specificity, monoamine transport kinetics and inhibition potencies towards prototypical inhibitors.
2. Materials and methods
2.1. Materials
Madin-Darby canine kidney (MDCK) cells were obtained from American Type Culture Collection (ATCC, Manassas, VA). Flp-in HEK293 (Flp293) cells were purchased from Invitrogen (Carlsbad, CA). Minimum Essential Media (MEM), Dulbecco’s modified Eagle’s medium (DMEM), phosphate-buffered saline (PBS), BD Falcon™ 24-well multiwell plates and 60-mm cell culture dishes were purchased from Corning (Corning, NY). Trypsin (0.25%)-EDTA (1 mM) Penicillin-streptomycin mixture was obtained from Gibco (Carlsbad, CA). Fetal bovine serum (FBS) and G418 were obtained from Invitrogen. [3H]MPP+ (80 Ci/mmol), [3H]uridine (30 Ci/mmol), and [3H]adenosine (30 Ci/mmol) were purchased from American Radiolabeled Chemicals (St. Louis, MO). [3H]5-HT (5-hydroxy-[1,2-3H]tryptamine creatinine sulfate, 27.1 Ci/mmol) and [3H] dopamine (3,4-dihydroxy-[2,5,6-3H]phenylethylamine, 59.7 Ci/mmol) were from PerkinElmer Life Sciences, Inc. (Boston, MA). All other chemicals and general reagents were of analytical grade or better and were obtained from various commercial sources such as Gibco, Corning, Invitrogen or Applied Biosystems (Foster City, CA).
2.2. Cell culture
MDCK cells were cultured at 37 °C in a humidified atmosphere of 5% CO2 in air using MEM supplemented with 10% FBS, 100 U/mL benzylpenicillin, 100 µg/mL streptomycin. Transfected MDCK cells were cultured in the presence of 200 µg/mL G418. Cells were routinely subcultured at 90% confluency with trypsin (0.25%)-EDTA. For the uptake experiments, cells were plated at a density of 5 × 10⁴ cells/cm2 in 24-well plates pretreated with 0.1% poly-l-lysine solution and allowed to grow for 3 days.
Flp293 cells were cultured at 37 °C in a humidified atmosphere of 5% CO2 in air using DMEM (high glucose) supplemented with 10% FBS, 100 U/mL benzylpenicillin, 100 µg/mL streptomycin. Transfected Flp293 cells were cultured in the presence of 150 µg/mL hygromycin B. Cells were routinely subcultured at 90% confluency with trypsin (0.25%)-EDTA. For the uptake experiments, cells were plated in 24-well plates pretreated with 0.1% poly-l-lysine solution and allowed to grow for 2–3 days to reach 80–90% confluence.
2.3. Establishment of transfected cells expressing hPMAT, rPmat or mPmat
The series of full length complementary DNAs (cDNAs) of rat Pmat (rPmat) and mouse Pmat (mPmat) were isolated from respective brains by a reverse transcriptase polymerase chain reaction (RT-PCR) using primers summarized in Table 1. A MDCK cell line stably expressing yellow fluorescent protein (YFP) tagged human PMAT (hPMAT) was previously established (Engel et al., 2004). The full length rPmat cDNA was amplified from rat brain, sequenced, and subcloned into the EcoR I and Bgl II sites of the pEYFP-C1 vector. The plasmid containing rPmat were stably transfected into MDCK cells according to previously described methods (Engel et al., 2004). In brief, MDCK cells were seeded on 24-well plates at a density of 40 × 104 cells/cm2. After 1 day culture, 2 mg plasmid DNAs of rPmat were transfected into MDCK cells using LipofectAMINE 2000 Reagent (Invitrogen). Empty pEYFP-C1 vector was also transfected into MDCK cells as a control. YFP positive cells were purified using the FACS Vantage S.E. flow cytometry sorter (BD Biosciences, San Jose, CA). Stably transfected cell lines were obtained by G418 selection and cultured in MEM containing 200 µg/mL G418. The transfected cells stably expressing hPMAT and rPamt and the mock transfection control were designated as MDCK/hPMAT, MDCK/rPmat and MDCK/mock cells, respectively.
Table 1.
Sequences of Primers for RT-PCR Analysis.
| Gene | Primer | Sequence |
|---|---|---|
| Human PMAT | Sense | 5′-GAGAGGCTGCCATGGGCTCCGTGGGGAGC-3′ |
| Antisense | 5′-CGGTCCTCGGAGGACTTTGCAGAACTTCAGTCC-3′ | |
| Rat Pmat | Sense | 5′-ATGGGCTCCATTGGAAGCCAGCGC-3′ |
| Antisense | 5′-TCAGGGGCCAACAAGGATGGAGTC-3′ | |
| Mouse Pmat | Sense | 5′-GCCGCTAGCCGCCCGAGTGTGAACTGCCAT-3′ |
| Antisense | 5′-GGTCTCGAGGGCTCAGGGACCGACAGGGAT-3′ |
Recently, we used the Flp-in system to generate HEK293 cell lines stably expressing mPMAT (Duan and Wang, 2013). This system uses Flp recombinase to mediate integration of the transfected gene into the flippase recognition target (FRT) site in the Flp-in host cells, allowing gene expression from a defined genomic locus. Stably transfected cell lines were obtained by hygromycin B selection and cultured in DMEM containing 150 µg/mL hygromycin B. The pcDNA5/FRT empty vector was also transfected into Flp-in HEK293 cell as a control. The transfected cells stably expressing mPamt and the mock transfection control were designated as Flp293/mPmat and Flp293/mock cells, respectively.
2.4. Expression and cellular localization of hPMAT or rPmat in MDCK cells and mPmat in Flp293 cells
The cellular localization of hPMAT and rPMAt in transfected MDCK cells was determined by visualization of the YFP fused to the N terminus of hPMAT or rPmat with a Leica Spectral confocal microscope (Leica Microsystems Inc., Buffalo Grove, IL) according to previously described methods (Engel et al., 2004). The expression of mPmat in transfected Flp293 cells was visualized with polyclonal antibody under a Nikon fluorescence microscope (Nikon Co.,Ltd., Tokyo, Japan) with imaging capabilities, according to an immunostaining method previously described (Duan and Wang, 2010).
2.5. Uptake experiments in MDCK and Flp293 cells
MDCK/hPMAT, MDCK/rPmat and MDCK/mock cells were plated at a density of 40 × 104 cells/cm2 in 24-well plates pretreated with 0.1% poly-l-lysine solution and allowed to grow for 3 days. Flp-in HEK293 cells were plated in 24-well plates pretreated with 0.1% poly-l-lysine solution and allowed to grow for 2–3 days to reach 80–90% confluence. Uptake experiments were performed as described previously (Engel et al., 2004). Briefly, growth medium was aspirated and each well was rinsed with Krebs-Rinber-Henseleit (KRH) buffer (5.6 mM glucose, 125 mM NaCl, 4.8 mM KCl, 1.2 mM KH2PO4, 1.2 mM CaCl2, 1.2 mM MgSO4, and 25 mM HEPES), and preincubated in KRH buffer for 15 min at 37 °C and pH 7.4. The uptake measurement was initiated by replacing the preincubation buffer with KRH buffer containing an unlabeled (cold) substrate spiked with a trace amount of [H3]-labeled substrate (MPP+, dopamine, serotonin, norepinephrine, epinephrine, uridine or adenosine) for the designated time. To evaluate the concentration-dependence of the uptake of MPP+, serotonin and dopamine, cells were incubated with 0.5 mL of KRH buffer containing 0.1 µCi of [H3]-labeled substrate diluted with unlabeled substrate to achieve a final concentration (radiolabeled plus unlabeled) as indicated. In the inhibition studies, 1 µM of [H3]-labeled MPP+ was used. The uptake was terminated by washing the cells three times with ice-cold KRH buffer. Cells were then solubilized with 1N NaOH, and neutralized with 1N HCl. For uptake studies using [H3]-labeled nucleoside uridine and adenosine, 0.5 µM nitrobenzylmercaptopurine riboside (NBMPR) was added to the uptake buffer to suppress endogenous nucleoside uptake activities as previous described (Zhou et al., 2010). The radioactivity was determined with a liquid scintillation analyzer (Tri-Carb® 3110TR, PerkinElmer, Waltham, MA), and total protein concentrations were determined by the BCA Protein Assay (Pierce, Rockford, IL, USA). Time-dependent uptake was carried out to identify initial rate period and verify the linear range of uptake of ligands (data not shown).
2.6. Data analysis
Uptake (pmol/mg protein) was calculated by dividing the uptake amount by the total protein concentration in each well. Uptake rate (pmol/min/mg protein) was expressed as amount of total substrate (radiolabeled and unlabeled) uptake over a specified time. The hPMAT- and rPmat-mediated uptake was obtained after subtraction of the uptake by MDCK/mock cells from that by MDCK/hPMAT and MDCK/rPmat cells, respectively. The mPmat-mediated uptake was obtained after subtraction of the uptake by Flp293/mock cells from that by Flp293/mPmat cells. Kinetic parameters were estimated by means of nonlinear least-squares analysis using the Kaleida Graph (Synergy Software, Reading, PA) and the MULTI program (Yamaoka et al., 1981). The apparent affinity of the substrate (Km) for hPMAT, rPmat and mPmat and the maximal velocity (Vmax) were obtained by fitting the data to the Michaelis-Menten equation (Eq. (1)):
where V and C are uptake rate (fmol/min/mg protein) and initial concentration (µM), respectively. The Hill coefficient (γ) was introduced to the equation to add flexibility on the fitted curve.
The inhibitory effect of several compounds on substrate uptake was expressed as percent of control, and the inhibitor concentration giving half-maximum inhibition (IC50) was obtained from the following equation (Eq. (2)):
| (2) |
where [I] is inhibitor concentration (µM). The Hill coefficient (γ) was introduced to the equation to add flexibility on the fitted curve.
2.7. Statistical analysis
Data are given as the mean of values obtained in at least three experiments with the standard deviation (SD). Statistical analyses were performed with the unpaired Student’s t-test, and a probability of less than 0.05 (p < 0.05) was considered to be statistically significant.
3. Results
3.1. Plasma membrane localization of hPMAT, rPmat and mPmat
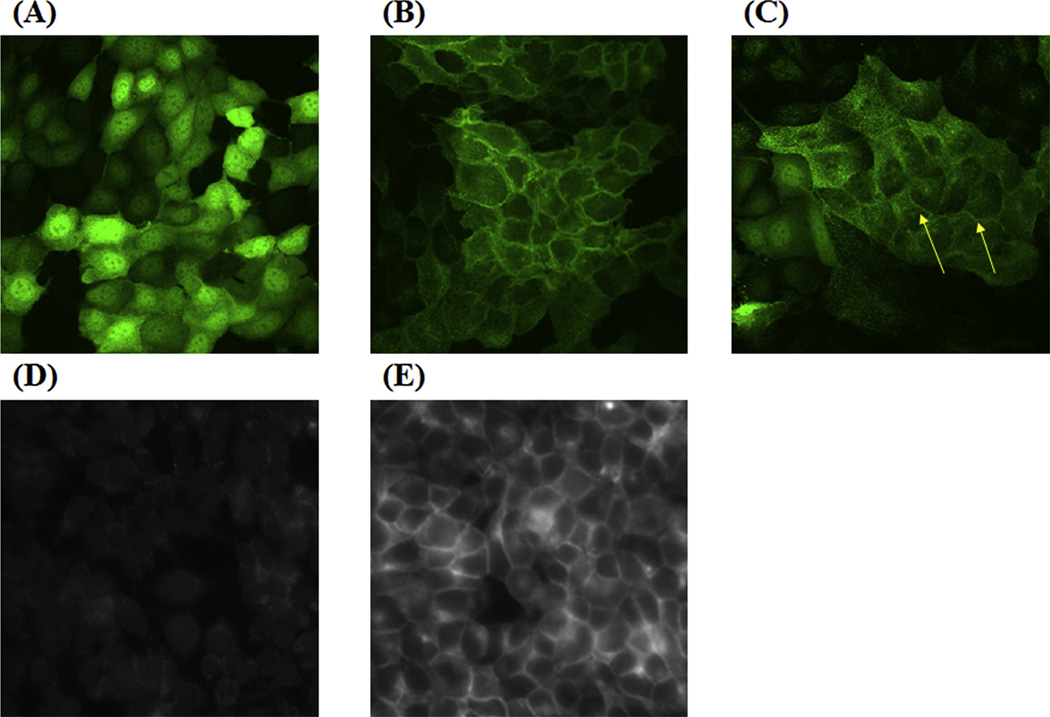
Transfected cell lines stably expressing hPMAT, rPmat and mPmat were established as MDCK/hPMAT, MDCK/rPmat and Flp293/mPmat cells, respectively, according to procedures de-scribed in the Materials and Methods section. Expression of PMAT/Pmat mRNA in these transfected cells was confirmed by RT-PCR analysis (data not shown). The cellular localization of the PMAT/Pmat protein in MDCK/hPMAT and MDCK/rPmat cells was examined by confocal microscopy imaging (Fig. 1A–C). Consistent with our previous report (Engel et al., 2004), the YFP-tagged hPMAT protein was primarily localized to the plasma membrane in MDCK/hPMAT cells, while intracellular expression of YFP was observed in MDCK/mock cells (Fig. 1A and B). In the case of MDCK/rPmat, the YFP fusion protein of rPmat was largely observed in the plasma membrane, although some intracellular signal was also observed (Fig. 1C). Immunostaining with mPmat-specific anti-bodies revealed a predominant expression of mPmat on plasma membranes with uniform distribution in Flp293/mPmat cells, whereas no significant antibody staining was observed in Flp293/mock cells (Fig. 1D and E).
Fig. 1. Localization of hPMAT, rPmat and mPmat in MDCK/hPMAT, MDCK/rPmat and Flp293/mPmat cells.
MDCK/mock (A), MDCK/hPMAT (B) and MDCK/rPmat (C) were visualized by confocal microscopy imaging of YFP control and YFP fusion constructs of hPMAT and rPmat, respectively. Flp293/mock (D) and Flp293/mPmat (E) cells were immunostained with anti-mPmat primary antibodies and Alexa Fluor-conjugated secondary antibodies. Images were taken under a fluorescent microscope.
3.2. Uptake of MPP+ by MDCK/hPMAT, MDCK/rPmat and Flp293/mPmat cells
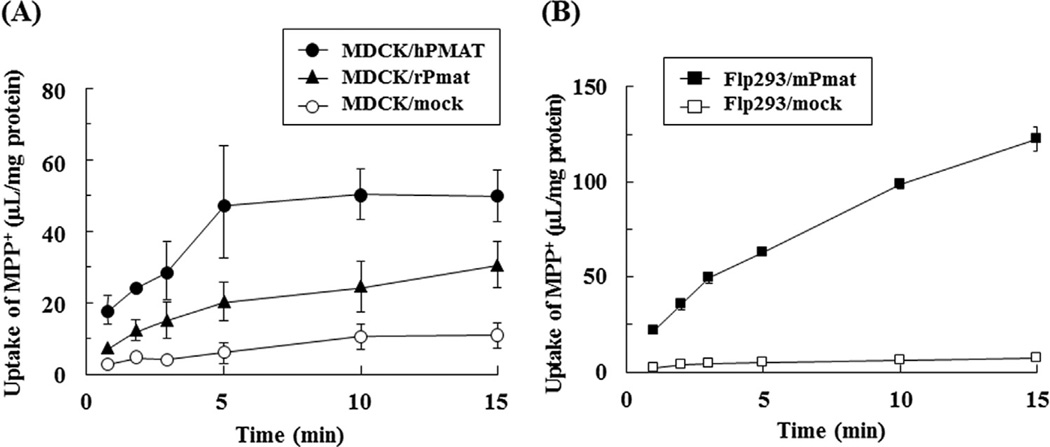
To investigate whether hPMAT, rPmat and mPmat were functionally expressed in MDCK/hPMAT, MDCK/rPmat and Flp293/mPmat cells, respectively, the time course of uptake of a prototype PMAT substrate MPP+ (1 µM) was measured using these cell lines (Fig. 2). The uptake of MPP+ by all transfected cells was significantly higher than that by mock transfection control in each case. The uptake of MPP+ by MDCK/hPMAT, MDCK/rPmat and Flp293/mPmat cells increased linearly up to at least 5, 5 and 3 min, respectively. Therefore, in the subsequent studies, uptake was routinely measured at 3, 3 and 2 min in MDCK/hPMAT, MDCK/ rPmat and Flp293/mPmat cells, respectively.
Fig. 2. Time courses of MPP+ uptake by MDCK/hPMAT, MDCK/rPmat and Flp293/mPmat cells.
Uptake of MPP+ (1 µM) by MDCK/hPMAT (closed circles), MDCK/rPmat (closed triangles), MDCK/mock (open circles), Flp293/mPmat (closed squares) or Flp293/mock (open squares) cells was measured at 37 °C and pH 7.4. Data are shown as the mean ± SEM (n = 3).
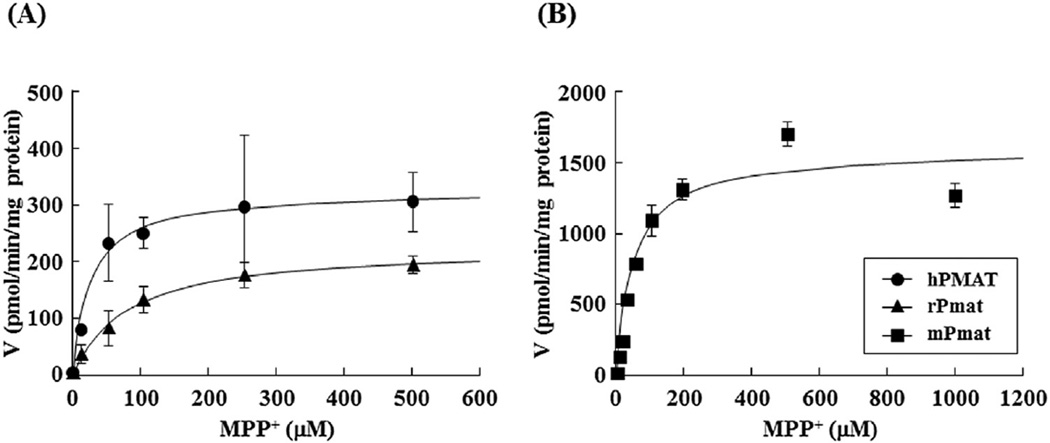
Further analysis of the concentration dependence showed that the hPMAT-, rPmat-, and mPmat-mediated uptakes of MPP+ were saturable, with Km and Vmax values of 33.7 ± 6.0 µM and 0.490 ± 0.190 nmol/min/mg ptotein, 70.2 ± 12.3 µM and 0.210 ± 0.011 nmol/min/mg protein, and 49.5 ± 0.1 µM and 1.59 ± 0.068 nmol/min/mg protein, respectively (Fig. 3 and Table 2). These results indicated similarity of MPP+ affinity (Km) for PMAT/Pmat between human, rat and mouse.
Fig. 3. Concentration dependence of hPMAT-, rPmat-, and mPmat-mediated uptake of MPP+.
(A) The hPMAT- (closed circles) and rPmat- (closed triangles) mediated uptake of MPP+ was measured for 3 min at 37 °C and pH 7.4. (B) The mPMAT- (closed squares) mediated uptake of MPP+ was measured for 2 min at 37 °C and pH 7.4. Cells were incubated with 0.5 mL of KRH buffer containing 0.1 µCi of [3H]MPP+ and various concentrations of unlabeled MPP+. The hPMAT- and rPmat-mediated uptake was determined by subtracting the uptake by MDCK/mock cells from that by MDCK/hPMAT and MDCK/rPmat cells, respectively. The mPmat-mediated uptake was determined by subtracting the uptake by Flp293/mock cells from that by Flp293/mPmat cells. Data are shown as the mean ± SEM (n = 3).
Table 2.
Kinetic parameters (Km and Vmax) for MPP+, Serotonin and Dopamine transports mediated by hPMAT, rPmat and mPmat.
| Substrates | hPMAT | rPmat | mPmat | ||||||
|---|---|---|---|---|---|---|---|---|---|
| Km (µM) |
Vmax (nmol/min/mg protein) |
Vmax/Km (µL/min/mg protein) |
Km (µM) |
Vmax (nmol/min/mg protein) |
Vmax/Km (µL/min/mg protein) |
Km (µM) |
Vmax (nmol/min/mg protein) |
Vmax/Km (µL/min/mg protein) |
|
| MPP+ | 33.7 ± 6.0 | 0.490 ± 0.190 | 14.5 | 70.2 ± 12.3 | 0.210 ± 0.011 | 2.99 | 49.5 ± 0.1 | 1.59 ± 0.068† | 32.1 |
| Serotonin | 116 ± 27 | 1.81 ± 1.01 | 15.6 | 82.9 ± 21.2 | 1.26 ± 0.12 | 15.2 | 231 ± 22† | 3.98 ± 0.14 | 17.2 |
| Dopamine | 201 ± 34 | 1.43 ± 0.08 | 7.11 | 271 ± 50 | 0.750 ± 0.049† | 2.77 | 466 ± 106 | 3.48 ± 0.26† | 7.47 |
Kinetic parameters were obtained from the data presented in Fig. 5.
P<0.05, significantly different from Km value for hPMAT-mediated transport of each compound. Data are shown as means ± SEM (n = 3).
3.3. Uptake of various compounds by MDCK/hPMAT, MDCK/rPmat and Flp293/mPmat cells
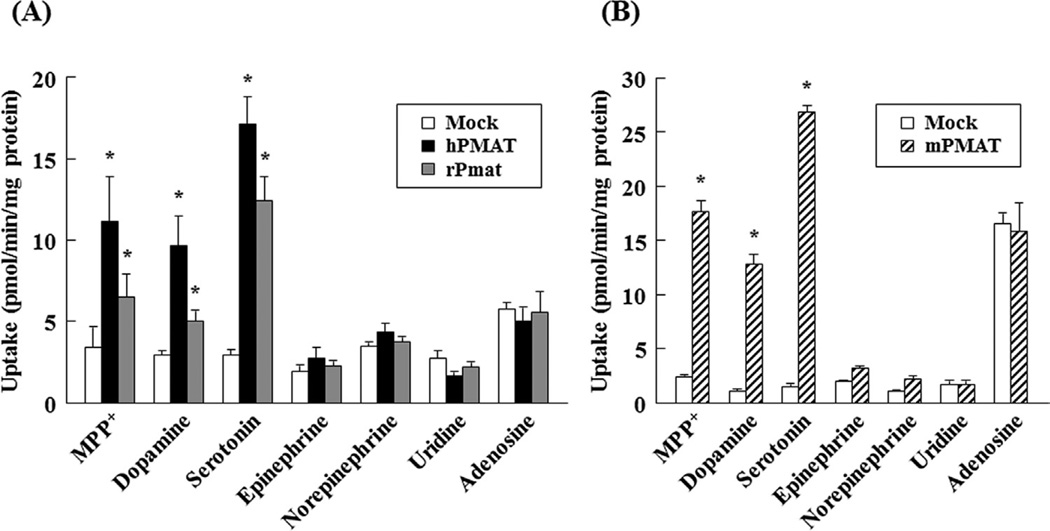
To examine whether hPMAT, rPmat and mPmat have similar specificity of substrate, the uptake of various compounds (MPP+, dopamine, serotonin, epinephrine, norepinephrine, uridine and adenosine) was measured using MDCK/hPMAT, MDCK/rPmat and Flp293/mPmat cells (Fig. 4). The uptake of MPP+ (1 µM), dopamine (1 µM) and serotonin (1 µM) by all transfected cells was significantly higher than that by mock transfection control. In contrast, the uptake of uridine (1 µM) and adenosine (1 µM) was comparable in all transfected cells and mock transfection control. These findings indicate that similar to hPMAT, rPmat and mPmat function as a monoamine transporter, but not a nucleoside transporter.
Fig. 4. Uptake of various compounds by MDCK/hPMAT, MDCK/rPmat and Flp293/mPmat cells.
(A) The uptake of MPP+, dopamine, serotonin, epinephrine, norepinephrine, uridine, adenosine by MDCK/hPMAT (closed bars), MDCK/rPmat (grey bars) or MDCK/mock (open bars) cells was measured for 3 min at 37 °C and pH 7.4. (B) The uptake of MPP+, dopamine, serotonin, epinephrine, norepinephrine, uridine, adenosine by Flp293/mPMAT (hatched bars) or Flp293/mock (open bars) cells was measured for 2 min at 37 °C and pH 7.4. The total applied concentration of a test compound was 1 µM containing 0.1 µCi of the [H3]-labeled form. The uptake of uridine and adenosine were determined in the presence of 0.5 µM NBMPR, which is a potent inhibitor of endogenous nucleoside uptake by MDCK and Flp293 cells. *P < 0.05, significantly different from MDCK/mock or Flp293/mock cells. Data are shown as the mean ± SEM (n = 6).
3.4. Uptake and inhibition kinetics of hPMAT, rPmat and mPmat
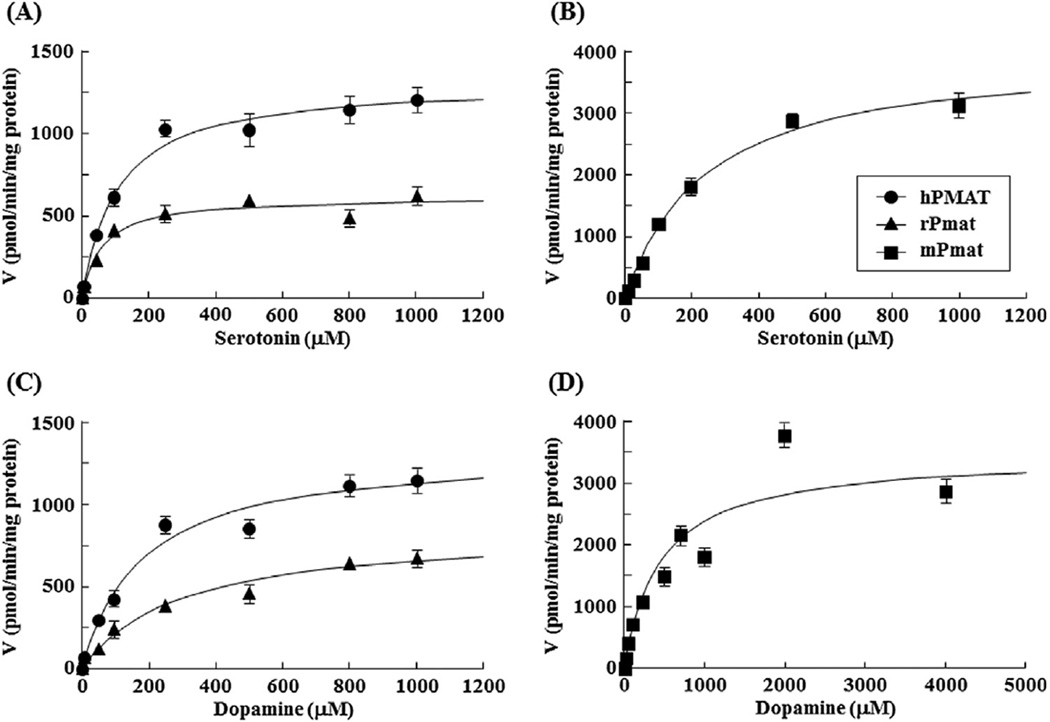
To characterize the transport kinetics of hPMAT-, rPmat- and mPmat-mediated monoamine uptake, the concentration-dependence of uptake of serotonin and dopamine was evaluated using MDCK/hPMAT, MDCK/rPmat and Flp293/mPmat cells (Fig. 5). The hPMAT-, rPmat-, and mPmat-mediated uptakes of serotonin were saturable, with Km and Vmax values of 116 ± 27 µM and 1.81 ± 1.01 nmol/min/mg ptotein, 82.9 ± 21.2 µM and 1.26 ± 0.12 nmol/min/mg protein, and 231 ± 22 µM and 3.98 ± 0.14 nmol/min/mg protein, respectively (Fig. 5A and B and Table 2). Similarly, the hPMAT-, rPmat-, and mPmat-mediated uptakes of dopamine were saturable, with Km and Vmax values of 201 ± 34 µM and 1.43 ± 0.08 nmol/min/mg protein, 271 ± 50 µM and 0.750 ± 0.049 nmol/min/mg protein, and 466 ± 106 µM and 3.48 ± 0.26 nmol/min/mg protein, respectively (Fig. 5C and D and Table 2).
Fig. 5. Concentration dependence of hPMAT-, rPmat- and mPmat-mediated uptake of serotonin and dopamine.
The hPMAT- (closed circles) and rPmat- (closed triangles) mediated uptake of serotonin (A) and dopamine (C) was measured for 3 min at 37 °C and pH 7.4. The mPMAT- (closed squares) mediated uptake of serotonin (B) and dopamine (D) was measured for 2 min at 37 °C and pH 7.4. Cells were incubated with 0.5 mL of KRH buffer containing 0.1 µCi of [H3]-labeled ligand and various concentrations of the unlabeled substrate. The hPMAT- and rPmat-mediated uptake was determined by subtracting the uptake by MDCK/mock cells from that by MDCK/hPMAT and MDCK/rPmat cells, respectively. The mPmat-mediated uptake was determined by subtracting the uptake by Flp293/mock cells from that by Flp293/mPmat cells. Data are shown as the mean ± SEM (n = 6).
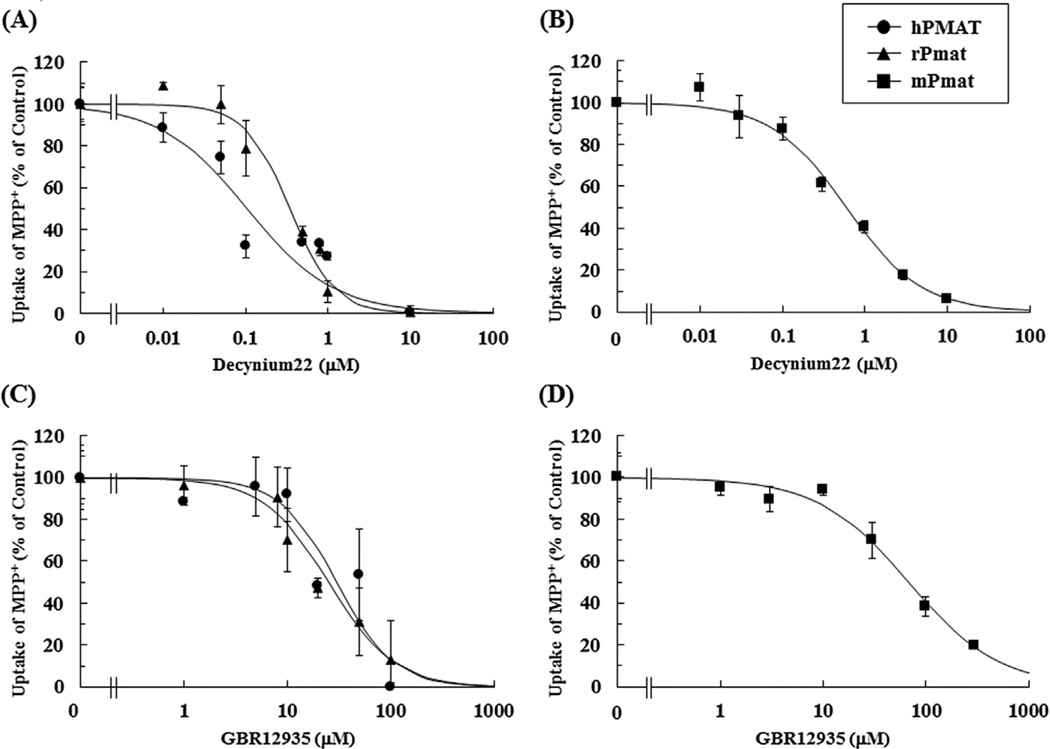
Furthermore, the inhibitory effect of the prototype inhibitors decynium22 and GBR12935 on hPMAT-, rPmat-, and mPmat-mediated uptakes of MPP+ was examined using MDCK/hPMAT, MDCK/rPmat and Flp293/mPmat cells, respectively. As shown in Fig. 6A and Table 3, decynium22 inhibited hPMAT-, rPmat-, and mPmat-mediated uptakes of MPP+ in a concentration-dependent manner with IC50 values of 0.124 ± 0.080 µM, 0.309 ± 0.062 µM and 0.591 ± 0.054 µM, respectively. Similarly, GBR12935 inhibited hPMAT-, rPmat-, and mPmat-mediated uptakes of MPP+ in a concentration-dependent manner with IC50 values of 30.0 ± 7.9 µM, 25.2 ± 1.4 µM and 62.8 ± 4.5 µM, respectively (Fig. 6B and Table 3).
Fig. 6. Inhibitory effects of decynium 22 and GBR12935 on hPMAT-, rPmat- and mPmat-mediated uptake of MPP+.
The hPMAT- (closed circles) and rPmat- (closed triangles) mediated uptake of 1 µM MPP+ as only [H3]-labeled ligands was measured in the absence or presence of various concentrations of (A) decynium 22 or (C) GBR12935 for 3 min at 37 °C and pH 7.4. The mPmat- (closed squares) mediated uptake of MPP+ (1 µM) was measured in the absence or presence of various concentrations of (B) decynium 22 or (D) GBR12935 for 2 min at 37 °C and pH 7.4. The hPMAT-, rPmat- and mPmat-mediated uptake was determined by subtracting the uptake by MDCK/mock cells from that by MDCK/hPMAT, MDCK/rPmat and Flp293/mPmat cells, respectively. The inhibitory effects of decynium 22 or GBR12935 on hPMAT-, rPmat- and mPmat-mediated uptake of MPP+ are presented as percent of control. Data are shown as the mean ± SEM (n = 3).
Table 3.
Comparison of IC50 values of Decynium22 and GBR12935 for hPMAT-, rPmat- and mPmat-mediated MPP+ transport between humans, rats and mice.
| Inhibitors | IC50 (µM) | ||
|---|---|---|---|
| hPMAT | rPmat | mPmat | |
| Decynium22 | 0.124 ± 0.080 | 0.309 ± 0.062 | 0.591 ± 0.054† |
| GBR12935 | 30.0 ± 7.9 | 25.2 ± 1.4 | 62.8 ± 4.5† |
IC50 values were obtained from the data presented in Fig. 6. N.D., not determined.
P < 0.05, significantly different from IC50 value of each compound for hPMAT-mediated MPP+ transport. Data are shown as means ± SEM (n = 3).
4. Discussion
The large overlaps in substrate specificity and tissue distribution of PMAT and OCTs make it difficult to distinguish the relative contribution of these transporters in monoamine uptake and organic cation drug disposition in human in vivo. Experimental animal models, especially gene knock out mice, would be useful in evaluating the neurological and pharmacological function of PMAT in vivo. In this case, information about species differences or similarities in PMAT/Pmat function would be important in the study design, data analysis and proper extrapolation to humans. Therefore, in the present study, we constructed and used transfected cell lines stably expressing hPMAT, rPmat and mPmat to examine interspecies difference or similarity for PMAT/Pmat in terms of substrate specificity, transport kinetics and inhibitory property between human, rat and mouse.
In MDCK/hPMAT, MDCK/rPmat and Flp293/mPmat cells, cellular localization analyses clearly demonstrated that hPMAT, rPmat and mPmat are mainly expressed in the plasma membranes of cells (Fig. 1). This is consistent with our previous reports showing the cell surface localization of PMAT in human and mouse choroid plexus epithelia and rat podocytes (Duan and Wang, 2013; Xia et al., 2007). The uptake of MPP+, serotonin and dopamine by MDCK/hPMAT, MDCK/rPmat and Flp293/mPmat cells was significantly increased compared with those by the mock transfection control, whereas the nucleosides uridine and adenosine did not interact with PMAT/Pmat in all species (Figs. 2 and 4). These findings indicate that rPmat and mPmat as well as hPMAT function as a monoamine transporter, but not a nucleoside transporter. The hPMAT-, rPmat- and mPmat-mediated uptakes of MPP+, serotonin and dopamine were saturable, with similar affinity (Km values) to PMAT/Pmat in three species, suggesting species conservation in the transport function of PMAT/Pmat (Fig. 5 and Table 2). In agreement, a recent report demonstrated that the transport of MPP+ in rPmat-expressing CHO cells was concentration dependent with a similar Km value to that of hPMAT (Okura et al., 2011). Similarly, in all three PMAT/Pmat expressing cell lines MPP+ transport was inhibited by decynium 22 and GBR12935 with inhibition potencies within the same order of magnitude. Overall, these results support interspecies similarities of the functional characteristics of PMAT/Pmats with respect to substrate specificity, monoamine transport kinetics, and inhibitor sensitivity, which support the practical utility of rat and mouse as animal models for investigating the in vivo function of PMAT in human.
In our study, we used YFP-tagged hPMAT and rPmat to facilitate the fast detection of membrane localization of these transporters in MDCK cells. YFP was tagged to the flexible, long intracellular N-terminus of hPMAT or rPmat, and our previous studies have demonstrated that tagging of YFP to the N-terminus of hPMAT do not affect the substrate selectivity or kinetic behavior of hPMAT (Engel et al., 2004; Zhou et al., 2007b; Ho and Wang, 2010). Similarly, Okura et al. also reported that N-terminal FLAG tagging did not interfere with the membrane localization or transport function of rPmat (Okura et al., 2011). Indeed, our result on MPP+ affinity of YFP-tagged rPmat was similar to that reported for the untagged rPmat by Okura et al. (Okura et al., 2011). Thus, N-terminal YFP tagging appears to have no effect on the transport function of hPMAT or rPmat.
One limitation of our study is that different expression systems (pEYFP-C1 vector and Flp-in system) and host cells (MDCK and HEK293 cells) were used to express hPMAT/rPamt and mPmat. At the present, it is unclear whether different expression systems and/or host cells may have an effect on the intrinsic transporter properties (e.g. Km and IC50 values). Although MPP+ transport was inhibited by decynium 22 and GBR12935 with inhibition potencies within the same order of magnitude, some small but statistically significant difference in the IC50 values was observed between hPMAT and mPmat (Fig. 6 and Table 3). This difference may reflect a small interspecies difference or be due to the use of different expression systems and host cells. Nevertheless, the difference is small and does not contradict with our major findings suggesting functional similarities between human and rodent PMAT/Pmat. Meanwhile, Vmax value is directly influenced by the expression levels of the transporters in the cell lines. This problem in comparing Vmax values occurs even when the same expression vector and host cells are used. Therefore, it is not meaningful to infer potential species based on Vmax value or Vmax-related parameters. In our study, we focused on comparing Km and IC50 values that are intrinsic properties of the transporter independent of its expression level.
On the other hand, there appears to be some species differences in the expression and distribution of the PMAT/Pmat. In the previous reports, abundant expression of hPMAT mRNA was confirmed in various brain regions in human (Barnes et al., 2006; Duan and Wang, 2010; Engel et al., 2004). Significant levels of hPMAT mRNA were also found in many other human tissues, including intestine, heart, skeletal muscle, liver, kidney, and pancreas (Barnes et al., 2006; Duan and Wang, 2010; Engel et al., 2004). However, in the case of mice, mPmat mRNA appeared not expressed at significant levels in small intestine, liver, kidney, skeletal muscle, whereas strong expression of mPmat mRNA was observed in whole brain and heart in accordance with observation from human tissues (Dahlin et al., 2007; Nakamichi et al., 2013). In rats, distinct expression of rPmat mRNA in isolated brain capillaries and choroid plexus was reportedly observed, but comprehensive expression analysis has not been performed in other rat tissues (Okura et al., 2011). Therefore, we cannot rule out the possibility that differences in the expression and distribution of the PMAT/Pmats between the three species may exist and result in interspecies differences of pharmacokinetics of their substrate drugs and endogenous substances, even though functional similarities of PMAT/Pmats were demonstrated in the present study. Further interspecies comparison of both mRNA and protein expressions and distribution of the PMAT/Pmats in multiple tissues and brain regions would be needed to fully understand contribution of PMAT to monoamine neurotransmitter clearance, as well as pharmacokinetics of clinically used organic cation drugs, in humans.
5. Conclusion
The present study demonstrated interspecies similarities of the functional characteristics of human, rat, mouse PMAT/Pmat in terms of substrate specificity, monoamine transport kinetics, and inhibitor sensitivity. Our data are indicative of practical utility of rat and mouse as animal models to study PMAT function at the molecular level. However, potential species differences in tissue expression and distribution may be a confounding factor. Thus, while rodents are generally a valid animal models to investigate PMAT function, cautions should be taken in inferring the quantitative and tissue-specific contribution of PMAT in the uptake of endogenous amines as well as the disposition of organic cation drugs.
Acknowledgments
This work was supported in part by Grant from NIH [R01 GM066233] and Nakatomi Foundation, and Grant for Basic Science Research Projects from the Sumitomo Foundation [150556].
Abbreviations
- DA
dopamine
- DAT
dopamine transporter
- ENT
equilibrative nucleoside transporters
- EPI
epinephrine
- 5-HT
serotonin
- MDCK
Madin-Darby canine kidney
- MPP+
1-methyl-4-phenylpyridinium
- NE
norepinephrine
- NBMPR
S-(4-nitrobenzyl)-6-thioinosine
- NET
the norepinephrine transporter
- OCT
organic cation transporter
- PMAT
plasma membrane monoamine transporter
- SERT
serotonin transporter
Footnotes
Conflict of interest
The authors declare no conflict of interest.
Ethical statement
This article does not involve studies with human subjects or live animals. The use of recombinant cell lines was approved by the Biological Use Authorization at University of Washington and carried out according to the guidelines of the committee.
Author contributions
Y.S. and J.W. designed the research; Y.S., N.L., H.D., H.H., and J.P. performed experiments; Y.S., N.L., H.H., and J.P. analyzed data; Y.S. and J.W. wrote or contributed to the writing of the manuscript. All the authors have approved the final version of the manuscript.
References
- Baldwin SA, Yao SY, Hyde RJ, Ng AM, Foppolo S, Barnes K, Ritzel MW, Cass CE, Young JD. Functional characterization of novel human and mouse equilibrative nucleoside transporters (hENT3 and mENT3) located in intracellular membranes. J. Biol. Chem. 2005;280:15880–15887. doi: 10.1074/jbc.M414337200. [DOI] [PubMed] [Google Scholar]
- Barnes K, Dobrzynski H, Foppolo S, Beal PR, Ismat F, Scullion ER, Sun L, Tellez J, Ritzel MW, Claycomb WC, Cass CE, Young JD, Billeter-Clark R, Boyett MR, Baldwin SA. Distribution and functional characterization of equilibrative nucleoside transporter-4, a novel cardiac adenosine transporter activated at acidic pH. Circ. Res. 2006;99:510–519. doi: 10.1161/01.RES.0000238359.18495.42. [DOI] [PubMed] [Google Scholar]
- Dahlin A, Xia L, Kong W, Hevner R, Wang J. Expression and immunolocalization of the plasma membrane monoamine transporter in the brain. Neuroscience. 2007;146:1193–1211. doi: 10.1016/j.neuroscience.2007.01.072. [DOI] [PMC free article] [PubMed] [Google Scholar]
- Duan H, Wang J. Selective transport of monoamine neurotransmitters by human plasma membrane monoamine transporter and organic cation transporter 3. J. Pharmacol. Exp. Ther. 2010;335:743–753. doi: 10.1124/jpet.110.170142. [DOI] [PMC free article] [PubMed] [Google Scholar]
- Duan H, Wang J. Impaired monoamine and organic cation uptake in choroid plexus in mice with targeted disruption of the plasma membrane monoamine transporter (Slc29a4) gene. J. Biol. Chem. 2013;288:3535–3544. doi: 10.1074/jbc.M112.436972. [DOI] [PMC free article] [PubMed] [Google Scholar]
- Engel K, Wang J. Interaction of organic cations with a newly identified plasma membrane monoamine transporter. Mol. Pharmacol. 2005;68:1397–1407. doi: 10.1124/mol.105.016832. [DOI] [PubMed] [Google Scholar]
- Engel K, Zhou M, Wang J. Identification and characterization of a novel monoamine transporter in the human brain. J. Biol. Chem. 2004;279:50042–50049. doi: 10.1074/jbc.M407913200. [DOI] [PubMed] [Google Scholar]
- Ho HT, Wang J. Tyrosine 112 is essential for organic cation transport by the plasma membrane monoamine transporter. Biochemistry. 2010;49:7839–7846. doi: 10.1021/bi100560q. [DOI] [PMC free article] [PubMed] [Google Scholar]
- Koepsell H, Schmitt BM, Gorboulev V. Organic cation transporters. Rev. Physiol. Biochem. Pharmacol. 2003;150:36–90. doi: 10.1007/s10254-003-0017-x. [DOI] [PubMed] [Google Scholar]
- Koepsell H, Lips K, Volk C. Polyspecific organic cation transporters: structure function, physiological roles, and biopharmaceutical implications. Pharm. Res. 2007;24:1227–1251. doi: 10.1007/s11095-007-9254-z. [DOI] [PubMed] [Google Scholar]
- Koepsell H. Polyspecific organic cation transporters: their functions and interactions with drugs. Trends Pharmacol. Sci. 2004;25:375–381. doi: 10.1016/j.tips.2004.05.005. [DOI] [PubMed] [Google Scholar]
- Nakamichi N, Shima H, Asano S, Ishimoto T, Sugiura T, Matsubara K, Kusuhara H, Sugiyama Y, Sai Y, Miyamoto K, Tsuji A, Kato Y. Involvement of carnitine/organic cation transporter OCTN1/SLC22A4 in gastrointestinal absorption of metformin. J. Pharm. Sci. 2013;102:3407–3417. doi: 10.1002/jps.23595. [DOI] [PubMed] [Google Scholar]
- Okura T, Kato S, Takano Y, Sato T, Yamashita A, Morimoto R, Ohtsuki S, Terasaki T, Deguchi Y. Functional characterization of rat plasma membrane monoamine transporter in the blood-brain and blood-cerebrospinal fluid barriers. J. Pharm. Sci. 2011;100:3924–3938. doi: 10.1002/jps.22594. [DOI] [PubMed] [Google Scholar]
- Sweet DH, Pritchard JB. rOCT2 is a basolateral potential-driven carrier, not an organic cation/proton exchanger. Am. J. Physiol. 1999;277:F890–F898. doi: 10.1152/ajprenal.1999.277.6.F890. [DOI] [PubMed] [Google Scholar]
- The Guideline Development Group. Management of diabetes from preconception to the postnatal period: summary of NICE guidance. BMJ. 2008;336:714–717. doi: 10.1136/bmj.39505.641273.AD. [DOI] [PMC free article] [PubMed] [Google Scholar]
- Wright SH, Dantzler WH. Molecular and cellular physiology of renal organic cation and anion transport. Physiol. Rev. 2004;84:987–1049. doi: 10.1152/physrev.00040.2003. [DOI] [PubMed] [Google Scholar]
- Xia L, Engel K, Zhou M, Wang J. Membrane localization and pH-dependent transport of a newly cloned organic cation transporter (PMAT) in kidney cells. Am. J. Physiol. Renal Physiol. 2007;292:F682–F690. doi: 10.1152/ajprenal.00302.2006. [DOI] [PMC free article] [PubMed] [Google Scholar]
- Yamaoka K, Tanigawara T, Nakagawa T, Uno T. A pharmacokinetic analysis program (MULTI) for microcomputer. J. Pharmacobiodyn. 1981;4:879–885. doi: 10.1248/bpb1978.4.879. [DOI] [PubMed] [Google Scholar]
- Zhou M, Xia L, Wang J. Metformin transport by a newly cloned proton-stimulated organic cation transporter (plasma membrane monoamine transporter) expressed in human intestine. Drug Metab. Dispos. 2007a;35:1956–1962. doi: 10.1124/dmd.107.015495. [DOI] [PMC free article] [PubMed] [Google Scholar]
- Zhou M, Xia L, Engel K, Wang J. Molecular determinants of substrate selectivity of a novel organic cation transporter (PMAT) in the SLC29 family. J. Biol. Chem. 2007b;282:3188–3195. doi: 10.1074/jbc.M609421200. [DOI] [PMC free article] [PubMed] [Google Scholar]
- Zhou M, Duan H, Engel K, Xia L, Wang J. Adenosine transport by plasma membrane monoamine transporter: reinvestigation and comparison with organic cations. Drug Metab. Dispos. 2010;38:1798–1805. doi: 10.1124/dmd.110.032987. [DOI] [PMC free article] [PubMed] [Google Scholar]


