Abstract
Growth hormone receptor knockout mice (GHRKO) are characterized by high insulin sensitivity and extended lifespan. Interestingly, the secretory activity of visceral fat in GHRKO mice is altered, stimulating whole body insulin sensitivity. In this study, we transplanted normal (N) mice with visceral fat pads from GHRKO or N mice to determine the role of visceral fat on the insulin signaling. We found that the transplant of visceral fat from GHRKO mice to N mice (N-GHRKO) improved whole body insulin sensitivity when comparing with sham-operated mice (N-S) and with mice that received visceral fat from N mice (N-N). This was associated with increased hepatic insulin sensitivity as observed by the increased phosphorylated insulin receptor and increased hepatic expression of Pparα and Pparγ. In conclusion, we demonstrated that visceral fat transplant from GHRKO mice into normal mice enhanced insulin sensitivity and glucose tolerance. These results further confirm the differential physiological role played by visceral adipose tissue from GH receptor deficient mice, indicating that the increase of this fat depot can be associated with beneficial effects on insulin signaling and longevity.
Keywords: GHRKO, GHR, Insulin resistance, Longevity, Type 2 diabetes
Introduction
The growth hormone receptor knockout (GHRKO) mice, also known as Laron dwarf mice, are characterized by very low levels of circulating insulin-like growth factor I (IGF-I), smaller adult body size, and extended longevity (List et al. 2011). These mice also have remarkably increased whole body insulin sensitivity (List et al. 2011). Among all the metabolic characteristics of long-lived mice, as the GHRKO, Ames dwarf (df/df), and calorie restriction (CR), whole body insulin sensitivity is proposed to be a central player in the extended lifespan phenotype (Bowen and Atwood 2004).
Despite GHRKO mice being smaller and having increased insulin sensitivity, they are also unexpectedly obese (List et al. 2011; Masternak et al. 2012). Moreover, with the absence of GH signaling, the secretory activity of visceral fat in GHRKO mice is modified (Masternak et al. 2012). Larger depots of visceral adipose tissue increase the risk of insulin resistance, metabolic syndrome, and type 2 diabetes, mostly because of secreted high levels of pro-inflammatory cytokines (Item and Konrad 2012). However, visceral fat from GHRKO mice produces less resistin, leptin, tumor necrosis factor α (TNFα), and interleukin 6 (IL-6) (Masternak et al. 2012). Importantly, visceral fat removal from GHRKO mice is associated with a reduction in adiponectin circulating levels (Masternak et al. 2012). Increased adiponectin and reduced pro-inflammatory cytokines in serum are associated with increased overall body insulin sensitivity (Salih and Brunet 2008; Atwood and Bowen 2011). Even though GHRKO mice have increased visceral obesity, they are insulin sensitive and have a healthy extended life span, making them a healthy obese mice model (List et al. 2011; Masternak et al. 2012).
Visceral fat removal from normal mice improved insulin sensitivity and increased lifespan, yet visceral fat removal from GHRKO mice had the opposite effect on insulin signaling (Masternak et al. 2012). Despite that, visceral fat removal in GH-deficient Ames dwarf (df/df) mice did not improve insulin sensitivity as it was observed in N mice (Menon et al. 2014). Therefore, this indicates that the role of visceral fat in the GHRKO mice diverges from its role in normal mice in the regulation of insulin signaling (Masternak et al. 2012). In humans, the expression of the GHR in the visceral adipose tissue is reduced in obese individuals and is lower in subcutaneous than in visceral fat in lean individuals (Erman et al. 2011a, b). Therefore, our previous work implementing early life GH therapy or surgical visceral fat removal in N and GHRKO mice strongly suggests that the function of the visceral adipose tissue seems to be modulated by GH action. We believe that presented in this paper, study that incorporated visceral fat transplant between GHRKO and N mice provides novel in vivo approach to investigate the role of GH on insulin signaling in white adipose tissue and possible implication in longevity.
Materials and methods
Animals and visceral fat transplant
In the present study, 6-months-old male GHRKO and normal (N) mice were used, divided in three groups: normal-sham mice submitted to surgery but not receiving visceral fat (N-S; n = 10), N mice transplanted with visceral fat from N mice (N-N; n = 10), and N mice receiving visceral fat from GHRKO mice (N-GHRKO; n = 10). All the procedures in this study were approved by the Institutional Animal Care and Use Committee from University of Central Florida.
For the visceral fat transplant, visceral fat donors N and GHRKO mice were anesthetized with isoflurane and euthanized. Visceral fat was collected and placed in chilled sterile saline solution. At the same time, the recipient mice (n = 30 N mice, as described above) were anesthetized. The mice received ibuprofen (1 mg/mL) in the water beginning 2 days prior to surgery and 3 days after. The visceral fat collected from donor mice was minced with a scalpel and then the abdomen of the recipient mice was open by an incision in the midline central flank and the fat placed into the visceral cavity. In the sham group (N-S), the abdominal cavity was surgically opened and the visceral fat located, but no transplant was performed. The transplanted fat corresponded to 3% of the body weight of the recipient.
Glucose and insulin tolerance test
Eight days after surgery, the mice were subjected to a glucose tolerance test (GTT). Animals were fasted overnight (approximately 12–16 h) and using standard glucometers, a drop of blood was collected and the basal glucose level was checked. After the initial reading, the mice were injected with 2 g of glucose per kilogram of body weight, and blood glucose concentrations were measured again at 15, 30, 60, 90, and 120 min after the first reading.
The insulin tolerance test (ITT) was performed 2 days after the GTT. For the ITT mice, food was removed 1 h before the test. A drop of blood was collected and glucose concentration was measured using a glucometer. After the initial measurement, the mice were injected with 1 IU of insulin per kilogram of body weight. After that, the blood glucose concentrations were measured again at 15, 30, and 60 min after insulin injection.
Insulin stimulation and tissue collection
Twelve days after surgery (4 days after the GTT), mice were fasted overnight (approximately 12–16 h) and euthanized. Mice were bled by cardiac puncture and whole blood was centrifuged in order to isolate the plasma supernatant. Liver tissue was also collected and snap-frozen in liquid nitrogen. Two minutes before euthanasia, half of the mice were injected with a dose of insulin (10 IU/kg body weight; n = 5/group), while the other half were injected with saline as controls (n = 5/group) (Masternak et al. 2012).
RNA extraction and gene expression
About 75 mg of the liver tissue sample was homogenized with 0.5 mm zirconium oxide beads and 700 μL of Qiazol (Qiagen, Valencia, CA, USA). Total RNA was isolated using the Qiagen RNeasy Mini Kit (Qiagen) columns following the manufacturer’s instructions. RNA concentration was measured by spectrophotometer and 1 μg of total RNA was converted into complementary DNA (cDNA) using the iScript reverse transcription kit (Bio-Rad Laboratories, Hercules, CA, USA). The cDNA samples were diluted at 10 ng/uL and stored at −20 °C.
Real-time PCR using SYBR Green dye was used to evaluate hepatic gene expression. The primers used in this study are listed in Table 1. PCR reactions were performed in duplicate, by adding 5 μL of SYBR Green Master Mix (Applied Biosystems, Foster City, CA, USA), 0.4 μL of forward and reverse primers (10 μM solution), and 2 μL of each cDNA sample, in a total volume of 20 μL. Fluorescence was quantified using the Applied Biosystems 7900 HT Fast RT-PCR system (Applied Biosystems). For each assay, 45 PCR cycles were run (95 °C for 3 s and 62 °C for 30 s), and a dissociation curve was included at the end of the reaction to verify the amplification of a single PCR product. Each assay included a negative control using RNase free water.
Table 1.
Primer sequences used for gene expression analysis
| Genes | Primer sequences (forward and reverse) |
|---|---|
| B2m | F: 5′-AAGTATACTCACGCCACCCA-3′ |
| R: 5′-CAG CGCTATGTATCAGTCTC-3′ | |
| Ir | F: 5′-GTTCTTTCCTGCGTGCATTTCCCA-3′ |
| R: 5′-ATCAGGGTGGCCAGTGTGTCTTTA-3′ | |
| Irs1 | F: 5′- AGCCCAAAAGCCCAGGAGAATA-3′ |
| R: 5′-TTCCGAGCCAGTCTCTTCTCTA-3′ | |
| Pi3k | F: 5′-TAGCTGCATTGGAGCTCCTT-3′ |
| R: 5′-TACGAACTGTGGGAGCAGAT-3′ | |
| Akt2 | F: 5-GAGGACCTTCCATGTAGACT-3′ |
| R: 5′-CTCAGATGTGGAAGAGTGAC-3′ | |
| Pparα | F: 5′-GTCAGTACTGTCGGTTTCAG-3′ |
| R: 5′-CAGATCAGCAGACTCTGGGT-3′ | |
| Pparγ | F: 5′-GGGAAAGACCAGCAACC-3′ |
| R: 5′-TGGAAGAATCGGACCTCTGC-3′ | |
| Pgc1α | F: 5′-TACGCAGGTCGAACGAAACT-3′ |
| R: 5′-TGCTCTTGGTGGAAGCA-3′ | |
| Igf1 | F: 5′-CTGAGCTGGTGGATGCTCTT-3′ |
| R: 5′-CACTCATCCACACCTGT-3′ | |
| Stat3 | F: 5′-AGAAAGTGTCCTACAAGGGCGAC-3′ |
| R: 5′-CACGAAGGCACTCTTCATTAAGTTT-3′ | |
| Stat1 | F: 5′-CGACCAGTACAGCCGCTTTT-3′ |
| R: 5′-CGGGGATCTTCTTGGAAGTTATCCT-3′ | |
| Gs3kb | F: 5′-TATTTCCTGGGGACAGTGGT-3′ |
| R: 5′-ATTTGCTCCCTTGTTGGTGT-3′ | |
| Foxo1 | F: 5′-TATTGAGCGCTTGGACTGTG-3′ |
| R: 5′-TGGACTGCTCCTCAGTTCCT-3′ |
Data was normalized using beta-2 microglobulin (B2m) as a housekeeping gene. To calculate the relative expression, the equation 2A−B/2C−D was used, where A is the threshold cycle number of the first control sample of the gene of interest, B is the threshold cycle number in each gene of interest sample, C is the threshold cycle value of the first B2M in the control sample, and D is the threshold cycle number of B2M in each sample. The formula resulted in a relative expression of 1 for the first control sample, and then all the other samples were calculated in relation to the first sample. After that, the average of the N-S group was calculated and used as a denominator for the other groups’ average to calculate the fold change in gene of expression compared to the control group (Masternak et al. 2005).
Liver IR and GSK3b protein levels
Total protein was extracted from about 100 mg of liver tissue using the Tissue Protein Extraction Reagent kit (Thermo Scientific, Rockford, IL, USA), using protease and phosphatase inhibitors. Samples were homogenized in the extraction buffer with 0.5 mm zirconium oxide beads. After centrifugation at 15,000 rcf for 15 min at 4 °C, the aqueous layer was transferred into a new tube and centrifuged again. The fat-free protein extract was first diluted 1:10 and then stored at −80 °C. Total protein concentration was measured using the Pierce BCA Protein Assay (Thermo Scientific). After that, the level of total IR and its phosphorylated form (pY1158 IR) and GSK3b were analyzed using commercially available ELISA kit (Invitrogen, Carlsbad, CA, USA) following the manufacturer’s protocol.
Serum insulin and leptin concentrations
The collected plasma was used for insulin, leptin, and adiponectin concentration analysis using mouse insulin (Linco Research Inc., St. Charles, MO, USA), leptin (IDS Inc., Fountain Hills, AZ, USA), and adiponectin (Invitrogen, Grand Island, NY, USA) ELISA kits following the manufacturer’s protocols.
The overall insulin sensitivity was estimated using the Homeostatic Model of Assessment (HOMA), representing relation between insulin and glucose concentrations, calculated by the formula (insulin × glucose) / 22.5 (Matthews et al. 1985).
Statistical analysis
Statistical analysis was performed using the GraphPad Prism 5 software (GraphPad Software Inc., La Jolla, CA, USA). Gene expression and protein levels were compared between groups by one-way ANOVA and when significant, a two-tailed unpaired t test was performed to identify between groups comparison. For GTT and ITT, two-way ANOVA for repeated measures was used and the P values for time, treatment, and its interaction are presented. A P value lower than 0.05 was considered statistically significant.
Results
Effect of visceral fat transplant on insulin sensitivity and glucose tolerance
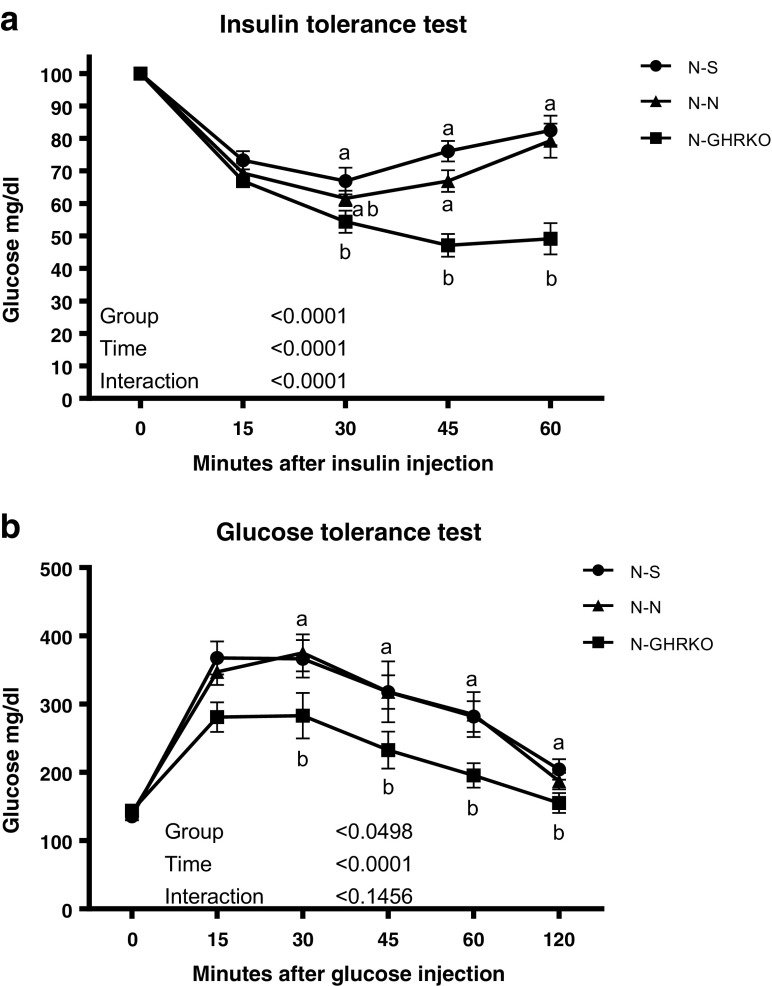
Thehe ITT study indicated that N-GHRKO mice have higher insulin sensitivity than N-N and N-S mice (P < 0.05; Fig. 1a). There was no difference in insulin sensitivity between N-N and N-S mice (P > 0.05; Fig. 1a). Similarly, the GTT results indicated that transplanting GHRKO visceral fat into N mice improved glucose clearance in comparison to N-N and N-S mice (P < 0.05, Fig. 1). There was no difference in glucose clearance between N-N and N-S mice (P > 0.05, Fig.1).
Fig. 1.
Glucose tolerance test (GTT) and insulin tolerance test (ITT) measured by blood glucose concentrations in normal (N) mice subjected to sham surgery (N-S), or receiving visceral fat transplant from N (N-N) or GHRKO mice (N-GHRKO). Different letters indicate significant difference at P < 0.05 at each timepoint between groups
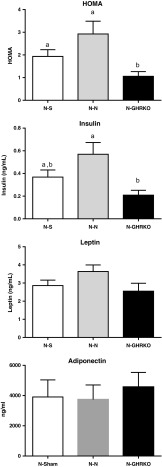
Normal mice transplanted with GHRKO visceral fat had a lower HOMA score, indicating improved whole body insulin sensitivity compared to N-N and N-S groups (P < 0.05, Fig. 2). HOMA score was not different between N-N and N-S mice (P > 0.05, Fig. 2). Moreover, plasma insulin concentration was lower in N-GHRKO mice compared to N-N groups (P < 0.05, Fig. 2), yet there was no statistical difference between N-GHRKO and N-S mice (P > 0.05, Fig. 2). Plasma leptin and adiponectin concentrations were not different among groups (P > 0.05, Fig. 2).
Fig. 2.
Insulin sensitivity measured by HOMA analysis and plasma insulin and leptin concentrations of normal (N) mice subjected to sham surgery (N-S), or receiving visceral fat transplant from N (N-N) or GHRKO mice (N-GHRKO). Different letters indicate statistical difference at P < 0.05
Effect of visceral fat transplant on liver insulin signaling and gene expression
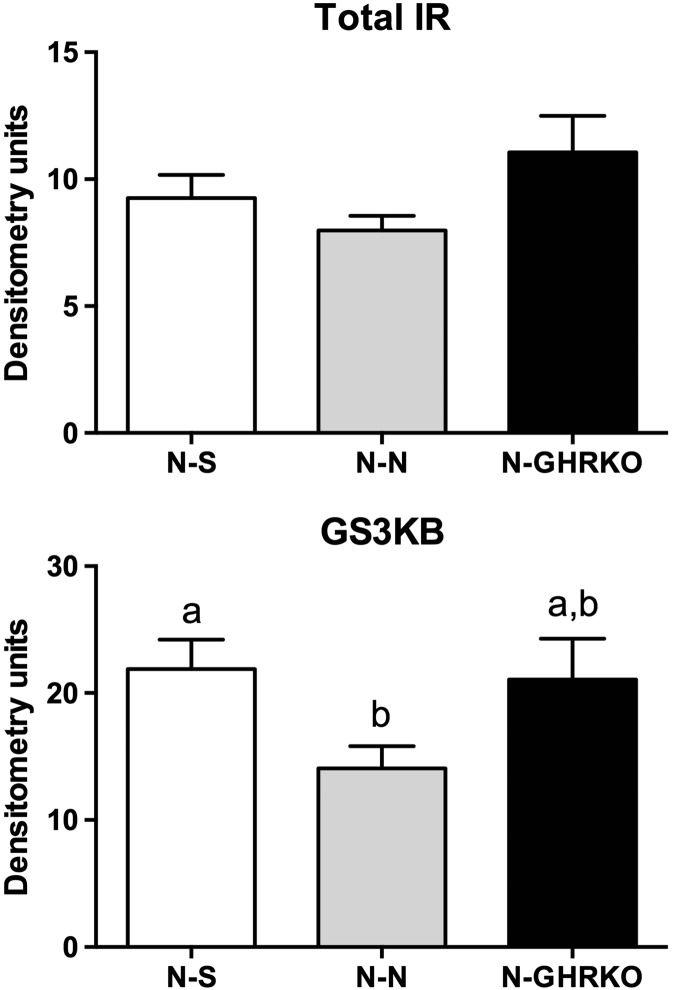
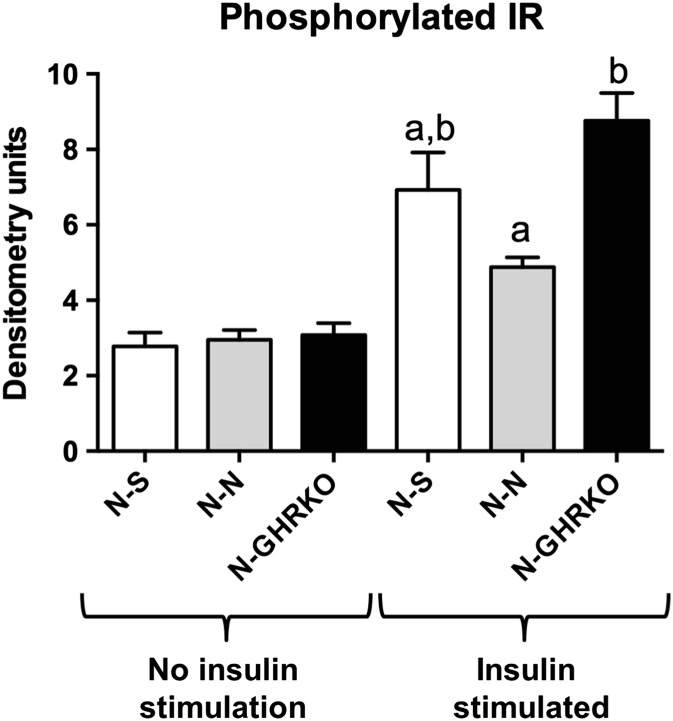
Total IR protein levels were not different among groups (P > 0.05, Fig. 3). The level of GSK3b in the liver was decreased in N-N mice compared to N-S (P < 0.05) but not different between N-N and N-GHRKO mice (P > 0.05, Fig. 3). The level of liver-phosphorylated IR was not different among groups not stimulated with insulin before euthanasia (P > 0.05, Fig. 4). However, the level of phosphorylated IR was increased in N-GHRKO mice compared to N-N mice (P < 0.05), although not different from N-S mice in insulin-stimulated mice (P < 0.05, Fig. 4).
Fig. 3.
Protein expression of IR and GSK3b in the liver of normal (N) mice subjected to sham surgery (N-S), or receiving visceral fat transplant from N (N-N) or GHRKO mice (N-GHRKO). Different letters indicate statistical difference at P < 0.05
Fig. 4.
Protein expression of phosphorylated IR in the liver with and without insulin stimulus before euthanasia of normal (N) mice subjected to sham surgery (N-S), or receiving visceral fat transplant from N (N-N) or GHRKO mice (N-GHRKO). Different letters indicate statistical difference at P < 0.05
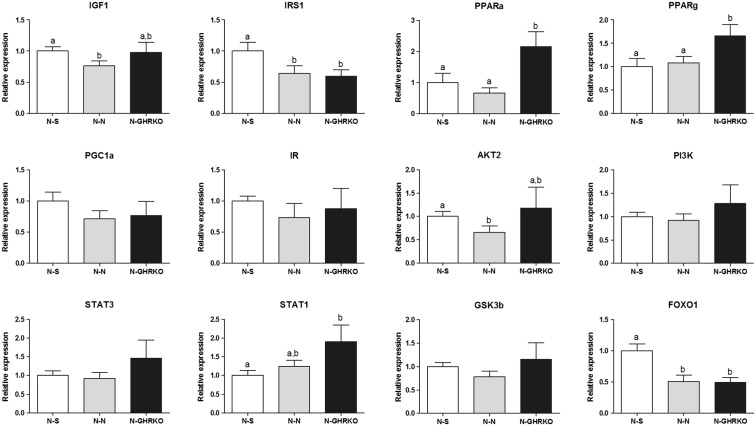
Analysis of the hepatic messenger RNA (mRNA) expression of different genes related to insulin signaling pathway revealed that the mRNA expression of Pparα and Pparγ was increased in N-GHRKO compared to N-N and N-S mice (P < 0.05; Fig. 5). Gene expression of Igf1and Akt2 mRNA was decreased in N-N when compared to N-S mice (P < 0.05), but no change was observed between N-GHRKO mice and N-N mice (P > 0.05, Fig. 5). Foxo1 and Irs1 gene expression was decreased in N-GHRKO and N-N mice in comparison to N-S mice (P < 0.05, Fig. 5). Expression of Stat1 was higher in N-GHRKO mice than N-S mice (P > 0.05), but no different from N-N mice (P > 0.05, Fig. 5). In addition, gene expression for Ir, Glut2, Gsk3b, Pgc1α, and Stat3 was not different among groups (P > 0.05; Fig. 5).
Fig. 5.
Relative gene expression in the liver of normal (N) mice subjected to sham surgery (N-S), or receiving visceral fat transplant from N (N-N) or GHRKO mice (N-GHRKO). Different letters indicate statistical difference at P < 0.05
Discussion
The present study provides novel evidence that transplant of visceral fat from GHRKO mice into N mice improved whole body insulin sensitivity, indicated by the ITT and GTT, and decreased plasma insulin concentrations. GHRKO mice are characterized by increased insulin sensitivity and extended life span (Coschigano et al. 2003). A previous study indicated that removal of visceral fat from GHRKO mice paradoxically decreased insulin sensitivity, while improved insulin sensitivity in N mice (Masternak et al. 2012). This suggests a different endocrine role for the visceral fat in GH receptor-deficient mice. Surgical removal of visceral fat is known to improve insulin sensitivity in rats and mice (Barzilai et al. 1999; Gabriely et al. 2002; Masternak et al. 2012; Menon et al. 2014). The visceral adipose tissue is considered the “bad fat” and its larger depots are associated with increased levels of pro-inflammatory cytokines, which in turn lead to reduce whole body insulin sensitivity (Item and Konrad 2012). However, the visceral fat of GHRKO mice has reduced infiltration of inflammatory cells and therefore is associated with a less intense inflammatory potential (Masternak et al. 2012; Berryman et al. 2013), which can contribute to the increased insulin sensitivity in GHRKO mice, despite having increased fat mass (List et al. 2011). Importantly, microarray study of epididymal, subcutaneous, and perirenal adipose tissue showed partial overlapping of gene expression between different WAT pads in GHRKO mice, while there was more distinct distribution of gene expression profile between WAT pads in N mice (Stout et al. 2015). This finding suggests that visceral fat from GHRKO mice might act more like metabolically beneficial subcutaneous fat, which could explain observed benefits on insulin sensitivity after GHRKO epididymal fat transplant in to N recipient mice. Visceral fat removal in GH-deficient df/df mice reduced insulin sensitivity (Menon et al. 2014), although the effect was not as clear as observed for GHRKO mice (Masternak et al. 2012). Therefore, these results suggest that visceral fat from GHRKO mice may play a different endocrine role. This positive effect can also be observed when the fat tissue transferred to N mice, indicating an active secretory role for this tissue on the maintenance of glucose homeostasis.
The transplant of visceral fat from GHRKO to N mice was also associated with increased stimulated phosphorylated insulin receptor, indicating an overall improved hepatic insulin sensitivity. Visceral fat removal was previously associated with improved hepatic insulin sensitivity in rats (Barzilai et al. 1999; Gabriely et al. 2002). Therefore, our observations of improved hepatic insulin sensitivity further evidence the opposite role played by visceral fat in GHRKO mice. It was previously demonstrated that visceral fat removal in GHRKO mice decreases serum adiponectin levels, while it increased serum leptin levels (Masternak et al. 2012), indicating an anti-inflammatory role for the visceral adipose tissue of GHRKO mice. Despite that, we did not found any changes in serum leptin levels in the current study. Furthermore, visceral fat removal in N mice leads to reduced secretion of pro-inflammatory cytokines (Shin et al. 2015), which can contribute to the improved whole body insulin sensitivity. Therefore, the observed improvements of insulin sensitivity and specifically the liver insulin sensitivity, in mice receiving fat from GHRKO mice, maybe related to the anti-inflammatory properties of this fat depot. GSK3B is negatively regulated by insulin and its inhibition is associated with increased insulin sensitivity (Nikoulina et al. 2000). We observed that N-GHRKO mice had increased pGSK3b in comparison to N-N mice, although it was not different from N-S mice.
The visceral fat transplant from GHRKO to N mice led to the regulation of several hepatic genes involved in the insulin signaling. The two most important differences between N-N and N-GHRKO mice were the increased expression of PPARα and PPARγ. PPARα up-regulates genes involved in lipid oxidation (Leone et al. 1999) and PPARγ regulates adipogenesis and liver insulin sensitivity (He et al. 2003). PPARγ activation through thiazolidinediones results in increased whole body insulin sensitivity (Leonardini et al. 2009). Increased PPARα and PPARγ liver expression is associated with increase insulin sensitivity in both calorie restriction and GHRKO mice (Masternak and Bartke 2007). Therefore, hepatic PPARα and PPARγ expression can be a link between visceral fat and increased insulin sensitivity. Other genes were not significantly changed between N-N and N-GHRKO mice. Visceral fat removal in N mice was associated with increased expression of IR, IRS2, Pi3K, Akt2, Glut4, PPARγ, and PGC1α in the muscle tissue, although no difference in the expression of these genes was observed in subcutaneous fat tissue (Menon et al. 2014). This indicates that the mechanism of action may be different in the various insulin target tissues, and at least in the liver, it seems to be coordinated by the PPARα and PPARγ.
In conclusion, we demonstrated that visceral fat transplant from GHRKO mice into normal mice enhanced insulin sensitivity and glucose tolerance in this last mentioned kind of animals. This was associated with increased liver insulin sensitivity, suggesting the hepatic insulin resistance as an important target of visceral fat. These results further confirm the differential physiological role played by visceral adipose tissue from GH receptor deficient mice, indicating that the increase of this fat depot can be associated with beneficial effects on insulin signaling and longevity.
Acknowledgements
This work was supported by the National Institute on Aging (NIA) and NIDDK (grant numbers AG031736, AG032290, AG19899, DK081413) and Polish National Science Centre (DEC-2012/04/M/NZ4/00198; grant number 507/1-107-05/507-10-050 of the Medical University of Lodz, Poland to A.G.).
Compliance with ethical standards
All the procedures in this study were approved by the Institutional Animal Care and Use Committee of the University of Central Florida.
References
- Atwood CS, Bowen RL. The reproductive-cell cycle theory of aging: an update. Exp Gerontol. 2011;46(2–3):100–107. doi: 10.1016/j.exger.2010.09.007. [DOI] [PubMed] [Google Scholar]
- Barzilai N, She L, Liu BQ, Vuguin P, Cohen P, Wang J, Rossetti L. Surgical removal of visceral fat reverses hepatic insulin resistance. Diabetes. 1999;48(1):94–98. doi: 10.2337/diabetes.48.1.94. [DOI] [PubMed] [Google Scholar]
- Berryman DE, Glad CA, List EO, Johannsson G. The GH/IGF-1 axis in obesity: pathophysiology and therapeutic considerations. Nat Rev Endocrinol. 2013;9(6):346–356. doi: 10.1038/nrendo.2013.64. [DOI] [PubMed] [Google Scholar]
- Bowen RL, Atwood CS. Living and dying for sex. A theory of aging based on the modulation of cell cycle signaling by reproductive hormones. Gerontology. 2004;50(5):265–290. doi: 10.1159/000079125. [DOI] [PubMed] [Google Scholar]
- Coschigano KT, Holland AN, Riders ME, List EO, Flyvbjerg A, Kopchick JJ. Deletion, but not antagonism, of the mouse growth hormone receptor results in severely decreased body weights, insulin, and insulin-like growth factor I levels and increased life span. Endocrinology. 2003;144(9):3799–3810. doi: 10.1210/en.2003-0374. [DOI] [PubMed] [Google Scholar]
- Erman A, Veilleux A, Tchernof A, Goodyer CG. Human growth hormone receptor (GHR) expression in obesity: I. GHR mRNA expression in omental and subcutaneous adipose tissues of obese women. Int J Obes. 2011;35(12):1511–1519. doi: 10.1038/ijo.2011.23. [DOI] [PubMed] [Google Scholar]
- Erman A, Wabitsch M, Goodyer CG. Human growth hormone receptor (GHR) expression in obesity: II. Regulation of the human GHR gene by obesity-related factors. Int J Obes. 2011;35(12):1520–1529. doi: 10.1038/ijo.2011.10. [DOI] [PubMed] [Google Scholar]
- Gabriely I, Ma XH, Yang XM, Atzmon G, Rajala MW, Berg AH, Scherer P, Rossetti L, Barzilai N. Removal of visceral fat prevents insulin resistance and glucose intolerance of aging: an adipokine-mediated process? Diabetes. 2002;51(10):2951–2958. doi: 10.2337/diabetes.51.10.2951. [DOI] [PubMed] [Google Scholar]
- He W, Barak Y, Hevener A, Olson P, Liao D, Le J, Nelson M, Ong E, Olefsky JM, Evans RM. Adipose-specific peroxisome proliferator-activated receptor gamma knockout causes insulin resistance in fat and liver but not in muscle. Proc Natl Acad Sci U S A. 2003;100(26):15712–15717. doi: 10.1073/pnas.2536828100. [DOI] [PMC free article] [PubMed] [Google Scholar]
- Item F, Konrad D. Visceral fat and metabolic inflammation: the portal theory revisited. Obes Rev. 2012;13(Suppl 2):30–39. doi: 10.1111/j.1467-789X.2012.01035.x. [DOI] [PubMed] [Google Scholar]
- Leonardini A, Laviola L, Perrini S, Natalicchio A, Giorgino F. Cross-talk between PPARgamma and insulin signaling and modulation of insulin sensitivity. PPAR Res. 2009;2009:818945. doi: 10.1155/2009/818945. [DOI] [PMC free article] [PubMed] [Google Scholar]
- Leone TC, Weinheimer CJ, Kelly DP. A critical role for the peroxisome proliferator-activated receptor alpha (PPARalpha) in the cellular fasting response: the PPARalpha-null mouse as a model of fatty acid oxidation disorders. Proc Natl Acad Sci U S A. 1999;96(13):7473–7478. doi: 10.1073/pnas.96.13.7473. [DOI] [PMC free article] [PubMed] [Google Scholar]
- List EO, Sackmann-Sala L, Berryman DE, Funk K, Kelder B, Gosney ES, Okada S, Ding J, Cruz-Topete D, Kopchick JJ. Endocrine parameters and phenotypes of the growth hormone receptor gene disrupted (GHR-/-) mouse. Endocr Rev. 2011;32(3):356–386. doi: 10.1210/er.2010-0009. [DOI] [PMC free article] [PubMed] [Google Scholar]
- Masternak MM, Bartke A. PPARs in calorie restricted and genetically long-lived mice. PPAR Res. 2007;2007:28436. doi: 10.1155/2007/28436. [DOI] [PMC free article] [PubMed] [Google Scholar]
- Masternak MM, Al-Regaiey KA, Del Rosario Lim MM, Bonkowski MS, Panici JA, Przybylski GK, Bartke A. Caloric restriction results in decreased expression of peroxisome proliferator-activated receptor superfamily in muscle of normal and long-lived growth hormone receptor/binding protein knockout mice. J Gerontol A Biol Sci Med Sci. 2005;60(10):1238–1245. doi: 10.1093/gerona/60.10.1238. [DOI] [PubMed] [Google Scholar]
- Masternak MM, Bartke A, Wang F, Spong A, Gesing A, Fang Y, Salmon AB, Hughes LF, Liberati T, Boparai R, Kopchick JJ, Westbrook R. Metabolic effects of intra-abdominal fat in GHRKO mice. Aging Cell. 2012;11(1):73–81. doi: 10.1111/j.1474-9726.2011.00763.x. [DOI] [PMC free article] [PubMed] [Google Scholar]
- Matthews DR, Hosker JP, Rudenski AS, Naylor BA, Treacher DF, Turner RC. Homeostasis model assessment: insulin resistance and beta-cell function from fasting plasma glucose and insulin concentrations in man. Diabetologia. 1985;28(7):412–419. doi: 10.1007/BF00280883. [DOI] [PubMed] [Google Scholar]
- Menon V, Zhi X, Hossain T, Bartke A, Spong A, Gesing A, Masternak MM. The contribution of visceral fat to improved insulin signaling in Ames dwarf mice. Aging Cell. 2014;13(3):497–506. doi: 10.1111/acel.12201. [DOI] [PMC free article] [PubMed] [Google Scholar]
- Nikoulina SE, Ciaraldi TP, Mudaliar S, Mohideen P, Carter L, Henry RR. Potential role of glycogen synthase kinase-3 in skeletal muscle insulin resistance of type 2 diabetes. Diabetes. 2000;49(2):263–271. doi: 10.2337/diabetes.49.2.263. [DOI] [PubMed] [Google Scholar]
- Salih DA, Brunet A. FoxO transcription factors in the maintenance of cellular homeostasis during aging. Curr Opin Cell Biol. 2008;20(2):126–136. doi: 10.1016/j.ceb.2008.02.005. [DOI] [PMC free article] [PubMed] [Google Scholar]
- Shin JA, Jeong SI, Kim M, Yoon JC, Kim HS, Park EM. Visceral adipose tissue inflammation is associated with age-related brain changes and ischemic brain damage in aged mice. Brain Behav Immun. 2015;50:221–231. doi: 10.1016/j.bbi.2015.07.008. [DOI] [PubMed] [Google Scholar]
- Stout MB, Swindell WR, Zhi X, Rohde K, List EO, Berryman DE, Kopchick JJ, Gesing A, Fang Y, Masternak MM. Transcriptome profiling reveals divergent expression shifts in brown and white adipose tissue from long-lived GHRKO mice. Oncotarget. 2015;6(29):26702–26715. doi: 10.18632/oncotarget.5760. [DOI] [PMC free article] [PubMed] [Google Scholar]


