

Abstract
Aquaporins (AQPs) are a family of small membrane proteins that transport water molecules across the plasma membrane along the osmotic gradient. Mammals express 13 subtypes of AQPs, including the recently reported “subcellular AQPs”, AQP11 and 12. Each organ expresses specific subsets of AQP subtypes, and in the inner ear, AQPs are essential for the establishment and maintenance of two distinct fluids, endolymph and perilymph. To evaluate the contribution of AQPs during the establishment of inner ear function, we used quantitative reverse transcription polymerase chain reaction to quantify the expression levels of all known AQPs during the entire development and maturation of the inner ear. Using systematic and longitudinal quantification, we found that AQP11 was majorly and constantly expressed in the inner ear, and that the expression levels of several AQPs follow characteristic longitudinal patterns: increasing (Aqp0, 1, and 9), decreasing (Aqp6, 8, and 12), and peak of expression on E18 (Aqp2, 5, and 7). In particular, the expression level of Aqp9 increased by 70-fold during P3–P21. We also performed in situ hybridization of Aqp11, and determined the unique localization of Aqp11 in the outer hair cells. Immunohistochemistry of AQP9 revealed its localization in the supporting cells inside the organ of Corti, and in the root cells. The emergence of AQP9 expression in these cells was during P3–P21, which was coincident with the marked increase of its expression level. Combining these quantification and localization data, we discuss the possible contributions of these AQPs to inner ear function.
Keywords: aquaporin, qRT-PCR, inner ear, development
Introduction
Aquaporins (AQPs) are a family of small membrane proteins that transport water molecules across the plasma membrane along the osmotic gradient. Since the initial discovery of the first AQP (AQP1, originally referred to as CHIP) in 1991 (Preston et al. 1992), 13 subtypes (AQP0–12) have been cloned in mammals (Ishibashi et al. 2009). Different organs express different subsets of AQP subtypes, and malfunction of specific AQP subtypes is associated with various pathologies. For example, mutation of AQP0 underlies one form of autosomal dominant cataract (Shiels and Bassnett 1996). In contrast, malfunction of AQP1–4, and 11 are associated with renal pathologies in mouse models, such as urine concentration defect (AQP1 and 4), diabetes insipidus (AQP2 and 3), and polycystic kidney disease (AQP11) (Mulders et al. 1997; Chou et al. 1998; Ma et al. 1998; Ma et al. 2000; Tchekneva et al. 2008).
The inner ear contains two distinct fluids, Na+-rich perilymph and K+-rich endolymph. Dysregulation of water homeostasis is associated with several pathologies in the inner ear, such as endolymphatic hydrops (e.g., Ménière’s disease and acute low-frequency sensorineural hearing loss), and enlargement of the vestibular aqueduct causing progressive hearing loss. Considering the importance of water regulation in the inner ear, it follows that AQPs are essential for normal inner ear function. Indeed, soon after the discovery of AQP1, its presence and localization in the inner ear was demonstrated (Stankovic et al. 1995). Subsequently, localization of seven additional AQP subtypes (AQP2–7, and 9) has been determined in the inner ear (Eckhard et al. 2012a). For example, AQP1 is expressed in a subset of fibrocytes in the spiral ligament bordering the bony cochlear capsule (Stankovic et al. 1995), while AQP4 is expressed in the interdental cells, inner sulcus cells, Hensen’s cells, Claudius’ cells, and root cells (Takumi et al. 1998; Eckhard et al. 2012b). These localization studies provide the essential cellular basis to understand AQP functions in the inner ear. However, characterization of all AQP localization in the inner ear is still incomplete, particularly for the recently reported AQP11 and 12. These two AQPs differ from other “classical” AQPs in their unique distribution at the intracellular membrane, and are referred to as “subcellular AQPs” (Ishibashi et al. 2000; Itoh et al. 2005). Although a transcriptome study of hair cells indicated transcription of Aqp11 in the inner ear (Liu et al. 2014), its exact localization in the inner ear is unknown.
In addition to localization studies, quantification of expression levels is another effective approach to understand which AQP subtypes contribute to water transport in organs. This approach is expected to be particularly effective in the inner ear since its function is closely related to water homeostasis. Furthermore, in the case of the inner ear, longitudinal quantification during development also provides important clues to understand the contribution of AQP subtypes to the formation of the inner ear. It is because the development of the inner ear is closely related to fluid regulation that endolymphatic and perilymphatic spaces must be structured properly (Kelley 2005; Kim and Wangemann 2010), and endolymph must contain higher concentration of K+ ions to acquire endolymphatic potential (Li et al. 2013). Thus, identifying AQP subtypes expressed at each stage of development can indicate their involvement in the morphology or function being established. A previous study combined dot-blot hybridization and quantitative real-time polymerase chain reaction (qRT-PCR) to achieve this purpose (Huang et al. 2002).
The aim of our study was to promote systematic quantification of AQP expression levels. We performed qRT-PCR for all known AQP subtypes, including AQP11 and 12, during the entire inner-ear development, from embryonic day (E) 10 to postnatal day (P) 21. Using our systematic approach, we found that Aqp11 was abundantly expressed, and that the longitudinal expression levels of several AQP subtypes showed characteristic patterns: increasing (Aqp0, 1, and 9), decreasing (Aqp6, 8, and 12), and peak expression on E18 (Aqp2, 5, and 7). In particular, longitudinal quantification revealed that the expression level of Aqp9 increased by 70-fold during P3–P21. In addition to quantification, we performed longitudinal analysis of localization using in situ hybridization (ISH) or fluorescent immunohistochemistry. For AQP11, we determined its unique localization in the outer hair cells (OHCs) using ISH. For AQP9, immunohistochemistry revealed gradual emergence of AQP9 expression sites around the scala media, which was coincident with the 70-fold increase of its expression level during P3–P21. Considering both quantification and localization data, we discuss possible contributions of these AQP subtypes to the establishment of inner-ear function.
Methods
Animals
C57BL6/J mice were purchased from Japan SLC, Inc. (Hamamatsu, Japan). Aqp11 knockout mice were generated as previously described (Morishita et al. 2005). All experiments were performed in accordance with the National Institutes of Health Guidelines for the Care and Use of Laboratory Animals, and were approved by the Animal Research Committee of Kyoto University Graduate School of Medicine (No. 11179; Kyoto, Japan) and Kochi Medical School (No. I-00044; Kochi, Japan).
Extraction of Total RNA from Inner-Ear Tissue and Reverse Transcription
Inner ear tissue containing cochleae and vestibules were obtained from various stages of C57BL6/J mice, including E10, E13, E18, P3, P10, and P21. For the dissection of postnatal mice (P3–P21), the bone tissues were included in the samples. For the dissection of embryonic mice (E10–E18), the boundaries of inner ear samples were determined to match the postnatal samples: mesenchymal tissue around the otocysts was carefully removed for E10 samples, and primitive otic capsules were included for E13 and E18 samples. Samples were immediately immersed in TRIzol® reagent (Invitrogen, USA), and then total RNA was extracted and treated with DNase I (Ambion, USA). Samples were homogenized with a tissue grinder (Wheaton, USA) when necessary. cDNA was synthesized from DNase I-treated total RNA by reverse transcriptase polymerase chain reaction (RT-PCR) using random hexamer primers and TaqMan® Reverse Transcription Reagents (Invitrogen).
Quantification of AQP Expression Levels by Real-Time PCR
The cDNA synthesized from DNase I-treated total RNA was subjected to real-time PCR quantification using an Applied Biosystems StepOnePlus™ Real-Time PCR System (Life Technologies, USA) after being mixed with SYBR® Green Real-Time PCR Master Mix (Life Technologies) and various sets of gene-specific forward and reverse primers (Table 1). Quantification of Aqp10 was omitted since it was reported to be a pseudogene in Mus musculus (Morinaga et al. 2002). All reactions were performed in triplicate. Relative mRNA expression levels were calculated using standard curves obtained from the following standard samples: eye (Aqp0), kidney (Aqp1–4, 6, 7, and 11), lung (Aqp5), liver (Aqp8 and 9), and pancreas (Aqp12). The expression levels were normalized to expression of the housekeeping gene, Rplp0.
TABLE 1.
Nucleotide sequences of primers used for qRT-PCR
| mRNA | Accession No. | Forward primer (5′ to 3′) | Reverse primer (5′ to 3′) |
|---|---|---|---|
| Aqp0 | NM_008600 | CTATCCTGAAGGGAGCCAGA | CAGGGCCTGAGTCTTCAGTT |
| Aqp1 | NM_007472 | CATCACCTCCTCCCTAGTCG | GCACAGTACCAGCTGCAGAG |
| Aqp2 | NM_009699 | TCCTTCGAGCTGCCTTCTAC | GTTGCATTGTTGTGGAGAGC |
| Aqp3 | NM_016689 | GGGATTGTTTTTGGGCTGTA | CAGAGGGATAGGTGGCAAAG |
| Aqp4 | NM_009700 | CCTCATCTCCCTTTGCTTTG | GTGCACACCATGGCTACAGT |
| Aqp5 | NM_009701 | CCACCCTCATCTTCGTCTTC | TGGAGATCTGCAGAATGGTG |
| Aqp6 | NM_175087 | GCTGGTGCTCTGTGTCTTTG | GTTCATGGAACAGCCAGTGA |
| Aqp7 | NM_007473 | TGCCATTAACCACTTTGCAG | CCGCCACAGTGTCATGTATT |
| Aqp8 | NM_007474 | CCATTCTCCATTGGCTTCTC | CCAATGGAAGTCCCAGTAGC |
| Aqp9 | NM_022026 | AGGATGGGGATTTGAGGTCT | GATGAGACCTCCCAGGACAG |
| Aqp10 | (pseudogene in Mus musculus) | ||
| Aqp11 | NM_175105 | GTACTGCATAAGCGCCCTGT | ATGGGATTCCTGCAAGCTAA |
| Aqp12 | NM_177587 | GCCCTACACATCTGCCTTCT | TACACGTGGGCATACTCCAG |
| Rplp0 | NM_007475 | CACTGGTCTAGGCGACAGG | GGTGCCTCTGGAGATTTTCG |
Immunohistochemistry
Whole heads (E10, E13, E15, and E18) and dissected inner ears (P3, P10, and P21) were fixed by immersion in 4 % paraformaldehyde (PFA) for 4 h at 4 °C. For P21 mice, perfusion fixation was performed with 4 % PFA before dissection. The tissues from P10 and P21 were decalcified in 10 % 2,2′,2″,2″’-(ethane-1,2-diyldinitrilo)tetraacetic acid (EDTA)/phosphate-buffered saline (PBS) for 3–4 days at 4 °C. After adjusting the osmotic pressure with 30 % sucrose/PBS overnight, tissues were embedded in Tissue-Tek® O.C.T.™ compound (Sakura, Japan) and frozen at −80 °C. Frozen sections (10-μm thick) were mounted on silane-coated slide glasses (Matsunami Glass, Japan).
The rabbit polyclonal antibodies against AQP5 (ab3559) and AQP9 (ab105148) were purchased from Millipore (USA) and Abcam (USA), respectively. Mouse anti-myosin 7a (Myo7a) monoclonal antibody was purchased from the Developmental Studies Hybridoma Bank (USA), and anti-β-III tubulin (Tuj-1 clone) was purchased from Covance (USA). After permeabilization and blocking with 10 % goat-serum in PBS with 0.2 % Triton-X, primary antibodies (1:200 for anti-AQP, 1:50 for anti-Myo7a, and 1:500–1:1000 for Tuj-1) were applied overnight at 4 °C. Primary antibodies were visualized with an Alexa Fluor 488 or 568 goat anti-rabbit IgG (H + L) antibody or an Alexa Fluor 633 goat anti-mouse IgG (H + L) antibody (Life Technologies) diluted at 1:500. Actin filaments were stained with Alexa Fluor 568 phalloidin (0.4 units/μL; Life Technologies). Nuclei were counterstained with 4′, 6′-diamidino-2-phenylindole (DAPI).
In Situ Hybridization (ISH)
Frozen sections were prepared as described in the immunohistochemistry section, except that the duration of fixation was longer (in 4 % PFA overnight at 4 °C), and the sections were thicker (12 μm). P21 tissues were decalcified with a 1:1 mixture of RNase-free 0.5 M EDTA, pH 8.0 (Nacalai Tesque, Japan) and autoclaved PBS (WAKO, Japan). The osmolality was adjusted with RNase-free 30 % sucrose/PBS solution. The template used as a probe was amplified from mouse Aqp11 (NCBI accession number: BAC45005) with primers 5′-TCTAGCTACCTTCCAGCTCTGC-3′ and 5′-AGACACCTTCCACAGAGAAAGC-3′, and then inserted into the pGEM®-T Easy vector (Promega, USA). Probes were synthesized using the DIG RNA Labeling Kit (Roche, Switzerland) with SP6 or T7 RNA polymerase after digestion with SalI-HF or ApaI (New England Biolabs, USA).
Before hybridization, the sections were re-fixed with 4 % PFA and 0.2 % glutaraldehyde, bleached with 6 % hydrogen peroxidase, treated with proteinase K (20 μg/μL, Roche) for 4 min, and re-fixed. The sections were then incubated in prehybridization solution (50 % formamide [Nacalai Tesque], 5 x SSC [Nacalai Tesque; adjusted to pH 4.5 with citrate], 1 % SDS, 50 μg/mL yeast RNA [Ambion], and 50 μg/mL heparin [Sigma-Aldrich, USA]) at 60 °C for 2 h. Next, DIG-labeled RNA probes were hybridized to the sections at 58–60 °C for 20–24 h. After transferring into Tris-buffered saline (TBS), the sections were blocked with 7.5 % sheep serum (Sigma-Aldrich), and incubated with a 1:4000 dilution of Anti-Digoxigenin-AP, Fab fragments (Roche) at 4 °C overnight. To detect the hybridized probes, slides were dipped in nitro-blue tetrazolium chloride (Roche) and 5-bromo-4-chloro-3-indolyl phosphate (Roche) solution. Samples were subjected to immunohistochemistry using an anti-Myo7a antibody after ISH. After blocking with 10 % goat-serum in PBS:0.2%Triton-X, rabbit polyclonal anti-Myo7a antibody (1:1000, GeneTex, USA) was applied overnight at 4 °C and then visualized with an Alexa Fluor 568 goat anti-rabbit IgG (H + L) antibody (1:500).
Auditory Brainstem Response (ABR)
Aqp11 −/− and wild-type mice at 3–4 weeks were placed in a sound isolation booth after general anesthesia with pentobarbital. Electrical signals were recorded by inserting stainless steel needles subcutaneously at the measured ear (active), contralateral ear (reference), and vertex (ground), using the Neuropack S1 MEB-9402 amplifier (Nihon Koden, Japan). Click sounds were generated by the RZ6-A sound processor (Tucker Davis Technologies, USA), and outputted from the condenser speaker, ES-1 (Tucker Davis Technologies) to exhibit through speaker cones cannulated into the mice ears. Sound stimuli were repeated 512 times, and at each exposure, electrical signals between the vertex and measured ears were amplified and averaged. The sound stimuli were rarefaction clicks. Click intensity was varied from 100 to 40 dB in 10 dB decrements, and finally decreased to 35 dB SPL. Waves I–V were identified by the waveform and latency, as described previously (Zhou et al. 2006). Thresholds were determined using wave I. Sample numbers were 7 for Aqp11 −/−, and 4 for wild-type. Statistical analysis was performed using Welch’s test and a p value below 0.05 was considered statistically significant.
Results
Aqp1, 4, 9, and 11 Were majorly Expressed in the Mature Inner Ear
We first evaluated the expression levels of all AQPs in the mature inner ear (P21) by qRT-PCR. Evaluation of Aqp10 was omitted since it is a pseudogene in M. musculus (Morinaga et al. 2002). The expression levels were determined using standard curves obtained from the following organs: eye (Aqp0), kidney (Aqp1–4, 6, 7, and 11), lung (Aqp5), liver (Aqp8 and 9), and pancreas (Aqp12). We selected organs that express the particular AQPs at the most abundant levels in the body, based on previous reviews (Yamamoto and Sasaki 1998; Ishibashi et al. 2009), and the gene expression database of the Mouse Genome Informatics (http://www.informatics.jax.org/). Lung and liver were used for Aqp5, 8, and 9 since these AQPs are not abundantly expressed in the kidney. The eye and the pancreas are thought to be the only organs that express Aqp0 and 12, respectively (Yamamoto and Sasaki 1998; Itoh et al. 2005; Ishibashi et al. 2009). The expression levels were normalized to the expression of the housekeeping gene, Rplp0.
Since the amplification efficacy is different between primers, it is difficult to compare the expression levels directly between AQP subtypes even after normalization. Thus, we evaluated the expression levels in the inner ear by comparing to those in standard organs (Fig. 1a). The standard organs expressed the particular AQP subtypes abundantly as described above, and the ratios to the standard samples indicate the approximate abundance of AQPs. The majorly expressed subtypes were Aqp1, 4, 9, and 11, whose expression levels were more than 1 % of the standard samples (Fig. 1a, filled bars). The expression levels of Aqp0, 3, 5, and 7 were 0.1–1 %, and those of Aqp2, 6, 8, and 12 were less than 0.1 %.
FIG. 1.
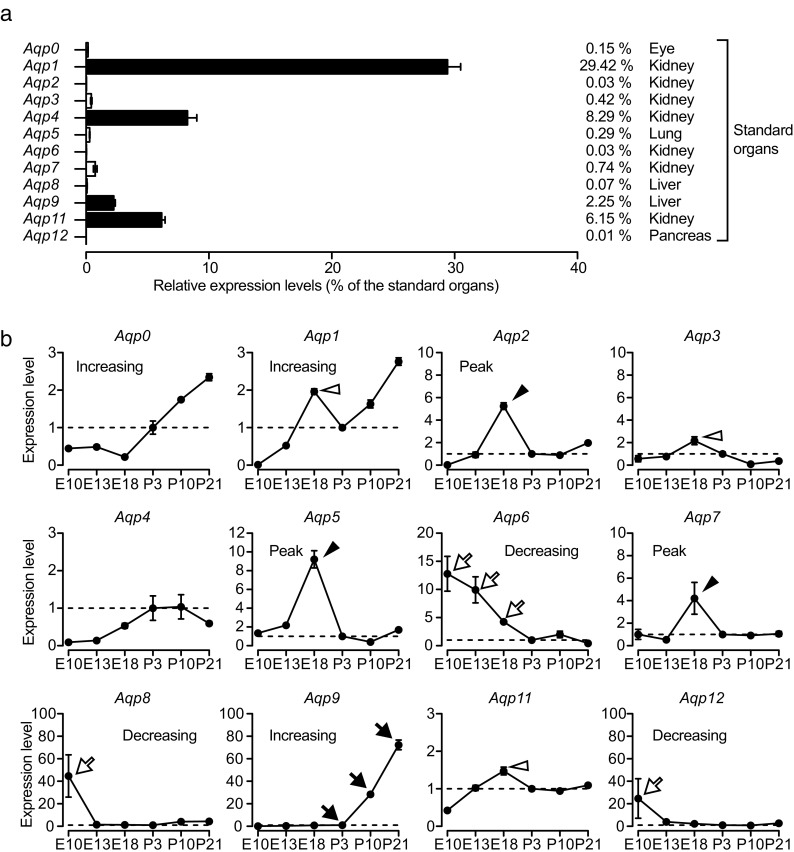
Quantitative analysis of AQP expression levels in the inner ear using qRT-PCR. (a) The approximate expression levels in mature inner ears (on P21) were evaluated by calculating the ratios of expression levels to the standard organs. The expression levels of Aqp1, 4, 9, and 11 were greater than 1 % of those in the standard organs (filled bars), followed by Aqp0, 3, 5, and 7 (0.1–1 %), and Aqp2, 6, 8, and 12 (less than 0.1 %). Sample numbers were 4 for all AQPs, and error bars indicate standard errors. (b) The expression levels were tracked longitudinally for all AQP subtypes during E10–P21. For each subtype, the average expression level on P3 was used as the standard (set to 1.0), and the relative expression level was plotted on the y-axis for each time point. Several AQP subtypes showed a characteristic pattern in their expression change: increasing (Aqp0, 1, and 9), decreasing (Aqp6, 8, and 12), and peak formation (Aqp2, 5, and 7). In particular, Aqp9 showed a 70-fold increase during P3–P21 (arrows), and Aqp6 expression gradually decreased during E10–E18 (open arrows). The expression levels of Aqp2, 5, and 7 peaked on E18 (arrowheads; 5-, 9-, and 4-fold increase compared to P3, respectively). Small expression peaks were also observed for Aqp1, 3, and 11 (open arrowheads). Sample numbers were 2 for E10, 3 for E13, and 4 for E18–P21. Error bars indicate the standard errors.
Longitudinal Changes in AQP Expression Showed Characteristic Patterns: Increasing, Decreasing, and E18 Peak Expression
We quantified the expression level of each AQP subtype longitudinally during development and maturation of the inner ear (Fig. 1b). In addition to the expression levels on P21, those on different time points (E10, E13, E18, P3, and P10) were determined by qRT-PCR. Since the aim of our study was to determine the longitudinal changes of AQP expression levels, we used the average expression levels on P3 as standards (set to 1.0), and plotted the longitudinal expression levels as relative values to P3. The morphological development of the inner ear begins from an otocyst on E9.5, and almost completes during the embryonic stage (Kelley 2005). In contrast, functional maturation continues during the postnatal stage, including K+ concentration and charged potential in the endolymph (Li et al. 2013). Thus, we selected P3 as a standard point corresponding to the changing point between morphological development and functional maturation.
The longitudinal changes of several AQP subtypes followed characteristic patterns. The expression levels of Aqp0, 1, and 9 showed unvarying increase during the measurement time. In particular, the expression levels of Aqp9 increased by 70-fold during P3–P21 (Fig. 1b, arrows). In contrast, Aqp6, 8, and 12 were expressed only in the early developmental stage (Fig. 1b, open arrows), and a gradual decrease was observed in Aqp6. The most characteristic patterns were observed for Aqp2, 5, and 7 expression, which peaked on E18 (Fig. 1b, arrowheads). The expression levels of these subtypes on E18 were more than 5-fold greater than those on P3. Small expression peaks were also observed for Aqp1, 3, and 11 (Fig. 1b, open arrowheads). In summary, the combinations of expression patterns of AQP subtypes were increasing (Aqp0, 1, and 9), decreasing (Aqp6, 8, and 12), and E18 peak expression (Aqp2, 5, and 7).
AQP11 Was Distributed in the Sensory Epithelia and Spiral Ganglia Including OHCs
Using qRT-PCR, we found that Aqp1, 4, 9, and 11 were majorly expressed in the mature inner ear (Fig. 1a). However, detailed localization of AQP11 in the inner ear, particularly in the cochlea, has never been reported. Thus, we determined the localization of this unique “subcellular” AQP using ISH. Since our longitudinal quantification indicated that Aqp11 was expressed almost constantly (Fig. 1b), we performed ISH at three time points, E13, P3, and P21, which are developmentally important (Figs. 2 and 3).
FIG. 2.

In situ hybridization for Aqp11 mRNA on E13 (a, d, g, and j), P3 (b, e, h, and k), and P21 (c, f, i, and l). The localizations of Aqp11 mRNA in the cochleae (a–f) and vestibules (g–l) are shown. Signals of P21 samples (c, f, i, and l) were weaker than those on P3 (b, e, h, and k) since P21 tissues required 3 days of decalcification before preparing frozen sections. In the cochleae on P3 and P21, the organs of Corti (b and c, arrowheads), and spiral ganglia (e and f, arrowheads) expressed Aqp11. In the vestibules on P3 and P21, Aqp11 was expressed in the sensory epithelia of the otolithic organs (h and i, arrowheads, saccules are shown) and semicircular canals (k and l., arrowheads). Similar localization was observed on E13 (a, d, g, and j). In the E13 cochlear duct, intense expression was observed in the future organ of Corti (a, arrowheads), and primitive spiral ganglion area (d, arrowheads). In the vestibular duct on E13, intense expression was observed in the future sensory epithelia of the otolithic organ (g, arrowheads) and the crista ampullaris of the semicircular canal (j, arrowheads). Bars indicate 50 μm.
FIG. 3.

Detailed distribution of Aqp11 mRNA in the organs of Corti on P3 (a–c) and P21 (d–f). In situ hybridization for Aqp11 (a and d), immunohistochemistry for Myo7a (b and e), and merged images (c and f) are shown. Schematic illustrations indicate cells expressing Aqp11 on P3 (g) and P21 (h). On P3 (a–c) and P21 (d–f), Aqp11 mRNA was detected in the OHCs (magenta arrowheads), pillar cells (magenta open arrows), Deiter’s cells (magenta arrows), and Hensen’s cells (magenta open arrowheads), as schematically illustrated (g and h). Abbreviations: i, IHC; o, OHC; p, pillar cell; d, Deiter’s cell; h, Hensen’s cells. Bars indicate 50 μm.
The localization of AQP11 was unique compared with other AQPs. Expression of Aqp11 was observed in the future sensory epithelium on E13 (Fig. 2a, arrowheads), and expression appeared in the organs of Corti on P3 and P21 (Fig. 2b and c, arrowheads). Comparison with Myo7a localization indicated that Aqp11 was expressed in the OHCs and supporting cells, but not in the inner hair cells (IHCs) (Fig. 3a–f). Supporting cells expressing Aqp11 were the pillar cells, Deiter’s cells, and Hensen’s cells as illustrated (Fig. 3g and h). Aqp11 was also expressed in the spiral ganglia on P3 and P21 (Fig. 2e and f), and also in the primitive ganglia on E13 (Fig. 2d). In the vestibule, Aqp11 was expressed in the future sensory epithelium in the vestibular duct on E13 (Fig. 2g and j, arrowheads), and sensory epithelia in the otolithic organs (Fig. 2h and i) and cristae ampullaris of semicircular canals (Fig. 2k and l) both on P3 and P21. Aqp11 mRNA was not detected in the endolymphatic ducts or sacs (data not shown).
To evaluate the contribution of Aqp11 to auditory function, we measured the ABR thresholds of Aqp11-knockout mice using click stimulation (Figs. 4 and 5). Although most of the Aqp11-knockout mice die before weaning due to renal malfunction caused by severe polycystic kidney disease (Morishita et al. 2005), a few mice survive to 3–4 weeks old, when their hearing signal can reach the brain stem (Ehret 2005). The average thresholds were 42.1 and 55 dB for Aqp11 −/− and wild-type, respectively (Fig. 4, filled and open circles), without significant difference as determined by Welch’s test (p = 0.15). Representative waveforms of Aqp11 −/− and wild-type are also shown (Fig. 5).
FIG. 4.

Auditory brainstem response (ABR) measurement of Aqp11 −/− and wild-type mice at 3–4 weeks. ABR thresholds were determined using click stimulations, and compared between Aqp11 −/− (KO, filled circles) and wild-type (WT, open circles). The average ABR thresholds were 42.1 and 55 dB, which were similar between KO and WT without any statistically significant difference (by Welch’s test, p = 0.15). Bars indicate standard errors.
FIG. 5.
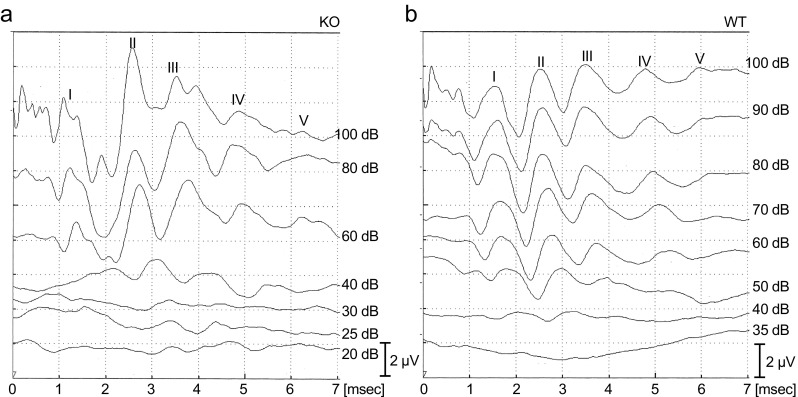
Representative waveform data of auditory brainstem response (ABR) measurement for Aqp11 −/− (KO) and wild-type (WT) used in Fig. 4. Waves I–V were identified and indexed by the characters I–V. The thresholds were determined using wave I, and were 40 dB for both KO and WT. Vertical bars indicate 2 μV.
AQP9 Showed Gradual Increase of Expression Sites around Scala Media during P3–P21
The qRT-PCR also showed that Aqp9 expression levels were significantly increased during P3–P21 (70-fold increase after P3; Fig. 1b). Considering that the auditory function is established during P3–P21, marked increase of the Aqp9 expression level appears to be involved in the functional maturation of the inner ear. However, few reports have mentioned the localization during this span, with the exception of studies of localization in the mature inner ear (Huang et al. 2002; Nishimura et al. 2009; Nishioka et al. 2010). Thus, we performed immunohistochemical analysis on P3, P10, and P21 to determine the localization during this process (Figs. 6,7,8).
FIG. 6.

Localization change of AQP9 expression in the cochleae during P3–P21. Fluorescent images of anti-AQP9 immunohistochemistry on P3 (a), P10 (b), and P21 (c) are shown. Initially on P3 (a), AQP9 was expressed in the organ of Corti (asterisk) and root cells (double asterisk). On P10 (b), intense expression emerged in the interdental cells (arrows) and spiral ganglion (arrowheads), which continued on P21 (c, arrows and arrowheads). Bars indicate 50 μm.
FIG. 7.

Detailed localization change of AQP9 expression in the organs of Corti during P3–P21. Z-stack images of confocal microscopy are shown. AQP9 localization was compared to β-III tubulin (Tuj-1) on P3 (a–c), P10 (d–f), and P21 (g–i). Positions of the IHCs and OHCs are indicated by the characters, i and o, respectively. On P3 (a–c), AQP9 was expressed in the afferent neurons beneath the IHCs and OHCs (a and b, open and filled yellow arrowheads, respectively). On P10 (d–f), expression of AQP9 in these afferent neurons was sustained but became weaker (d and e, open and filled yellow arrowheads). Instead, outer pillar cells started with intense AQP9 expression (d, open yellow arrows). On P21 (g–i), intense expression emerged in the inner pillar cells (g, filled yellow arrow) in addition to the outer pillar cells (g, open yellow arrows). Expression in the afferent neurons was not observed, and instead, AQP9 was detected in the Deiter’s cells without co-localization with afferent neurons (h, open and filled yellow arrowheads). The cups (g, filled magenta arrowheads) and phalangeal processes (g, open magenta arrowheads) of Deiter’s cells are indicated. Bars indicate 20 μm.
FIG. 8.

Comparison of AQP9 localization to phalloidin (Ph) and myosin 7a (Myo7a) localization in the P21 organ of Corti. The localization of AQP9 in the inner and outer pillar cells were co-localized with phalloidin staining of these cells (a and b, arrows and open arrows, respectively). AQP9 was detected in the Deiter’s cups (a and b, filled arrowheads) beneath the OHCs and in the phalangeal processes (a, open arrowheads) between the OHCs. Bars indicate 20 μm.
Coincident with the marked increase of the Aqp9 expression levels during P3–P21, AQP9 started intense expression at multiple sites within the scala media (Fig. 6). Initially on P3, AQP9 expression was limited to the organ of Corti and root cells (Fig. 6a, asterisk and double asterisk). While expression in these sites continued even on P10 and P21 (Fig. 6b and c, asterisks and double asterisks), AQP9 expression emerged in the interdental cells and spiral ganglia on P10 (Fig. 6b, arrows and arrowheads). Finally, on P21, AQP9 was expressed in the organ of Corti, root cells, interdental cells, and spiral ganglia (Fig. 6c). In the vestibule, AQP9 was expressed in the sensory epithelium and endolymphatic sac as previously reported (Huang et al. 2002; Nishimura et al. 2009) without remarkable change during P3–P21 (data not shown).
In the Organ of Corti, AQP9 Expression Shifted from Neurons to Supporting Cells during P3–P21
Gradual emergence of AQP9 expression also occurred inside the organ of Corti (Fig. 7). In addition, we revealed that AQP9 was temporally expressed in the afferent neurons on P3 (Fig. 7a–c). On P3, AQP9 was expressed in the afferent neurons beneath the IHCs and OHCs (Fig. 7a, open and filled arrowheads), which was co-localized with Tuj-1 (Fig. 7b, open and filled arrowheads). This AQP9 expression in the afferent neurons was temporal and became faint on P10 (Fig. 7d and e, open and filled arrowheads). Subsequently on P21, no AQP9 signal co-localized with that of Tuj-1 (Fig. 7g–i). Parallel to the loss of AQP9 expression in the afferent neurons, AQP9 expression started in supporting cells. AQP9 expression emerged in the outer pillar cells on P10 (Fig. 7d, open arrows), and in the inner pillar cells on P21 (Fig. 7g, yellow arrow). On P21, AQP9 expression started also in the Deiter’s cells (Fig. 7g, open and filled magenta arrowheads).
For detailed evaluation, we compared AQP9 expression with phalloidin and Myo7a staining on P21 (Fig. 8). As discussed above, AQP9 was expressed in the pillar cells (Fig. 8a, open and filled arrows). AQP9 was also expressed along the entire long cell bodies of Deiter’s cells, including Deiter’s cup (Fig. 8a and b, filled arrowheads) and phalangeal processes (Fig. 8a, open arrowheads).
AQP5 Expression Expanded along the Cochlear Duct during E13–E18
The expression levels of Aqp2, 5, and 7 peaked on E18 during development (Fig. 1b). Of these subtypes, it is reported that the expression of AQP5 regresses postnatally (Mhatre et al. 1999; Hirt et al. 2010). AQP5 is expressed in the root cells of the cochlea, and in rats, the expression in the root cells is pancochlear on P4, while becomes limited to those in the apical turn on P32 (Hirt et al. 2010). We predicted that a similar localization change occurs at the embryonic stage, and performed immunohistochemistry for AQP5.
Immunohistochemistry indicated that AQP5 were expressed in the area of future root cells at the embryonic stage, and expanded along the cochlear duct during E13–E18 (Fig. 9). On E13, AQP5 expression was limited to the basal turn (Fig. 9a, arrow), and then expanded along the cochlear duct on E15 (Fig. 9b, arrows), and reached the apical turn on E18 (Fig. 9c, arrows). After P3, AQP5 expression regressed and was limited to the apical turn on P21, as previously reported (Mhatre et al. 1999; Hirt et al. 2010).
FIG. 9.

Expansion of AQP5 expressing cells along the cochlear duct during E13–E18. Fluorescent images of anti-AQP5 immunohistochemistry on E13 (a), E15 (b), and E18 (c) are shown. On E13 (a), AQP5 expression was limited to the lateral wall of the basal turn (arrow). AQP5 expressing cells expanded toward the apical turn on E15 (b, arrows), and reached the apical turn on E18 (c, arrows). Bars indicate 50 μm.
Discussion
Systematic Quantification of AQP Expression Levels and their Possible Contribution to Inner-Ear Function
In our study, we extended the application of qRT-PCR to all known AQP subtypes, including the recently reported AQP11 and 12, and to the entire inner-ear development, from E10 to P21. Using this systematic approach, we revealed that Aqp1, 4, 9, and 11 were majorly expressed in the mature inner ear, and that the longitudinal expression levels of several AQP subtypes followed characteristic patterns: increasing (Aqp0, 1, and 9), decreasing (Aqp6, 8, and 12), and peak of expression at E18 (Aqp2, 5, and 7).
Quantification of expression in the mature inner ear is one of the effective indices to evaluate the contribution of AQP subtypes at each stage. A previous study approached this problem by using a combination of polymerase chain reaction (PCR) and dot-blot assay, and showed that Aqp1, 3, 4, 5, 7, and 9 were expressed in the inner ear, and that Aqp1, 3, 4, and 5 were the most abundant (Huang et al. 2002). Our qRT-PCR showed that all of these subtypes were expressed at more than 0.1 % of standard organs (Fig. 1a), and confirmed the results of the previous study. Furthermore, we evaluated the expression of AQP11 and AQP12. These two subtypes are classified into “subcellular AQPs”, which are distributed on the intracellular membrane (Ishibashi et al. 2000; Itoh et al. 2005). Our study revealed that Aqp11 was highly and constantly expressed during all developmental stages (Fig. 1a and b), which indicates the essential contribution of AQP11 to inner-ear function.
We also found that the longitudinal expression levels of several AQP subtypes followed characteristic patterns (Fig. 1b). Considering the process of establishing inner-ear function, these changes in expression patterns provide important clues to understand the contribution of AQP subtypes (Fig. 10a). Inner ear development is known to begin with an ectodermal invagination to form an otocyst on E9.5. The otocyst extends two protrusions: one to form the scala media of the cochlea and the other to form the endolymphatic duct and sac, while the central part of the otocyst forms the vestibular labyrinth (Kelley 2005). The lumen of the cochlea opens on E14.5, resulting in endolymph and perilymph establishment (Kim and Wangemann 2010). In the cochlea, K+ concentration and charged potential in the endolymph start at the perinatal stage (E19.5–P3) (Li et al. 2013). In mice, the hearing sensation begins to reach the brain stem approximately on P10–P21 (Ehret, 2005).
FIG. 10.

(a) The time course of the inner ear development and longitudinal AQP expression levels are summarized. The expression levels of Aqp2, 5, and 7 peaked on E18 (asterisk), which was coincident with the emergence of the endolymphatic and perilymphatic space. The expression level of Aqp1 increased during the entire development with a small expression peak on E18. The 70-fold increase of Aqp9 occurred over a shorter time frame, P3–P21, which was coincident with elevation of K+ and charge of endolymphatic potential. Gradual decrease of Aqp6 occurred in the early stages of development. (b) Immunohistochemistry of AQP9 in the mature cochlea (P21) is illustrated. Cells expressing AQP9 are filled with magenta. AQP9 were expressed in the interdental cells (IDCs), pillar cells (PCs), Deiter’s cells (DCs), root cells (RCs), and spiral ganglion (SG). (c) ISH of Aqp11 mRNA in the mature cochlea (P21) is shown. Cells expressing Aqp11 are filled with magenta. Aqp11 was expressed in the OHCs, PCs, DCs, Hensen’s cells (HCs), and SG, but not in the IHCs.
Subtypes with increasing expression (Aqp0, 1, and 9) indicate their involvement in the establishment of inner-ear morphology and function. In particular, Aqp1 and 9 were highly expressed in the mature inner ear (Fig. 1a). Aqp1 has been reported to be expressed in the fibrocytes of the cochlea and vestibule, and in the endothelial cells of blood vessels (Stankovic et al. 1995; Huang et al. 2002), suggesting its contribution to water passage from circulation to the inner ear. Thus, the upregulated expression of Aqp1 from the embryonic to postnatal days may reflect maturation of these cells to accommodate the increasing demand of water transport. However, the marked increase of Aqp9 expression was observed during a shorter time frame, P3–P21 (Fig. 1a), which was coincident with K+ elevation and charging potential of the endolymph (Fig. 10a).
Aqp6, 8, and 12 were expressed in the early developmental stages; of these AQPs, Aqp6 expression gradually decreased during E10–E18 (Fig. 1b). Although AQP6 is a classical AQP, it has permeability to anions (e.g., nitrate) and water molecules, and intracellular localization (Yasui et al. 1999; Ikeda et al. 2002). Previous studies have reported AQP6 localization in the interdental cells, stria vascularis, and vestibular sensory epitheliums (Lopez et al. 2007; Taguchi et al. 2008). Although our quantification indicated its expression in the primitive tissue, the exact contribution of AQP6 remains unclear.
The most characteristic pattern in our longitudinal quantification was the expression peak on E18 (Aqp2, 5, and 7). Small expression peaks were also observed for Aqp1, 3, and 11. The peak expression of these subtypes on E18 was coincident with the formation of endolymphatic and perilymphatic spaces, starting on E14.5 (Kim and Wangemann 2010) (Fig. 10a). The expression of these subtypes around the endolymphatic space also suggests their involvement in the lumen formation. As for AQP2 and 7, previous studies have reported their localization around the endolymphatic lumen, including Reissner’s membrane and stria vascularis (Huang et al. 2002; Mhatre et al. 2002; Nishioka et al. 2010). As for AQP5, previous studies have reported its expression in the root cells (Mhatre et al. 1999; Merves et al. 2003; Hirt et al. 2010), which is pancochlear at the early postnatal stage and becomes limited to the root cells in the apical turn (Hirt et al. 2010). These results, combined with the immunohistochemistry results (Fig. 9), indicate that AQP5 expression in the root cells begins in the basal turn and expands toward the apical turn during E13–E18, and regresses from the basal turn during postnatal development. The peak of Aqp5 expression levels on E18 may reflect this change of the AQP5 protein localization along the cochlear duct.
Among the four AQPs majorly expressed in the mature inner ear, AQP1, 4, 9, and 11, the longitudinal expression changes of Aqp4 and 11 are almost constant after E13 or E18, respectively (Fig. 1b). For AQP11, we clarified the distribution of this unique AQP using ISH (Figs. 2 and 3). For AQP4, its localization in the inner ear has been well characterized. AQP4 is expressed in the supporting cells of the sensory epithelia, astrocytes surrounding auditory nerves, and the epithelium of the endolymphatic sac (Takumi et al. 1998; Li and Verkman 2001). Notably in the cochlea, AQP4 is expressed in the interdental cells, inner sulcus cells, Hensen’s cells, Claudius’ cells, and root cells (Takumi et al. 1998; Eckhard et al. 2012b). AQP4 in these supporting cells co-localize with the Kir4.1 K+ channel, suggesting its involvement in K+ transport, particularly the recycling of K+ into endolymph (Eckhard et al. 2012b). Our qRT-PCR showed abundant and constant expression of Aqp4 and 11, suggesting their fundamental contribution to water homeostasis in the inner ear.
Unique Localization of AQP11, Including OHCs
Our systematic qRT-PCR found that Aqp11 was one of the highly expressed AQPs in the mature inner ear, and constantly expressed during development (Fig. 1a and b). ISH of Aqp11 mRNA revealed that AQP11 was expressed in the OHCs, supporting cells, and spiral ganglia, but not in the IHCs (Fig. 10c). A recent study on the transcriptomes of OHCs and IHCs also reported Aqp11 transcription in the OHCs, and absence in the IHCs (Liu et al. 2014), which is consistent with our ISH results. To our knowledge, our study is the first to demonstrate Aqp11 localization in the murine cochlea.
AQP11 is one of the recently reported AQPs, and forms a new subfamily, “subcellular AQPs”, along with AQP12 (Ishibashi et al. 2000; Ishibashi 2006). AQP11 characteristics are different from those of other conventional AQPs, including its amino acid sequence, permeability to water molecules, and localization. AQP11 lacks one of the two asparagine-proline-alanine (NPA) boxes, and instead possesses an asparagine-proline-cysteine (NPC) box (Yakata et al. 2007). Since NPA motifs play an important role in water permeation, it is likely that AQP11 shows differences in water permeability and small molecule (e.g., glycerol) selectivity. As the name “subcellular” indicates, AQP11 (and 12) localize in the endoplasmic reticulum (ER) (Itoh et al. 2005; Morishita et al. 2005).
A common feature of the tissues expressing Aqp11 is that they are all neurons or neuron-like cells, and are subjected to frequent oscillations in potential. OHCs are responsible for frequency selectivity and dynamic range in the cochlea (Dallos and Harris 1978), which are controlled by rapid changes in transmembrane potential (Frank et al. 1999), by an exceedingly high density of motor molecules (Huang and Santos-Sacchi 1993), and by rapid endocytosis (Meyer et al. 2001). Therefore, AQP11 may enable the rapid and precise function of OHCs by maintaining continuous protein synthesis, frequent endocytosis, and subsequent ER homeostasis.
Since OHCs are considered to work as “amplifiers” in the cochlea (Ashmore 1987; Ashmore and Gale 2004), it follows that Aqp11-knockout mice should have some audiological phenotype. Although most Aqp11-knockout mice die before weaning due to lethal polycystic kidney disease (Morishita et al. 2005), a few mice survive to 3–4 weeks old, when their hearing signal can reach the brain stem (Ehret 2005). However, contrary to our expectation, the ABR thresholds were similar between Aqp11 −/− and wild-type mice (Fig. 4). This result seems inconsistent with the localization revealed by our ISH, since it is known that the amplification of OHCs affects the auditory threshold. OHCs enhances the vibration of the organ of Corti by prestin-induced electromotility (Dallos and Harris 1978; Dallos et al. 2008), and Prestin-knockout mice show the ABR thresholds of 70–80 dBs (Liberman et al. 2002).
Similar discrepancy between localization and phenotype was observed also in the liver. Liver-specific Aqp11-knockout mice showed vacuolization in hepatocytes only under metabolic stress: fasting for 24 h causes vacuolization in periportal hepatocytes, and upon refeeding, they deteriorate to giant vacuoles (Rojek et al. 2013). Considering the stress-dependent phenotype of liver-specific Aqp11-knockout mice, AQP11 may have redundancy by other intracellular AQPs (AQP6, 8, and 12) (Yasui et al. 1999; Calamita et al. 2005; Itoh et al. 2005), or its function may be required only under a stressed condition. As observed in the liver-specific Aqp11-knockout mice, a stressed condition may be required to clarify the phenotype in the inner ear as well.
Gradual Emergence of AQP9 around the Scala Media
Longitudinal qRT-PCR showed that Aqp9 expression increased by 70-fold during P3–P21 (Fig. 1b), which overlapped the duration of acquiring auditory function (Ehret 2005). We also performed immunohistochemical analysis during this process, and found that AQP9 expression gradually emerged around the scala media, including Deiter’s cells, pillar cells, interdental cells, and root cells during P3–P21, coincident with the 70-fold increase of the expression level (Figs. 6 and 7). The expression in the interdental cell is consistent with a previous study (Huang et al. 2002), and our characterization of AQP9 expression in other sites contributes to the knowledge of AQP9 distribution in the inner ear (Fig. 10b). In addition, the gradual emergence of AQP9 expression may reflect the maturation of these cells. In particular, inside the organ of Corti, AQP9 expression in the outer pillar cells preceded that in the inner pillar cells and Deiter’s cells (Fig. 7).
The common feature of the sites of AQP9 expression is that they are involved in the K+ recycling pathway. The K+ recycling pathway consists of two pathways, the medial and lateral pathways (Wangemann 2002). The medial pathway includes the inner phalangeal cells, inner sulcus cells, and interdental cells, and primarily recycles K+ used by the IHCs. The lateral pathway includes Deiter’s cells, Hensen’s cells, Claudius’ cells, root cells, and stria vascularis, and primarily recycles K+ used by OHCs. AQP9 expression sites in the mature inner ear are involved in these pathways (Fig. 10b), and gradual emergence of these sites coincide with the establishment of endolymphatic potential (Fig. 10a) (Li et al. 2013). Considering both the changes in the localization and expression level, it is possible that AQP9 supports K+ elevation and potential by contributing to the K+ recycling pathway.
In contrast to the lethal phenotype of Aqp11 −/− mice, the phenotype of Aqp9 −/− mice is barely detectable. Physical appearances of Aqp9 −/− mice were normal, including body-weight, and Aqp9 −/− mice show fertility (Rojek et al. 2007). Aqp9 −/− mice have been reported to show disturbed glycerol metabolism: Aqp9 −/− mice have elevated plasma glycerol and triglyceride levels under normal conditions (Rojek et al. 2007; Hashem 2010), and Aqp9 −/− mice with leptin receptor mutation (Lepr db/Lepr db) showed moderately lower blood glucose levels after short fasting (Rojek et al. 2007). However, Aqp9 −/− mice behavior was not different from that of age-matched littermate controls (Rojek et al. 2007).
The biological importance of temporal AQP9 expression on P3 is unclear. It was reported that AQP9 is expressed in the catecholaminergic neurons and glial cells of the brain (Badaut et al. 2004; Badaut and Regli 2004), and astrocytes in the spinal cord (Oshio et al. 2004). The differentiation of neurons and glial cells may explain the temporal AQP9 expression detected in immature afferent auditory neurons.
Acknowledgements
We would like to thank Takenori Miyashita (Kagawa University) for advice on the preparation of endolymphatic sacs sections. We also thank Ms. Yoshiko Karatsu for providing excellent technical assistance. This work was supported by JSPS KAKENHI Grant Numbers 24592545 and 15 K10749 to NY and 23229009 to JI.
Compliance with Ethical Standards
Conflict of Interest
The authors declare no conflict of interest associated with this manuscript.
Contributor Information
Takushi Miyoshi, Email: t_miyoshi@ent.kuhp.kyoto-u.ac.jp.
Taro Yamaguchi, Email: t-yamagu@pharm.setsunan.ac.jp.
Kiyokazu Ogita, Email: ogita@pharm.setsunan.ac.jp.
Yasuko Tanaka, Email: ystanaka@my-pharm.ac.jp.
Ken-ichi Ishibashi, Email: kishiba@my-pharm.ac.jp.
Hiroaki Ito, Email: hiroaki_ito@kochi-u.ac.jp.
Taisuke Kobayashi, Email: tkobayashi@kochi-u.ac.jp.
Takayuki Nakagawa, Email: tnakaky@gmail.com.
Juichi Ito, Email: ito@ent.kuhp.kyoto-u.ac.jp.
Koichi Omori, Email: omori@ent.kuhp.kyoto-u.ac.jp.
Norio Yamamoto, Phone: +81-75-751-3346, Email: yamamoto@ent.kuhp.kyoto-u.ac.jp.
References
- Ashmore J, Gale J. The cochlear amplifier. Current biology: CB. 2004;14:R403–R404. doi: 10.1016/j.cub.2004.05.025. [DOI] [PubMed] [Google Scholar]
- Ashmore JF. A fast motile response in Guinea-pig outer hair cells: the cellular basis of the cochlear amplifier. J Physiol. 1987;388:323–347. doi: 10.1113/jphysiol.1987.sp016617. [DOI] [PMC free article] [PubMed] [Google Scholar]
- Badaut J, Regli L. Distribution and possible roles of aquaporin 9 in the brain. Neuroscience. 2004;129:971–981. doi: 10.1016/j.neuroscience.2004.06.035. [DOI] [PubMed] [Google Scholar]
- Badaut J, Petit JM, Brunet JF, Magistretti PJ, Charriaut-Marlangue C, Regli L. Distribution of aquaporin 9 in the adult rat brain: preferential expression in catecholaminergic neurons and in glial cells. Neuroscience. 2004;128:27–38. doi: 10.1016/j.neuroscience.2004.05.042. [DOI] [PubMed] [Google Scholar]
- Calamita G, Ferri D, Gena P, Liquori GE, Cavalier A, Thomas D, Svelto M. The inner mitochondrial membrane has aquaporin-8 water channels and is highly permeable to water. J Biol Chem. 2005;280:17149–17153. doi: 10.1074/jbc.C400595200. [DOI] [PubMed] [Google Scholar]
- Chou CL, Ma T, Yang B, Knepper MA, Verkman AS. Fourfold reduction of water permeability in inner medullary collecting duct of aquaporin-4 knockout mice. Am J Phys. 1998;274:C549–C554. doi: 10.1152/ajpcell.1998.274.2.C549. [DOI] [PubMed] [Google Scholar]
- Dallos P, Harris D. Properties of auditory nerve responses in absence of outer hair cells. J Neurophysiol. 1978;41:365–383. doi: 10.1152/jn.1978.41.2.365. [DOI] [PubMed] [Google Scholar]
- Dallos P, Wu X, Cheatham MA, Gao J, Zheng J, Anderson CT, Jia S, Wang X, Cheng WH, Sengupta S, He DZ, Zuo J. Prestin-based outer hair cell motility is necessary for mammalian cochlear amplification. Neuron. 2008;58:333–339. doi: 10.1016/j.neuron.2008.02.028. [DOI] [PMC free article] [PubMed] [Google Scholar]
- Eckhard A, Gleiser C, Arnold H, Rask-Andersen H, Kumagami H, Muller M, Hirt B, Lowenheim H. Water channel proteins in the inner ear and their link to hearing impairment and deafness. Mol Asp Med. 2012;33:612–637. doi: 10.1016/j.mam.2012.06.004. [DOI] [PubMed] [Google Scholar]
- Eckhard A, Gleiser C, Rask-Andersen H, Arnold H, Liu W, Mack A, Muller M, Lowenheim H, Hirt B. Co-localisation of K(ir)4.1 and AQP4 in rat and human cochleae reveals a gap in water channel expression at the transduction sites of endocochlear K(+) recycling routes. Cell Tissue Res. 2012;350:27–43. doi: 10.1007/s00441-012-1456-y. [DOI] [PubMed] [Google Scholar]
- Ehret G. Infant rodent ultrasounds -- a gate to the understanding of sound communication. Behav Genet. 2005;35:19–29. doi: 10.1007/s10519-004-0853-8. [DOI] [PubMed] [Google Scholar]
- Frank G, Hemmert W, Gummer AW. Limiting dynamics of highfrequency electromechanical transduction of outer hair cells. Proc Natl Acad Sci. 1999;96:4420–4425. doi: 10.1073/pnas.96.8.4420. [DOI] [PMC free article] [PubMed] [Google Scholar]
- Hashem MA. Biochemical and expression studies on aquaporin 9 (AQP9) in wild and AQP9 knockout mice. Vet Arhiv. 2010;80:93–112. [Google Scholar]
- Hirt B, Penkova ZH, Eckhard A, Liu W, Rask-Andersen H, Muller M, Lowenheim H. The subcellular distribution of aquaporin 5 in the cochlea reveals a water shunt at the perilymph-endolymph barrier. Neuroscience. 2010;168:957–970. doi: 10.1016/j.neuroscience.2009.09.002. [DOI] [PubMed] [Google Scholar]
- Huang D, Chen P, Chen S, Nagura M, Lim DJ, Lin X. Expression patterns of aquaporins in the inner ear: evidence for concerted actions of multiple types of aquaporins to facilitate water transport in the cochlea. Hear Res. 2002;165:85–95. doi: 10.1016/S0378-5955(02)00288-5. [DOI] [PubMed] [Google Scholar]
- Huang G, Santos-Sacchi J. Mapping the distribution of the outer hair cell motility voltage sensor by electrical amputation. Biophys J. 1993;65:2228–2236. doi: 10.1016/S0006-3495(93)81248-7. [DOI] [PMC free article] [PubMed] [Google Scholar]
- Ikeda M, Beitz E, Kozono D, Guggino WB, Agre P, Yasui M. Characterization of aquaporin-6 as a nitrate channel in mammalian cells. Requirement of pore-lining residue threonine 63. J Biol Chem. 2002;277:39873–39879. doi: 10.1074/jbc.M207008200. [DOI] [PubMed] [Google Scholar]
- Ishibashi K. Aquaporin subfamily with unusual NPA boxes. Biochim Biophys Acta. 2006;1758:989–993. doi: 10.1016/j.bbamem.2006.02.024. [DOI] [PubMed] [Google Scholar]
- Ishibashi K, Hara S, Kondo S. Aquaporin water channels in mammals. Clin Exp Nephrol. 2009;13:107–117. doi: 10.1007/s10157-008-0118-6. [DOI] [PubMed] [Google Scholar]
- Ishibashi K, Kuwahara M, Kageyama Y, Sasaki S, Suzuki M, Imai M. Molecular cloning of a new aquaporin superfamily in mammals. In: Hohmann S, Nielsen S, editors. Molecular biology and physiology of water and solute transport. New York: Kluwer Academic/Plenum; 2000. pp. 123–126. [Google Scholar]
- Itoh T, Rai T, Kuwahara M, Ko SB, Uchida S, Sasaki S, Ishibashi K. Identification of a novel aquaporin, AQP12, expressed in pancreatic acinar cells. Biochem Biophys Res Commun. 2005;330:832–838. doi: 10.1016/j.bbrc.2005.03.046. [DOI] [PubMed] [Google Scholar]
- Kelley MW (2005) Development of the inner ear
- Kim HM, Wangemann P. Failure of fluid absorption in the endolymphatic sac initiates cochlear enlargement that leads to deafness in mice lacking pendrin expression. PLoS One. 2010;5 doi: 10.1371/journal.pone.0014041. [DOI] [PMC free article] [PubMed] [Google Scholar]
- Li J, Verkman AS. Impaired hearing in mice lacking aquaporin-4 water channels. J Biol Chem. 2001;276:31233–31237. doi: 10.1074/jbc.M104368200. [DOI] [PubMed] [Google Scholar]
- Li X, Zhou F, Marcus DC, Wangemann P. Endolymphatic Na(+) and K(+) concentrations during cochlear growth and enlargement in mice lacking Slc26a4/pendrin. PLoS One. 2013;8 doi: 10.1371/journal.pone.0065977. [DOI] [PMC free article] [PubMed] [Google Scholar]
- Liberman MC, Gao JG, He DZZ, Wu XD, Jia SP, Zuo J. Prestin is required for electromotility of the outer hair cell and for the cochlear amplifier. Nature. 2002;419:300–304. doi: 10.1038/nature01059. [DOI] [PubMed] [Google Scholar]
- Liu H, Pecka JL, Zhang Q, Soukup GA, Beisel KW, He DZ. Characterization of transcriptomes of cochlear inner and outer hair cells. J Neurosci Off J Soc Neurosci. 2014;34:11085–11095. doi: 10.1523/JNEUROSCI.1690-14.2014. [DOI] [PMC free article] [PubMed] [Google Scholar]
- Lopez IA, Ishiyama G, Lee M, Baloh RW, Ishiyama A. Immunohistochemical localization of aquaporins in the human inner ear. Cell Tissue Res. 2007;328:453–460. doi: 10.1007/s00441-007-0380-z. [DOI] [PubMed] [Google Scholar]
- Ma T, Yang B, Gillespie A, Carlson EJ, Epstein CJ, Verkman AS. Severely impaired urinary concentrating ability in transgenic mice lacking aquaporin-1 water channels. J Biol Chem. 1998;273:4296–4299. doi: 10.1074/jbc.273.8.4296. [DOI] [PubMed] [Google Scholar]
- Ma T, Song Y, Yang B, Gillespie A, Carlson EJ, Epstein CJ, Verkman AS. Nephrogenic diabetes insipidus in mice lacking aquaporin-3 water channels. Proc Natl Acad Sci U S A. 2000;97:4386–4391. doi: 10.1073/pnas.080499597. [DOI] [PMC free article] [PubMed] [Google Scholar]
- Merves M, Krane CM, Dou H, Greinwald JH, Menon AG, Choo D. Expression of aquaporin 1 and 5 in the developing mouse inner ear and audiovestibular assessment of an Aqp5 null mutant. J Assoc Res Otolaryngol. 2003;4:264–275. doi: 10.1007/s10162-002-3033-7. [DOI] [PMC free article] [PubMed] [Google Scholar]
- Meyer J, Mack AF, Gummer AW. Pronounced infracuticular endocytosis in mammalian outer hair cells. Hear Res. 2001;161:10–22. doi: 10.1016/S0378-5955(01)00338-0. [DOI] [PubMed] [Google Scholar]
- Mhatre AN, Steinbach S, Hribar K, Hoque AT, Lalwani AK. Identification of aquaporin 5 (AQP5) within the cochlea: cDNA cloning and in situ localization. Biochem Biophys Res Commun. 1999;264:157–162. doi: 10.1006/bbrc.1999.1323. [DOI] [PubMed] [Google Scholar]
- Mhatre AN, Jero J, Chiappini I, Bolasco G, Barbara M, Lalwani AK. Aquaporin-2 expression in the mammalian cochlea and investigation of its role in Meniere’s disease. Hear Res. 2002;170:59–69. doi: 10.1016/S0378-5955(02)00452-5. [DOI] [PubMed] [Google Scholar]
- Morinaga T, Nakakoshi M, Hirao A, Imai M, Ishibashi K. Mouse aquaporin 10 gene (AQP10) is a pseudogene. Biochem Biophys Res Commun. 2002;294:630–634. doi: 10.1016/S0006-291X(02)00536-3. [DOI] [PubMed] [Google Scholar]
- Morishita Y, Matsuzaki T, Hara-chikuma M, Andoo A, Shimono M, Matsuki A, Kobayashi K, Ikeda M, Yamamoto T, Verkman A, Kusano E, Ookawara S, Takata K, Sasaki S, Ishibashi K. Disruption of aquaporin-11 produces polycystic kidneys following vacuolization of the proximal tubule. Mol Cell Biol. 2005;25:7770–7779. doi: 10.1128/MCB.25.17.7770-7779.2005. [DOI] [PMC free article] [PubMed] [Google Scholar]
- Mulders SM, Knoers NV, Van Lieburg AF, Monnens LA, Leumann E, Wuhl E, Schober E, Rijss JP, Van Os CH, Deen PM. New mutations in the AQP2 gene in nephrogenic diabetes insipidus resulting in functional but misrouted water channels. Journal of the American Society of Nephrology: JASN. 1997;8:242–248. doi: 10.1681/ASN.V82242. [DOI] [PubMed] [Google Scholar]
- Nishimura M, Kakigi A, Takeda T, Takeda S, Doi K. Expression of aquaporins, vasopressin type 2 receptor, and Na + (−)K+(−)Cl(−) cotransporters in the rat endolymphatic sac. Acta Otolaryngol. 2009;129:812–818. doi: 10.1080/00016480802441754. [DOI] [PubMed] [Google Scholar]
- Nishioka R, Takeda T, Kakigi A, Okada T, Takebayashi S, Taguchi D, Nishimura M, Hyodo M. Expression of aquaporins and vasopressin type 2 receptor in the stria vascularis of the cochlea. Hear Res. 2010;260:11–19. doi: 10.1016/j.heares.2009.09.011. [DOI] [PubMed] [Google Scholar]
- Oshio K, Binder DK, Yang B, Schecter S, Verkman AS, Manley GT. Expression of aquaporin water channels in mouse spinal cord. Neuroscience. 2004;127:685–693. doi: 10.1016/j.neuroscience.2004.03.016. [DOI] [PubMed] [Google Scholar]
- Preston GM, Carroll TP, Guggino WB, Agre P. Appearance of water channels in Xenopus oocytes expressing red cell CHIP28 protein. Science. 1992;256:385–387. doi: 10.1126/science.256.5055.385. [DOI] [PubMed] [Google Scholar]
- Rojek A, Fuchtbauer EM, Fuchtbauer A, Jelen S, Malmendal A, Fenton RA, Nielsen S. Liver-specific aquaporin 11 knockout mice show rapid vacuolization of the rough endoplasmic reticulum in periportal hepatocytes after amino acid feeding. Am J Physiol Gastrointest Liver Physiol. 2013;304:G501–G515. doi: 10.1152/ajpgi.00208.2012. [DOI] [PubMed] [Google Scholar]
- Rojek AM, Skowronski MT, Fuchtbauer EM, Fuchtbauer AC, Fenton RA, Agre P, Frokiaer J, Nielsen S. Defective glycerol metabolism in aquaporin 9 (AQP9) knockout mice. Proc Natl Acad Sci U S A. 2007;104:3609–3614. doi: 10.1073/pnas.0610894104. [DOI] [PMC free article] [PubMed] [Google Scholar]
- Shiels A, Bassnett S. Mutations in the founder of the MIP gene family underlie cataract development in the mouse. Nat Genet. 1996;12:212–215. doi: 10.1038/ng0296-212. [DOI] [PubMed] [Google Scholar]
- Stankovic KM, Adams JC, Brown D. Immunolocalization of aquaporin CHIP in the Guinea pig inner ear. Am J Phys. 1995;269:C1450–C1456. doi: 10.1152/ajpcell.1995.269.6.C1450. [DOI] [PubMed] [Google Scholar]
- Taguchi D, Takeda T, Kakigi A, Okada T, Nishioka R, Kitano H. Expression and immunolocalization of aquaporin-6 (Aqp6) in the rat inner ear. Acta Otolaryngol. 2008;128:832–840. doi: 10.1080/00016480701765691. [DOI] [PubMed] [Google Scholar]
- Takumi Y, Nagelhus EA, Eidet J, Matsubara A, Usami S, Shinkawa H, Nielsen S, Ottersen OP. Select types of supporting cell in the inner ear express aquaporin-4 water channel protein. Eur J Neurosci. 1998;10:3584–3595. doi: 10.1046/j.1460-9568.1998.00360.x. [DOI] [PubMed] [Google Scholar]
- Tchekneva EE, Khuchua Z, Davis LS, Kadkina V, Dunn SR, Bachman S, Ishibashi K, Rinchik EM, Harris RC, Dikov MM, Breyer MD. Single amino acid substitution in aquaporin 11 causes renal failure. Journal of the American Society of Nephrology: JASN. 2008;19:1955–1964. doi: 10.1681/ASN.2008030296. [DOI] [PMC free article] [PubMed] [Google Scholar]
- Wangemann P. K+ cycling and the endocochlear potential. Hear Res. 2002;165:1–9. doi: 10.1016/S0378-5955(02)00279-4. [DOI] [PubMed] [Google Scholar]
- Yakata K, Hiroaki Y, Ishibashi K, Sohara E, Sasaki S, Mitsuoka K, Fujiyoshi Y. Aquaporin-11 containing a divergent NPA motif has normal water channel activity. Biochim Biophys Acta. 2007;1768:688–693. doi: 10.1016/j.bbamem.2006.11.005. [DOI] [PubMed] [Google Scholar]
- Yamamoto T, Sasaki S. Aquaporins in the kidney: emerging new aspects. Kidney Int. 1998;54:1041–1051. doi: 10.1046/j.1523-1755.1998.00123.x. [DOI] [PubMed] [Google Scholar]
- Yasui M, Kwon TH, Knepper MA, Nielsen S, Agre P. Aquaporin-6: an intracellular vesicle water channel protein in renal epithelia. Proc Natl Acad Sci U S A. 1999;96:5808–5813. doi: 10.1073/pnas.96.10.5808. [DOI] [PMC free article] [PubMed] [Google Scholar]
- Zhou X, Jen PH, Seburn KL, Frankel WN, Zheng QY. Auditory brainstem responses in 10 inbred strains of mice. Brain Res. 2006;1091:16–26. doi: 10.1016/j.brainres.2006.01.107. [DOI] [PMC free article] [PubMed] [Google Scholar]