Abstract.
We have developed compressed sensing single pixel spatial frequency domain imaging (cs-SFDI) to characterize tissue optical properties over a wide field of view () using multiple near-infrared (NIR) wavelengths simultaneously. Our approach takes advantage of the relatively sparse spatial content required for mapping tissue optical properties at length scales comparable to the transport scattering length in tissue () and the high bandwidth available for spectral encoding using a single-element detector. cs-SFDI recovered absorption () and reduced scattering () coefficients of a tissue phantom at three NIR wavelengths (660, 850, and 940 nm) within 7.6% and 4.3% of absolute values determined using camera-based SFDI, respectively. These results suggest that cs-SFDI can be developed as a multi- and hyperspectral imaging modality for quantitative, dynamic imaging of tissue optical and physiological properties.
Keywords: tissue optical properties, scattering, near-infrared, functional imaging
1. Introduction
Spatial frequency domain imaging (SFDI) is a noncontact wide-field imaging technique that uses sinusoidal patterns of intensity-modulated light to characterize multiply scattering media, such as biological tissue. SFDI separates the contributions of light scattering from absorption by measuring the frequency-dependent modulation transfer function of diffusively reflected structured light. This information is used to map and form images of tissue optical parameters and , respectively.1,2 Optical properties at multiple wavelengths are used to derive quantitative images of biochemical composition, such as the tissue concentration of oxy- and deoxyhemoglobin and water. SFDI techniques have been utilized widely to characterize tissue composition and function in humans,3,4 animal models, and ex vivo tissue specimens.5,6
There is generally a tradeoff between spectral and spatial information content in SFDI instruments. This is due to the fact that wide-field imaging is typically performed serially at several discrete wavelengths using selective illumination and/or optical filters.1,7 Spatial frequency domain spectroscopy (SFDS) was introduced to enhance spectral content using a broadband light source, fiber-based collection, and a spectrometer.8,9 However, this approach has a field-of-view (FOV) that is limited to the collection fiber (). Hyperspectral imaging cameras can expand the FOV; however, these systems are generally relatively expensive and can have limitations in speed, dynamic range, and sensitivity.10,11 In this letter, we describe an alternative approach that incorporates compressed sensing (CS) and a single pixel detector for wide-field multispectral imaging. This strategy is compatible with both broadband light sources imaged with fiber-coupled spectrometers and single element detectors using several temporally encoded wavelengths/sources.
Imaging applications of CS were first introduced in a “single pixel camera” form factor that transferred workload from hardware to postacquisition computation.12 CS addresses image reconstruction by relying on random samples from a scene under view instead of capturing individual pixels. This approach can be particularly effective in near-infrared (NIR) and SWIR spectroscopic imaging by replacing expensive cameras with a single photodetector.13 In addition, resolution requirements for SFDI mapping of and are determined by the relatively low frequency of variations in the tissue transport scattering length (). This allows typical SFDI sinusoidal projection patterns to sample tissue sparsely at .1,14 Since CS methods utilize principles of sparsity, the number of random samples imposed by Nyquist Shannon boundary can be reduced and CS is well-matched with diffuse optical imaging and tomography.15,16
2. Materials and Methods
2.1. Spatial Frequency Domain Imaging
The SFDI instrumentation, data acquisition, and postprocessing have been previously enumerated elsewhere.1 Briefly, spatially modulated light is projected onto a sample via a digital light processing (DLP) unit. At each spatial frequency, three evenly spaced modulation phases of 0 deg, 120 deg, and 240 deg are cycled through. The diffusively reflected light is then captured with a camera. The phase-offset images are next fed in a three-phase demodulation formula, Eq. (1), to extract spatial frequency-dependent reflectance. The demodulated reflectance is also calibrated to account for instrument function. As it was shown in Ref. 1, the reflectance sensitivity to optical absorption and scattering varies as a function of spatial frequency. This can be modeled with diffusion theory or Monte Carlo simulations. Using a minimum of two spatial frequencies, the calibrated reflectance at every pixel is then applied to the simulations resulting in and maps. Once the and are decoupled at several wavelengths, is used to calculate hemodynamic parameters by assuming that oxy/deoxyhemoglobin and water are the dominant absorbing chromophores in the medium.
| (1) |
2.2. Compressed Sensing Framework
Nyquist–Shannon is a fundamental sampling theorem in digital signal processing that states that a signal can exactly be recovered if the sampling rate is at least twice its highest frequency. Considering a two-dimensional array with pixels on a digital camera sensor, the raw image can be considered as vector . This vector can be expanded as a combination of its orthonormal basis such as discrete cosine transform, wavelet, etc.,
| (2) |
where and are the coefficient vector and transform operator, respectively. In the case of -sparse expansion of vector, only number of coefficients are nonzero. The CS technique12 suggests using only samples of the signal with sensing matrix which gives the measurement vector
| (3) |
This rewrites Eq. (2) as
| (4) |
The sensing matrix is independent of the raw image, . As part of the CS algorithm, a convex optimization problem is solved using -minimization to recover image based on measurement vector ,
| (5) |
The raw image can then be reconstructed with . In this paper, we have utilized the denoising-based AMP (D-AMP) CS algorithm and source code developed in Ref. 17 on the postprocessing side.
2.3. cs-SFDI
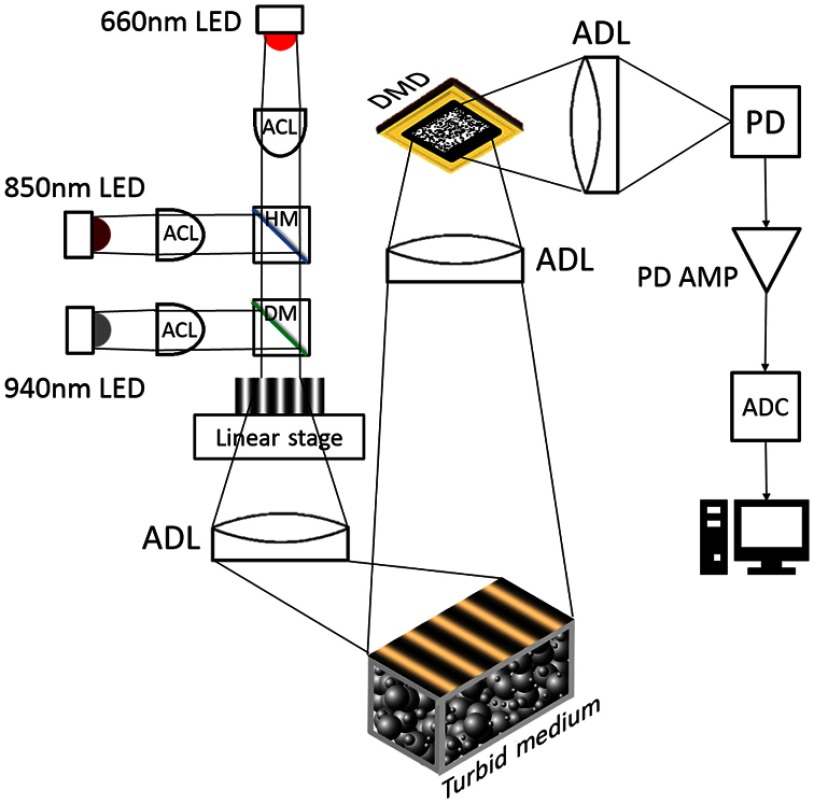
On the detection side of our cs-SFDI instrument, a sample, e.g., tissue phantom, is imaged via a collection lens onto a digital micromirror device (DMD) (CEL5500, Digital Light Innovation, Austin, Texas) with mirror bins. The sensing matrix is also uploaded to the DMD memory as a stack of random patterns from a Bernoulli distribution.18 This binary sensing matrix matches well with the ON/OFF orientation of the DMD. The reflected light from the DMD is then focused on the photodetector (DET100A, Thorlabs, Newton, New Jersey) and finally builds the measurement vector . The CS algorithm allows for reducing the number of sampling patterns stored on a DMD to effectively reconstruct an image. This approach reduces both the duration of data acquisition and the cost of the DMD. Figure 1 shows a schematic of our cs-SFDI setup. On the excitation side, the output of three coaligned LEDs (M660L4, M850L3, and M940L3, Thorlabs, Newton, New Jersey) is condensed onto a sinusoidal-patterned mask (Applied Image Inc., Rochester, New York), and then the mask is imaged onto the tissue simulating phantom. The LEDs are simultaneously intensity-modulated in the frequency range of 3 to 5 kHz, which is higher than the sampler DMD’s refresh rate. The reflected power of the frequency-encoded sources is determined for each random pattern via temporal frequency domain analysis. This feature is important because the high dynamic range of the photodetector enables adding more frequency-encoded light sources to the setup without affecting the total acquisition speed.
Fig. 1.
Schematic of the cs-SFDI instrument. DMD, digital micromirror device; PD, photodiode; PD AMP, photodiode amplifier; ADC, analog-to-digital converter; HM, hot mirror; DM, dichroic mirror; ACL, aspheric condenser lens; ADL, achromatic doublet lens.
A LABVIEW platform (National Instruments, Austin, Texas) controls the linear stage (T-LS28M, Zaber Technologies Inc, Vancouver, BC), the sampler DMD, and the photodiode, thus accelerating the data acquisition. In this configuration, we used a sinusoidal mask on a linear stage instead of a second DMD to project structured light. This was due to the fact that each of the DMD array elements flickers on and off to generate grayscale intensities. In a camera-based SFDI system, the camera’s exposure time can be adjusted to match the pulse width modulation (PWM) on the DMD. However, this can be problematic in a single pixel imager because of the photodiode’s high bandwidth and lack of access to the PWM sequence of every single micromirror element. An additional advantage to transmission-based masks for SFDI is their low-cost and simplicity.
3. Results
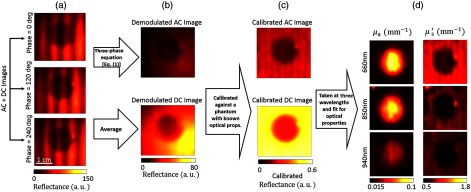
We constructed tissue phantoms to investigate the ability of the cs-SFDI instrument to estimate bulk optical properties.19 The “sample” phantom consists of two regions: a central lesion, which is made of Naphthol Green B dye as the main absorber, and as the main scatterer both dispersed in a cured polydimethylsiloxane (PDMS) base. Naphthol Green is an NIR dye with an absorption peak at 714 nm. The surrounding area of the lesion is made of India Ink as the main absorber, , and PDMS.19 The central lesion has a lower concentration of scattering agent than the surrounding region. Figure 2 shows the work flow of the SFDI technique based on the images reconstructed with the cs-SFDI instrument. In Fig. 2(a), the reflectance from phase-shifted sinusoidal projections is first captured by the compressed single pixel camera. These raw images are then demodulated to AC and DC components, Fig. 2(b), calibrated against another tissue phantom with known optical properties, Fig. 2(c), and finally interpolated pixel-by-pixel to generate the and maps, Fig. 2(d).
Fig. 2.
(a) Raw reflectances from the tissue phantom reconstructed with the single pixel detector. (b) Demodulated AC and DC reflectance, (c) calibrated demodulated reflectance, and (d) absorption and reduced scattering coefficient maps at three wavelengths.
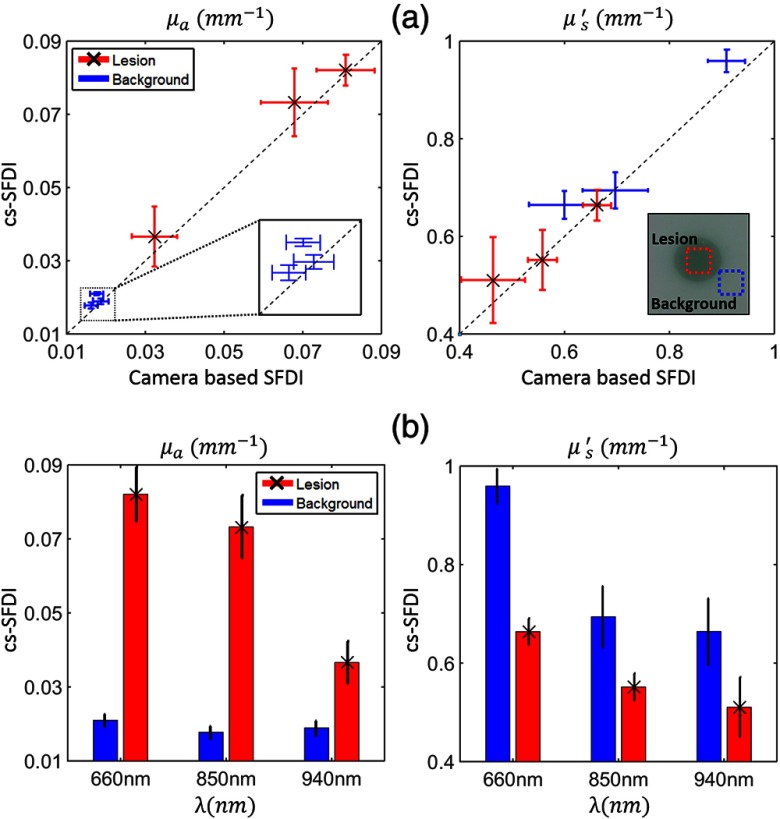
We compared cs-SFDI derived optical properties to those obtained with a conventional camera-based SFDI measurement. In the latter case, we replaced the cs-SFDI photodiode with a CCD camera (Flea3 1394B, Point Grey, Richmond, BC) and set all of the DLP mirrors to ON status. The three LEDs were serially controlled for each sinusoidal pattern projection to achieve spectral and spatial content. Figure 3(a) shows good agreement of the extracted bulk optical properties with the single pixel detector and the CCD camera on two contrasting regions of the phantom, the central lesion and the surrounding area. The average percent difference between these two imaging configurations were 7.6% and 4.3% for and , respectively. Each point in Fig. 3(a) corresponds to a mean optical property from a region of interest (ROI) on a reconstructed map at a specific wavelength. The error bars are calculated from the standard deviation of the values on the same ROIs. According to Fig. 3(b), the absorption coefficient of the central lesion follows the absorption spectra trend of Naphthol Green B while it remains almost unchanged on the surrounding PDMS background. The reduced scattering coefficients also follow the expected spatial contrast and power law dependence.
Fig. 3.
Bulk optical property measurements. (a) Comparison of bulk (top left) and (top right) using standard camera-based SFDI and cs-SFDI calculated at multiple wavelengths at two distinct regions of a tissue phantom: background and lesion (tagged in a white light image of the phantom). (b) Spectral and spatial contrast in phantom’s bulk (bottom left) and (bottom right) extracted using the cs-SFDI instrument.
One of our primary goals in SFDI instrument development is to increase the data acquisition rate, which mainly relies on three parameters: image resolution, number of phase shifted patterns, and number of wavelengths. From the perspective of the single pixel camera, higher image resolution requires increasing the number of sampling patterns on the DMD to achieve a certain accuracy of reconstruction. We have chosen our optimum image resolution based on the transport scattering length in tissue (), which is typically in the NIR. Thus, for in a FOV, the pixel size is about 0.55 mm, which is adequate and comparable to . A sampling rate of about 10%, i.e., 400 samples, is adequate for a tissue phantom illuminated with sinusoidal patterns at a spatial frequency of . This sampling rate results in a maximum acquisition rate of 12.5 frames per second (FPS) on our DMD. However, other DMD chips, such as DLP7000 (Texas Instruments, Dallas, Texas) provide refresh rates of 32,550 Hz and acquisition rates of up to 80 FPS. Because cs-SFDI uses high-bandwidth single pixel detectors, spectral content can be increased using frequency encoding without reductions in image acquisition speed. In the current cs-SFDI configuration, the linear translational stage used for shifting the sinusoidal phase pattern is a limiting factor in achieving higher frame rates and switching between multiple spatial frequencies. As a result, it takes 5 s in total to switch among three phase-shifted frames and capture images. Recently, signal processing techniques in the SFD have been developed to reduce the number of phases required to achieve the demodulated reflectance and achieve “single snapshot” performance.20,21 These methods, however, require a high number of cycles in the modulation pattern to avoid ringing artifacts.20 This imposes faster sampling rates to preserve higher frequency content in the image, thus increasing acquisition time. Therefore, further studies are required to evaluate the fidelity and performance of the cs-SFDI system when using single snapshot demodulation techniques.
4. Conclusion
In conclusion, we have developed a single-pixel CS method for quantitative imaging of optical properties in the spatial frequency domain. A CS algorithm was used to decrease the size of the sensing matrix required to accurately reconstruct and map optical properties. Performance was validated using tissue-simulating phantoms and demonstrating agreement in absorption and reduced scattering coefficients between cs-SFDI and a conventional camera-based system. When combined with temporal encoding of multiple sources, cs-SFDI takes advantage of the high-bandwidth of single pixel detectors and provides a fixed frame rate strategy for simultaneous multispectral imaging. Future work will emphasize increasing imaging speed and spectral content by incorporating single-snapshot demodulation strategies, broadband light-labeling,22 and single-pixel, fiber-coupled spectrometer detection. These results provide a new framework for broadband multi- and hyperspectral functional tissue imaging with important implications for accurately and dynamically characterizing tissue composition, structure, and metabolism.
Acknowledgments
The authors gratefully acknowledge funding provided by the NIH NIBIB Biomedical Technology Research Center LAMMP: P41EB015890, the NIH Grant No. R21EB020953, the Military Medical Photonics Program: AFOSR Grant No. FA9550-14-1-0034, Leading Foreign Research Institute Recruitment Program through the NRF of Korea funded by MSIP: 2012K1A4A3053142, and Arnold and Mabel Beckman Foundation.
Disclosures
No conflicts of interest, financial or otherwise, are declared by the authors.
References
- 1.Cuccia D. J., et al. , “Quantitation and mapping of tissue optical properties using modulated imaging,” J. Biomed. Opt. 14(2), 024012 (2009). 10.1117/1.3088140 [DOI] [PMC free article] [PubMed] [Google Scholar]
- 2.Cuccia D. J., et al. , “Modulated imaging: quantitative analysis and tomography of turbid media in the spatial-frequency domain,” Opt. Lett. 30(11), 1354–1356 (2005). 10.1364/OL.30.001354 [DOI] [PubMed] [Google Scholar]
- 3.Saager R. B., et al. , “In vivo isolation of the effects of melanin from underlying hemodynamics across skin types using spatial frequency domain spectroscopy,” J. Biomed. Opt. 21(5), 057001 (2016). 10.1117/1.JBO.21.5.057001 [DOI] [PMC free article] [PubMed] [Google Scholar]
- 4.Gioux S., et al. , “First-in-human pilot study of a spatial frequency domain oxygenation imaging system,” J. Biomed. Opt. 16(8), 086015 (2011). 10.1117/1.3614566 [DOI] [PMC free article] [PubMed] [Google Scholar]
- 5.Tabassum S., et al. , “Feasibility of spatial frequency domain imaging (SFDI) for optically characterizing a preclinical oncology model,” Biomed. Opt. Express 7(10), 4154–4170 (2016). 10.1364/BOE.7.004154 [DOI] [PMC free article] [PubMed] [Google Scholar]
- 6.Laughney A. M., et al. , “Spectral discrimination of breast pathologies in situ using spatial frequency domain imaging,” Breast Cancer Res. 15(4), 1 (2013). 10.1186/bcr3455 [DOI] [PMC free article] [PubMed] [Google Scholar]
- 7.Saager R. B., et al. , “A light emitting diode (LED) based spatial frequency domain imaging system for optimization of photodynamic therapy of nonmelanoma skin cancer: quantitative reflectance imaging,” Lasers Surg. Med. 45(4), 207–215 (2013). 10.1002/lsm.v45.4 [DOI] [PMC free article] [PubMed] [Google Scholar]
- 8.Saager R. B., Cuccia D. J., Durkin A. J., “Determination of optical properties of turbid media spanning visible and near-infrared regimes via spatially modulated quantitative spectroscopy,” J. Biomed. Opt. 15(1), 017012 (2010). 10.1117/1.3299322 [DOI] [PMC free article] [PubMed] [Google Scholar]
- 9.Saager R. B., et al. , “In vivo measurements of cutaneous melanin across spatial scales: using multiphoton microscopy and spatial frequency domain spectroscopy,” J. Biomed. Opt. 20(6), 066005 (2015). 10.1117/1.JBO.20.6.066005 [DOI] [PMC free article] [PubMed] [Google Scholar]
- 10.Konecky S. D., et al. , “Hyperspectral optical tomography of intrinsic signals in the rat cortex,” Neurophotonics 2(4), 045003 (2015). 10.1117/1.NPh.2.4.045003 [DOI] [PMC free article] [PubMed] [Google Scholar]
- 11.Weber J. R., et al. , “Multispectral imaging of tissue absorption and scattering using spatial frequency domain imaging and a computed-tomography imaging spectrometer,” J. Biomed. Opt. 16(1), 011015 (2011). 10.1117/1.3528628 [DOI] [PMC free article] [PubMed] [Google Scholar]
- 12.Duarte M. F., et al. , “Single-pixel imaging via compressive sampling,” IEEE Signal Process. Mag. 25(2), 83–91 (2008). 10.1109/MSP.2007.914730 [DOI] [Google Scholar]
- 13.McMackin L., et al. , “A high-resolution SWIR camera via compressed sensing,” Proc. SPIE 8353, 835303 (2012). 10.1117/12.920050 [DOI] [Google Scholar]
- 14.O’sullivan T. D., et al. , “Diffuse optical imaging using spatially and temporally modulated light,” J. Biomed. Opt. 17(7), 071311 (2012). 10.1117/1.JBO.17.7.071311 [DOI] [PMC free article] [PubMed] [Google Scholar]
- 15.Süzen M., Giannoula A., Durduran T., “Compressed sensing in diffuse optical tomography,” Opt. Express 18(23), 23676–23690 (2010). 10.1364/OE.18.023676 [DOI] [PubMed] [Google Scholar]
- 16.Provost J., Lesage F., “The application of compressed sensing for photo-acoustic tomography,” IEEE Trans. Med. Imaging 28(4), 585–594 (2009). 10.1109/TMI.2008.2007825 [DOI] [PubMed] [Google Scholar]
- 17.Metzler C. A., Maleki A., Baraniuk R. G., “From denoising to compressed sensing,” arXiv:1406.4175 (2014).
- 18.Baraniuk R., et al. , “A simple proof of the restricted isometry property for random matrices,” Constr. Approximation 28(3), 253–263 (2008). 10.1007/s00365-007-9003-x [DOI] [Google Scholar]
- 19.Ayers F., et al. , “Fabrication and characterization of silicone-based tissue phantoms with tunable optical properties in the visible and near infrared domain,” Proc. SPIE 6870, 687007 (2008). 10.1117/12.764969 [DOI] [Google Scholar]
- 20.Nadeau K. P., Durkin A. J., Tromberg B. J., “Advanced demodulation technique for the extraction of tissue optical properties and structural orientation contrast in the spatial frequency domain,” J. Biomed. Opt. 19(5), 056013 (2014). 10.1117/1.JBO.19.5.056013 [DOI] [PMC free article] [PubMed] [Google Scholar]
- 21.Vervandier J., Gioux S., “Single snapshot imaging of optical properties,” Biomed. Opt. Express 4(12), 2938–2944 (2013). 10.1364/BOE.4.002938 [DOI] [PMC free article] [PubMed] [Google Scholar]
- 22.Domingue S. R., Winters D. G., Bartels R. A., “Hyperspectral imaging via labeled excitation light and background-free absorption spectroscopy,” Optica 2(11), 929–932 (2015). 10.1364/OPTICA.2.000929 [DOI] [Google Scholar]


