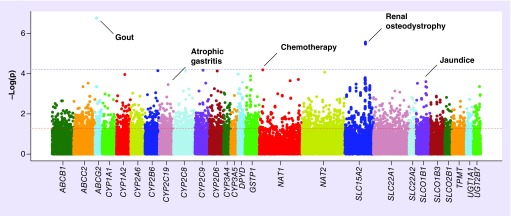
Figure 1. . Manhattan plot of phenome-wide association study results in European–Americans.
ADME Core variants grouped by gene are plotted on the X-axis against the -log10 of the p-value on the y-axis. The red and blue dashed lines show significance thresholds of 0.05 and phenome-wide significance (6.19 × 10⁻⁵), respectively. Annotations of the phecodes are provided for selected associations that met significance as a novel or replicated association. Width differences between genes reflect SNP coverage for individual genes on the ADME Core Panel passing quality control.
ADME: Absorption, distribution, metabolism, and elimination.

