Abstract
Background:
Diabetes mellitus (DM) represents by itself a major risk factor for cardiovascular events and the coexistence of obesity with consequent left ventricular volumetric overload could be responsible for further damages on left ventricular function. Aim of this study was to demonstrate the effect of body mass index (BMI) on left ventricular function in diabetes patients with no cardiovascular complications and with normal ejection fraction (EF).
Materials and Methods:
We evaluated 71 stable asymptomatic diabetes patients in optimal medical treatment and 24 healthy controls (C) (45% females; mean age: 58.4 +/− 9.4 years; BMI: 23.5 +/− 1.5). We stratified diabetes patients into two groups according to BMI: BMI <30 kg/m2 (A: 44 patients; 47% females; mean age: 60.9 +/− 6.6 years; BMI: 25.7 +/− 1.9; Diabetes duration: 9.1 +/− 9.5 years); BMI >30 kg/m2 (B: 27 patients; 37% females; mean age: 56.2 +/− 7.8 years; BMI: 33.0 +/− 2.1; Diabetes duration: 8.5 +/− 5.2 years). The following parameters were evaluated by conventional two dimensional (2D) echocardiography (GE VIVID 7) and tissue Doppler imaging (TDI): left ventricular dimensions (LVIDd; PWTd; IVSd), Left Ventricular Volumes (EDV, ESV), EF (by biplane Simpson’s method), Left Ventricular Mass (by ASE formula), peak mitral annular velocity at septal and lateral levels (Sm and Sl). Global longitudinal strain (GLS) was obtained off line by Speckle tracking imaging method using Echopac 10 software.
Results:
Groups A, B were comparable for diabetes duration and glycated hemoglobin level, history of hypertension, and lipid profile. The EF was similar in the three groups, (A: 64 +/− 6%; B: 63 +/− 4%; C: 61 +/−5%; P= NS). LVMass2.7 indexed for height was significantly higher in A and B in comparison with C (A: 45.2 +/− 8.1 g/m2.7; B: 46.1 +/− 9.6 g/m2.7; C: 39.5 +/− 4.9 g/m2.7; P < 0.05). The stroke volume index (SVi) was significantly lower in B vs A (B: 35.3 +/− 5.7 ml/m2; A: 39.3 +/7.1 ml/m2; P = 0.033). GLS was significantly lower in group B respect A and C (C: 20.9 +/− 1.3%; A: -20.3+/−2.6%; B: -19 +/− 2; P < 0.05; P < 0.01).
Conclusions:
In uncomplicated asymptomatic DM patients, the presence of first degree obesity plays an incremental role in adversely affecting left ventricular function and remodeling. The conventional echocardiographic methods such as the EF and the TDI are not so sensitive to identify the early LV dysfunction such as the evaluation of GLS by Speckle Tracking echocardiography. The longitudinal subendocardial fibers dysfunction in diabetes/obese patients could be derived by the complex interaction between metabolic (diabetes) and hemodynamic/endocrine abnormalities.
Keywords: BMI, diabetes, global longitudinal strain, obesity, speckle tracking
INTRODUCTION
Overweight and obesity, together with diabetes, are epidemic conditions of rapidly increasing proportion.[1,2] Obese patients are 30% more likely to develop heart failure and each 1 kg/m2 rise of body mass index (BMI) increases the risk of heart failure by 5% for men and by 7% for women. Long-term obesity is associated with early diastolic dysfunction, left ventricular hypertrophy, and left ventricular dilatation, resulting finally in cardiac failure.[3] Potential mechanisms that might contribute to the pathogenesis of cardiac dysfunction in obesity include accumulation of lipid in or around myocytes producing lipotoxicity, insulin resistance, and neuroendocrine activation.[4]
Ventricular remodeling is common, with LV eccentric hypertrophy developing in response to the expanded intravascular volume present in obesity. Afterload is elevated due to elevated vascular resistance caused by excess adipose tissue and higher artery stiffness.
These two potentially harmful conditions often coexist (mostly in patients affected by type 2 diabetes), creating a double adverse effect on left ventricular function. Recent developments in echocardiographic speckle tracking allow the quantification of myocardial deformation in longitudinal, radial, and circumferential dimensions. These new techniques for deformation assessment are more feasible than tissue Doppler-based approaches and are based on frame-by-frame tracking of echo-dense speckles within the myocardium and subsequent measurement of LV deformation.[5]
Two-dimensional strain is not angle-dependent and correlates well with EF measured both by echocardiography and magnetic resonance imaging (MRI). In particular, global longitudinal strain (GLS) correlates with measures of LV function, both echocardiographic and MRI derived, in populations with normal EF, chronic heart failure and myocardial infarction.[6] The calculation of GLS is reliable and quick across both experienced and inexperienced observers.
These applications offer the potential advantage of identifying slight myocardial dysfunction, allowing a better and earlier introduction of medical therapy together with a precise risk stratification.[6,7,8]
Patients with early diabetic cardiomyopathy often have evidence of global diastolic dysfunction but preserved systolic function, as reflected by a normal left ventricle LV ejection fraction (EF). Compared with left ventricle ejection fraction (LVEF), myocardial velocity, strain, and strain rate (SR) analyses are more sensitive indexes of LV function and have been demonstrated to be abnormal in patients with diabetes mellitus (DM).[9,10,11,12,13]
In patients with evidence of early systolic impairment, a prompt aggressive treatment of both conditions should be recommended to allow a real prognostic benefit.[14]
We sought to determine the additional role of increased BMI in a cohort of asymptomatic Type 2 diabetes patients referred to our center with no previous cardiovascular events as assessed by novel echocardiographic parameters.
MATERIALS AND METHODS
Patient populations
The study population included 71 stable asymptomatic diabetes patients. Patients were recruited among those followed by the Endocrinology and Metabolism Unit of this Hospital. Exclusion criteria included concomitant moderate-to-severe valve regurgitation or stenosis, depressed LVEF (50%), previous history of CAD (Coroanry Artery Disease) or recovery for CHF (Congestive Heart Failure) or other cardiovascular causes.
Clinical evaluation included the assessment of symptoms and a physical examination. In addition, demographic data and cardiovascular risk factors were recorded. Twenty-four healthy volunteers (C) were also investigated. These 24 subjects had no medical history of cardiovascular or pulmonary pathologies.
Diabetes patients were stratified according to BMI in two subgroups A: <30 kg/m2; B: >30 kg/m2.
In all patients, 2D transthoracic echocardiography and 2D-STI were performed. Conventional 2D echocardiography was performed using commercially available equipment (Vivid-7, General Electric Vingmed, Milwaukee, WI, USA). Data were acquired with a 3.5 MHz transducer (M4) in the parasternal (long- and short-axis views) and apical views (two- and four-chamber and apical long-axis views). Left ventricular dimensions were calculated from the standard M-mode images at the parasternal long-axis views and included LV diameters (EDD, ESD) and end-diastolic thickness of the interventricular septum (IVS) and posterior wall (PW). Left ventricular mass (LVM) was calculated using the formula recommended by ASE e Penn convention and corrected by the body surface area to derive LV mass index and by height2.7 (LVMass2.7). The LV end-diastolic and end-systolic volumes (EDV, ESV) were measured from the apical two- and four-chamber views (2CH, 4CH), and LVEF was calculated using the Simpson’s rule.[15]
Left atrial area (LA) and volume (LAV) were calculated using the modified Simpson’s method in 4CH and 2CH views.
Stroke volume (SV) was calculated considering left ventricular outflow tract (LVOT) diameter (obtained in parasternal long-axis view) and velocity time integral (VTI) of Pulsed Wave Doppler at the same level by the formula: LVOT diameter × 0.785 × VTI.
Left ventricular diastolic function was evaluated using early (E-wave) and late (A-wave) transmitral velocities, the E/A ratio, and the E-deceleration time (EDT) obtained by the spectral pulsed-wave Doppler recordings and by tissue Doppler imaging (TDI) was performed, adjusting gain and frame rate with angle between tissue and beam <30°. The peak early diastolic velocity (E’) was measured at the basal myocardial segments, on the apical 4CH, at mitral annulus level (Em’ for the septal and El’ for the lateral) and average value was considered. Finally E/e’ ratio was calculated.
Speckle-tracking imaging
LV myocardial strain (S) and SR was performed using 2D-STI. For this aim, standard 2D gray-scale images of the LV were acquired at parasternal mid-ventricular short-axis view and at conventional apical two- and four-chambers and apical long-axis views, with a frame rate between 50 and 70 frames/s. Strain and SR quantification was performed by using a commercially available software (EchoPAC version 10.0.0, General Electric-Vingmed). Data analysis was performed off-line and for each patient, GLS and SR were calculated. The software automatically traced a region of interest including the entire myocardial wall. The myocardial tracking was verified and the region-of-interest width was adjusted to optimize the tracking, if needed. Afterwards segmental strain analysis was performed by dividing each LV image into six segments. Peak systolic radial and circumferential S-and-SR values were calculated averaging the peak systolic values of the six segments from the LV mid-ventricular short-axis view. Peak systolic longitudinal S-and-SR was calculated averaging the peak systolic values of the 18 segments, derived from the 6 segments of the 3 apical views (two- and four-chambers and apical long-axis views) [Figure 1].
Figure 1.
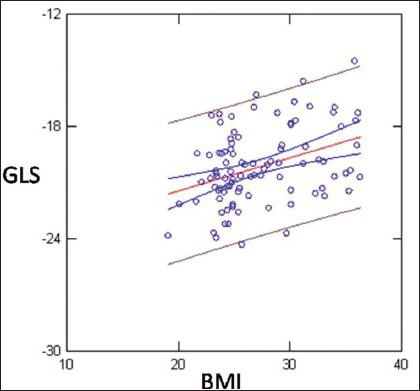
Linear Regression showed weak but statistically significant inverse correlation between BMI and GLS (r = 0.38; P < 0.0001)
Finally, S-and-SR data of diabetes patients were compared with data obtained from healthy controls patients.
Statistical analysis
Continuous data were expressed as mean and standard deviation. Analysis of variance was applied to determine the global statistical significance of the comparison between the three groups. The comparisons between inter-group variables were made applying the Scheffè test.
Finally, all correlations between examined parameters were expressed in terms of linear regression analysis. The statistical significance was fixed at P value <0.05.
Statistical analysis was performed with the software SYSTAT rel. 12.0.
RESULTS
Study population characteristics are reported in Tables 1 and 2.
Table 1.
Study population characteristics
| Group A | Group B | Group C | P value | P value | P value | P value | |
|---|---|---|---|---|---|---|---|
| Variables | Diabetics (44) | Diabetics (27) | Controls (24) | Global | A vs B | A vs C | B vs C |
| BMI kg/m2 | <30 | >30 | <30 | ||||
| Age years | 60.9 +/− 6.6 | 56.2 +/− 7.8 | 58.4+/− 9.4 | 0.049 | 0.053 | 0.43 | 0.62 |
| Height cm | 167+/−8.6 | 170+/−7.7 | 166+/−8.6 | 0.10 | — | — | — |
| Weight kg | 72.1+/− 8.7 | 96.4 +/−10.1 | 65 +/− 8.1 | <0.0001 | <0.001 | <0.01 | <0.0001 |
| Female | 21 (47%) | 10 (37%) | 11 (45%) | 0.67 | — | — | — |
| SAP mmHg | 143 +/−15.9 | 142 +/− 16 | 120.5 +/− 9.8 | <0.0001 | 0.93 | <0.0001 | <0.0001 |
| DAP mmHg | 81.5 +/− 9.2 | 84.3 +/− 10.0 | 78.8 +/− 5.6 | 0.089 | — | — | — |
| MAP mmHg | 102 +/− 9.6 | 103 +/− 10.5 | 92 +/− 6.4 | <0.0001 | 0.81 | <0.001 | <0.0001 |
| HR bpm | 76.5 +/− 12.6 | 79.3+/− 12.6 | 68.9 +/− 10.6 | 0.008 | 0.64 | 0.052 | 0.012 |
| Diabetes Duration years | 9.1 +/− 9.5 | 8.5 +/− 5.2 | — | 0.92 | — | — | — |
| Waist cm | 96.7+/− 7.1 | 114.4 +/− 9.9 | 81.9 +/− 9.2 | <0.0001 | <0.0001 | <0.0001 | <0.0001 |
| Tot Col mg/dl | 188 +/− 29 | 185 +/− 31 | 225+/− 43 | <0.001 | 0.90 | <0.0001 | <0.0001 |
| HDL mg/dl | 51 +/− 10 | 49 +/− 11 | 61 +/− 14 | 0.014 | 0.75 | <0.05 | <0.01 |
| LDL mg/dl | 118 +/− 29 | 109 +/− 6 | 144 +/− 40 | 0.007 | 0.55 | 0.035 | 0.007 |
| TG mg/dl | 127 +/− 56 | 166 +/− 112 | 112 +/− 36 | 0.058 | — | — | — |
| HB1AC % | 7.3 +/− 1.0 | 7.3 +/− 0.9 | — | 0.88 | — | — | — |
| Glicemia mg/dl | 137 +/− 43 | 149 +/− 35 | 83 +/− 8 | <0.0001 | 0.36 | <0.0001 | <0.0001 |
| Treatment for hypertension | 19 | 11 | — | 0.5 | — | — | — |
Table 2.
Echocardiohraphic variables
| Group A | Group B | Group C | P value | P value | P value | P value | |
|---|---|---|---|---|---|---|---|
| Variables | Diabetics (44) | Diabetics (27) | Controls (24) | Global | A vs B | A vs C | B vs C |
| BMI | <30 BMI | >30 BMI | <30 BMI | ||||
| LAD cm | 3.6 +/− 0.3 | 3.9 +/− 0.3 | 3.5 +/− 0.4 | 0.004 | 0.035 | 0.59 | 0.007 |
| Atrial volume ml | 53.4+/− 15.1 | 60.3 +/− 15.3 | 50.9 +/− 14 | 0.065 | — | — | — |
| LVIDd cm | 5.04 +/− 0.3 | 5.08 +/−0.3 | 4.94 +/− 0.3 | 0.40 | — | — | — |
| LVIDd index cm/m2 | 2.7 +/− 0.2 | 2.4 +/− 0.1 | 2.8 +/− 0.1 | <0.0001 | <0.001 | 0.037 | <0.0001 |
| LV MASS g | 180 +/− 32 | 195 +/− 41 | 155 +/− 26 | <0.0001 | 0.24 | 0.02 | <0.001 |
| LV MASS2.7 g | 45.2+/8.1 | 46.1+/−9.6 | 39.5+/−4.9 | 0.007 | 0.9 | 0.022 | 0.018 |
| EDV ml | 87 +/− 15 | 93+/−13 | 90+/− 15 | 0.17 | — | — | — |
| EDVi ml/m2 | 47,7 +/− 7.7 | 44,4 +/− 5.1 | 52,1 +/−6,4 | <0.001 | 0.4 | 0.044 | <0.001 |
| EF % | 64 +/0.06 | 63+/−0.04 | 61+/− 0.05 | 0.18 | — | — | — |
| RWT | 0.37 +/−0.05 | 0.38 +/−0.03 | 0.35+/−0.03 | 0.04 | 0.59 | 0.19 | 0.044 |
| LVOT cm | 2.08 +/−0.1 | 2.17+/−0.1 | 2.0+/−0.1 | 0.013 | <0.05 | 0.9 | 0.07 |
| VTI cm | 20.8 +/− 3.1 | 19.9+/−2.5 | 19.6 +/−2.5 | 0.19 | — | — | — |
| SVi ml/m2 | 39.3 +/− 7.1 | 35.3+/− 5.7 | 38.9+/− 5,1 | 0.026 | <0.05 | 0.9 | 0.12 |
| Peak E cm/s | 75 +/−14 | 73+/−16 | 69+/−11 | 0.20 | — | — | — |
| E/A | 0.90 +/−0.1 | 0.91+/− 0.1 | 1.0+/− 0.2 | 0.19 | — | — | — |
| DT ms | 210 +/− 38 | 215 +/− 39 | 199 +/− 27 | 0.31 | — | — | — |
| E’ lateral cm/s | 9.5 +/− 2.3 | 9.7 +/− 2.4 | 11.7 +/− 3.0 | 0.004 | 0.9 | <0.01 | <0.05 |
| E’ septal cm/s | 7.0 +/− 1.6 | 6.6 +/− 1.4 | 8.7 +/− 2.2 | <0.0001 | 0.9 | <0.05 | <0.0001 |
| E/e’ (average) | 9.3 +/− 3.4 | 9.0 +/− 1.9 | 7.0 +/− 1.6 | 0.004 | 0.9 | <0.01 | <0.05 |
| TDI s sept cm/s | 9.0 +/− 1.5 | 8.8 +/− 1.6 | 8.7 +/− 1.2 | 0.82 | — | — | — |
| TDI s lat cm/s | 9.1+/− 3.3 | 10.5 +/− 2.3 | 9.8 +/− 1.7 | 0.10 | — | — | — |
| TDI s rv cm/s | 15.4 +/− 2.6 | 15.3 +/− 2.6 | 15.2 +/− 2.6 | 0.93 | — | — | — |
| TAPSE mm | 24.1 +/− 3 | 23.8 +/− 3 | 24.2+/− 2.9 | 0.88 | — | — | — |
| GLS% | −20.3 +/− 2.6 | −19.0+/− 2.0 | −20.9 +/− 1.3 | <0.001 | 0.019 | 0.42 | 0.002 |
| GCS% | −20.6 +/−2.5 | −20.3 +/− 5.0 | −20.1 +/− 2.9 | 0.90 | — | — | — |
| GRS% | 43.6 +/−12 | 36.2+/− 9.3 | 50.6 +/− 9.2 | 0.017 | 0.12 | 0.34 | <0.05 |
| Global longitudinal | −1.1 +/−0.17 | −1.06+/− 0.15 | −1.1 +/− 0.14 | 0.33 | — | — | — |
| strain rate S 1/s |
We evaluated 71 stable asymptomatic diabetes patients, following an optimal medical treatment (all patients were treated with oral antidiabetic drugs, statins and the vast majority of cases antiplatelet drugs).
We stratified diabetes patients in two groups according to BMI: BMI <30 kg/m2 (A: 44 patients; 47% females; mean age: 60.9 +/– 6.6 years; BMI: 25.7 +/– 1.9; Diabetes duration: 9.1 +/– 9.5 years); BMI >30 kg/m2 (B: 27 patients; 37% females; mean age: 56.2 +/– 7.8 years; BMI: 33.0 +/– 2.1; Diabetes duration: 8.5 +/– 5.2 years) and 24 healthy controls (C) (45% females; mean age: 58.4 +/– 9.4 years; BMI: 23.5 +/– 1.5).
Diabetes patients were comparable for diabetes duration and glycated hemoglobin level values (P = ns). Patients with history of hypertension in diabetic groups were similar (B: 11 (41%); A: 19 (43%)) with comparable control of blood pressure values (P = ns). Diabetes patient’s treatment also included lipid lowering drugs (statins), thus explaining lower values of total cholesterol and LDL - cholesterol respective to control (A: 188 +/– 29; B: 185 +/– 31; C: 225+/– 43; mg/dl, P < 0.0001).
EF was similar in the three groups (A: 64 +/–6%; B: 63 +/– 4%; C: 61 +/– 5%; P = ns) as also PW TDI-derived systolic motion (S) at mitral level (S Septal: A: 9.0 +/– 1.5; B: 8.8 +/– 1.6; C: 8.7 +/– 1.2; S Lateral: A: 9.1+/–3.3; B: 10.5 +/– 2.3; C: 9.8 +/– 1.7 cm/s; P = ns).
Atrial volume was slightly higher in diabetes patients compared with controls without statistical significance (A: 53.4+/– 15.1; B: 60.3 +/– 15.3; C: 50.9 +/– 14 ml; P = 0.07).
In the control patients, EDDi was significantly lower in group B (A: 2.7 +/ -0.2; B: 2.4 +/– 0.1; C: 2.8 +/– 0.1; P < 0.001; P < 0.0001).
LVMass2.7 indexed for height was significantly higher in A and B in comparison with C (A: 45.2 +/–8.1 g/m2.7; B: 46.1+/– 9.6 g/m2.7; C: 39.5 +/– 4.9 g/m2.7; P < 0.05) with prevalent concentric remodeling in diabetics (RWT: A: 0.37 +/– 0.05; B: 0.38 +/– 0.03; C: 0.35 +/– 0.03; P < 0.05). The stroke volume index (SVi) was significantly lower in B vs A (B: 35.3 +/– 5.7 ml/m2; A: 39.3 +/– 7.1 ml/m2; P = 0,033). The main standard Doppler parameters of diastolic function such as mitral E wave; A wave, DT time and E/A ratio were substantially comparable between groups (peak E: 75 +/– 14; B: 73 +/– 16; C: 69 +/– 11 cm/s; P = NS; E/A: 0.90 +/– 0.1; B: 0.91 +/– 0.1; C: 1.0 +/– 0.2; P = ns; DT: A: 210 +/– 38; B: 215 +/– 39; C: 199 +/– 27 msec; P = ns). However, parameters of diastolic function derived by PW-TDI sampled at mitral annular level (septal and lateral) were altered in diabetes patients (E’ lateral: A: 9.5 +/– 2.3; B: 9.7 +/– 2.4; C: 11.7 +/– 3.0; E’ septal: A: 7.0 +/– 1.6; B: 6.6 +/– 1.4; C: 8.7 +/– 2.2). E/e’ (averaged by lateral and septal level) value was higher in diabetic (A: 9.3 +/– 3.4; B: 9.0 +/– 1.9: C: 7.0 +/– 1.6) compared with controls. Longitudinal function evaluated by speckle tracking analysis showed decreased GLS in diabetes patients with statistical significance only reached in the obese subjects group (B) (A: -20.3 +/– 2.6%; B: -19 +/– 2.0%; C: -20.9 +/– 1.3; P = 0,002). In analogous manner global radial strain (GRS) was decreased (A: 43.6 +/– 12; B: 36.2 +/– 9.3; C: 50.6 +/– 9.2%; P = 0.02), whereas the global circumferential strain (GCS) was not (A: -20.6 +/– 2.5; B: -20.3 +/– 5.0; C: -20.1 +/– 2.9%; P = ns).
Linear Regression analysis showed weak but statistically significant inverse correlation between BMI and GLS (reduction of GLS absolute values with incremental BMI values) SVi and EDDi (GLS>>BMI r = 0.38; P < 0.0001; GLS >>SVi; r = 0.22; P < 0.03; EDDi: 0.32; P < 0.005) [Figures 1–3]. GLS showed inverse correlation by LVM (r = 0.25; P = 0.01) [Figure 4].
Figure 3.
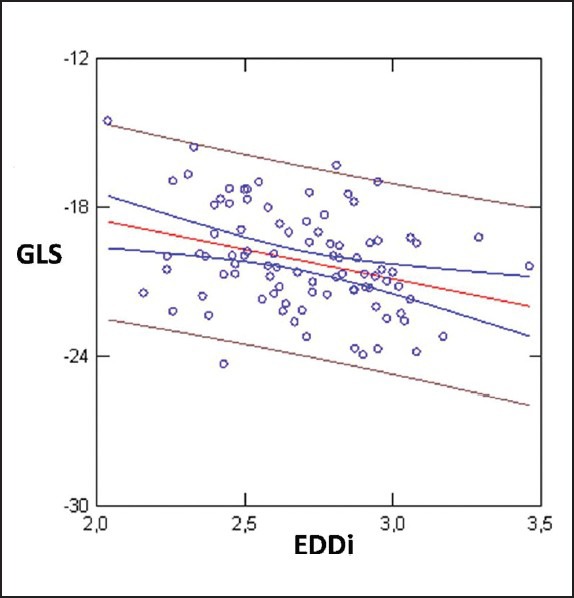
Linear Regression between GLS and EDDi; r = 0,32; P < 0.005
Figure 4.
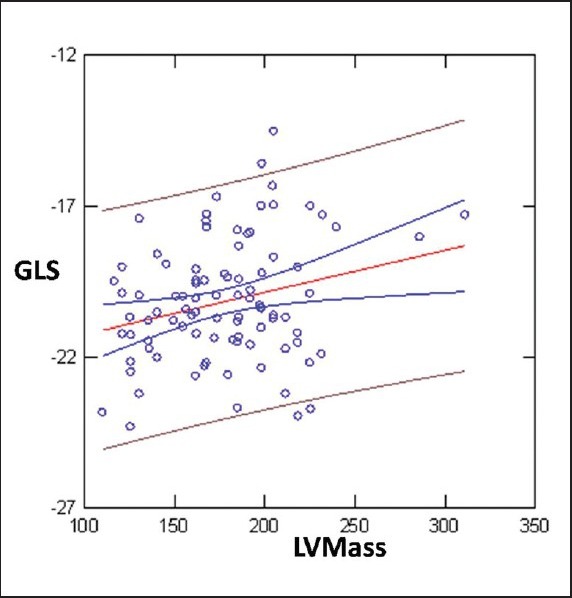
GLS showed inverse correlation by Left ventricular Mass (r = 0.25; P = 0.01)
Figure 2.
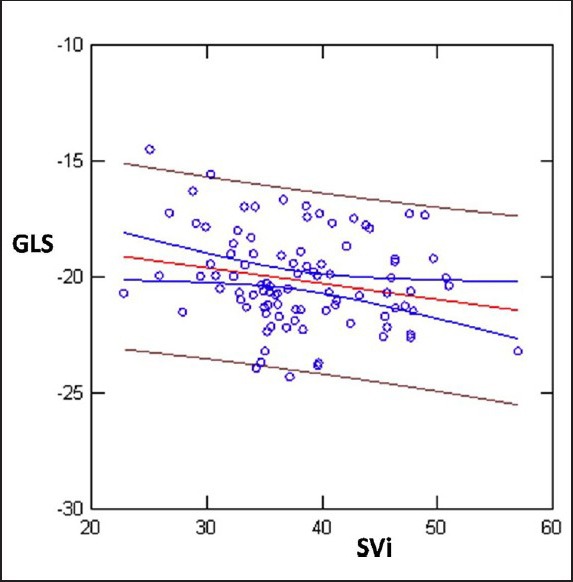
Linear Regression between GLS and SVi; r = 0.22; P < 0.03
Likewise GRS correlated with BMI SVi and EDDi (SVi r = 0.30; P = 0,035; BMI; r = 0.38; P = 0.006) [Figure 5]. Multiple R (0.52; P < 0.0001) with GLS (dependent variable), BMI (P < 0.01); LVmass (P < 0.064); SVi (P < 0.165); S (P < 0.019); Age (P < 0.084).
Figure 5.
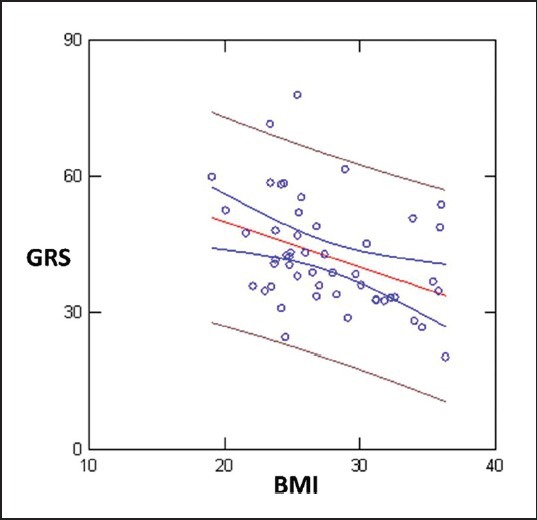
GRS correlated with BMI; r = 0.38; P = 0.006
DISCUSSION
The main points that emerge from our study are:
In patients with coexisting diabetes and obesity can be observed, even by standard echocardiography, structural abnormalities of ventricular geometry secondary to metabolic and pathophysiological changes described in patients with obesity and diabetes.
Despite the EF and the TDIs are substantially similar among the considered groups, the study of the function by longitudinal GLS detects that this is the only functional parameter able to discriminate the two groups.
The impairment of longitudinal function (assessed by GLS) is associated with a reduction of the SVi and inversely correlated with BMI, LV mass, and EDDi.
Standard echocardiography and left ventricular remodeling
In the real world, diabetes and obesity often coexist exposing patients to an increased risk of cardiovascular events. With our study, we tried to highlight structural and functional abnormalities in the preclinical stage, capable of characterizing this patients population which, as we know, are burdened with a worse prognosis and at the same time, thanks to the advances in medical therapy, are an ideal target for a more aggressive preventive strategy, even in a preclinical stage. (Stage B HF).[16,17,18]
In agreement with the existing literature, obese and diabetes patients already have at the conventional echocardiographic study some structural abnormalities ranging from a progressive increase in LVM (LVM index values highlighted by 2.7 higher in patients than in healthy controls) to a more marked diastolic impairment (stage I diastolic dysfunction), with significantly higher E/e’ values (assessed by PW-TDI and Mitral Inflow).[19]
However, only in the group of obese diabetes patients are observed indexed ventricular diameters significantly reduced (EDDI) and a significantly higher RWT highlighting a greater degree of concentric remodeling and/or left ventricular hypertrophy.
The presence of a ventricular concentric remodeling is also associated with a tendency to smaller indexed ventricular volumes, EDVI (mostly in group B). Furthermore, the LAVi was higher in group B compared with controls, as a result of the increase in preload and the presence of diastolic dysfunction, commonly observed in diabetes patients and obese.
Despite these structural differences, EF values did not differ between groups (values showed no difference inter (A, B vs. C) and intragroups (A vs. B)), confirming the hypothesis that in the context of remodeling/concentric hypertrophy this cavity index (EF) is notable to adequately discriminate subjects with impairment of systolic function, thus losing its predictive power.
Similarly also the values of s’ (TDI-derived) are notable to properly stratify patients compared with controls.
Despite a normal EF, diabetes patients have a lower SVi inversely correlated with the progressive increase in BMI and this relationship reaches statistical significance only in the subgroup of obese patients (B).
The hemodynamic impact on left ventricular systolic function can therefore be largely underestimated if using only indices such as EF (which is affected by the geometry of the chamber and of changes in preload and afterload) or TDI (which has limitations primarily related to angle dependence and tethering).
The coexistence of obesity and diabetes appears therefore associated to a greater degree of remodeling/left ventricular hypertrophy compared with only diabetes patients; in this condition the definition of preserved systolic function, based only on EF, is therefore misleading as clearly demonstrated by the reduced values of SVi.
Speckle tracking analysis
Speckle Tracking Echocardiography allows a more accurate assessment of left ventricular systolic function, which is not affected by geometric assumptions, and within certain limits closely correlates with the work of ventricular ejection.
In particular, according to the most accepted model of cardiac mechanics (“egg-shell”), left ventricular SV would be determined for about 80% by the shortening of left ventricular subendocardial fibers, while about 5% would be correlated to circumferential shortening and the remaining 15% to twist mechanism.
Compared with LVEF and TDI s’, strain, and SR are much more sensitive for the study of ventricular function and have been found useful in characterizing patients with DM highlighting changes already in the early stages of the disease.[12,13,24,25]
In our study population, despite EF being comparable between groups, the assessment of global longitudinal function using GLS was significantly reduced in patients with diabetes, with a linear relationship in respect to the increase in BMI and this in addition to a lowering GRS.
However, only in obese patients, GLS is not only statistically reduced in respect to diabetes patients, but also compared with healthy controls. GRS is significantly lower just in the obese compared with controls, while GCS does not show significant differences in the comparison among the three groups. Analysis of distribution frequency shows that while in normal subjects, all values of GLS were >18% (currently considered the threshold value between normal and pathological) with values between −18.7% and −23.8%, on the contrary both in the group of patients with diabetes (group A) and in the group of diabetes patients and obese (group B) the GLS values were reduced and frankly pathological (Group B: values between −22.2% and −14.5%; group A: −24.3% and −16.3%) [Figure 6].
Figure 6.
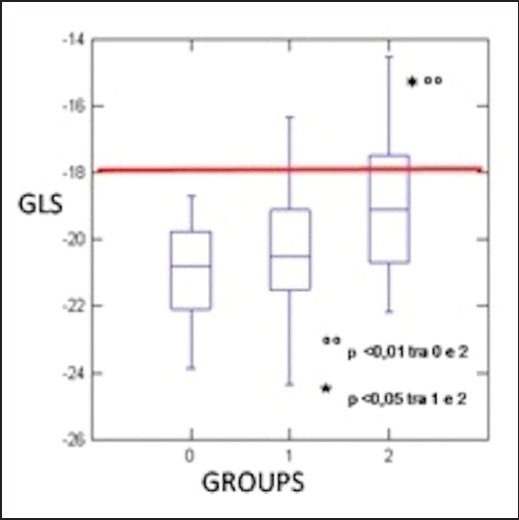
Analysis of distribution frequency. In the group of obese patients, 40% showed the values of GLS < 18% despite a normal EF, while in group A only 15% of the subjects had a GLS < 18%. None of the controls had a GLS < 18%
In particular, in the group of obese patients, 40% (11/27) showed the values of GLS <1 8% despite abnormal EF, while in group A only 15% (7/44) of the subjects had a GLS < 18%.
As a confirmation of what was previously discussed, GLS values correlate significantly, albeit weakly, with the values of SVi providing at least in part a mechanical explanation to the reduction of the SV observed in this group of patients. In fact, the lower SV, observed in these patients would be secondary to the lower deformation in the longitudinal plane, which as emphasized above, is the main contribution to ventricular ejection. GLS also inversely correlates with BMI and with cardiac mass.
In this context, once again it is evident that the presence of obesity is crucial in reducing left ventricular systolic function, probably because of complex metabolic adaptation present in these patients. In fact, as previous studies have shown, lipotoxicity, insulin resistance, lipid accumulation in the extracellular space as well as neuroendocrine activation may be the mechanisms involved in the determinism of systolic–diastolic left ventricular dysfunction in obese patient.[1,20,21]
Likewise, the development of myocardial fibrosis, glucose toxicity and microvascular disease have been called upon to explain abnormalities in the diabetic cardiomyopathy, however, detectable at an early stage only using GLS.[22,23]
Limitations
The present study included a limited group of patients, thus limiting the predictive power of regression analysis and correlation between variables. The challenging selection of patients in absence of comorbidities of cardiac history and a poor acoustic window in obese subjects (also in mild ones) could represent a partial explanation of this limitation.
CONCLUSION
Actual guidelines tend to emphasize the concept of heart failure with preserved EF, respective to diastolic heart failure, thus underlining the concept of concomitant, dual ventricular dysfunction, coupling systole, and diastole.[16,26]
Our paper adds, to previous evidence, the net effect of increasing body weight in detrimental progression to systolic dysfunction. Left ventricular systolic function is the final result of simultaneous longitudinal and circumferential shortening, radial thickening, and finally twisting. Because of the high vulnerability of longitudinal sub-endocardial fibers, assessment of the longitudinal component of LV shortening is relevant for the early detection of LV contractile impairment.
More interestingly, the relation between GLS and SVi reveal the real nature of contractile parameter detained by GLS respective to other parameters and the superior utility for patient stratification.
Compared with previous data in uncomplicated diabetic population (LV longitudinal systolic function impairment with circumferential and radial strain preservation), we found a decreased GRS value as the probable net effect of diabetes and increasing BMI.[12,24]
Further investigations are needed to allow the analysis of genetic polymorfisms that characterize this type of patients, in a more comprehensive knowledge of the complex interaction between obesity and diabetes and with a deeper study of various aspects as the analysis of endocrine and metabolism factors.
ACKNOWLEDGMENTS
The authors thank Dr Giovanna Lastrucci for revision and editorial assistance.
Footnotes
Source of Support: Nil
Conflict of Interest: None declared.
REFERENCES
- 1.Whitlock G, Lewington S, Sherliker P, Clarke R, Emberson J, Halsey J, et al. Prospective Studies Collaboration. Body-mass index and cause-specific mortality in 900 000 adults: Collaborative analyses of 57 prospective studies. Lancet. 2009;373:1083–96. doi: 10.1016/S0140-6736(09)60318-4. [DOI] [PMC free article] [PubMed] [Google Scholar]
- 2.Aguilar D. Heart failure and diabetes: Time to pay attention. Am Heart J. 2011;162:795–7. doi: 10.1016/j.ahj.2011.08.016. [DOI] [PubMed] [Google Scholar]
- 3.Ashrafian H, Athanasiou T, le Roux CW. Heart remodelling and obesity: The complexities and variation of cardiac geometry. Heart. 2011;97:171–2. doi: 10.1136/hrt.2010.207092. [DOI] [PubMed] [Google Scholar]
- 4.Poirier P, Giles TD, Bray GA, Hong Y, Stern JS, Pi-Sunyer FX, et al. American Heart Association, Obesity Committee of the Council on Nutrition, Physical Activity, and Metabolism. Obesity and cardiovascular disease: Pathophysiology, evaluation, and effect of weight loss: An update of the 1997 American Heart Association Scientific Statement on Obesity and Heart Disease from the Obesity Committee of the Council on Nutrition, Physical Activity, and Metabolism. Circulation. 2006;113:898–918. doi: 10.1161/CIRCULATIONAHA.106.171016. [DOI] [PubMed] [Google Scholar]
- 5.Mor-Avi V, Lang RM, Badano LP, Belohlavek M, Cardim NM, Derumeaux G, et al. Current and evolving echocardiographic techniques for the quantitative evaluation of cardiac mechanics: ASE/EAE consensus statement on methodology and indications endorsed by the Japanese Society of Echocardiography. J Am Soc Echocardiogr. 2011;24:277–313. doi: 10.1016/j.echo.2011.01.015. [DOI] [PubMed] [Google Scholar]
- 6.Stanton T, Leano R, Marwick TH. Prediction of all-cause mortality from global longitudinal speckle strain: Comparison with ejection fraction and wall motion scoring. Circ Cardiovasc Imaging. 2009;2:56–64. doi: 10.1161/CIRCIMAGING.109.862334. [DOI] [PubMed] [Google Scholar]
- 7.Marwick TH, Leano RL, Brown J, Sun JP, Hoffmann R, Lysyansky P, et al. Myocardial strain measurement with 2-dimensional speckle-tracking echocardiography definition of normal range. JACC Cardiovasc Imaging. 2009;2:80–4. doi: 10.1016/j.jcmg.2007.12.007. [DOI] [PubMed] [Google Scholar]
- 8.Marwick TH. Consistency of myocardial deformation imaging between vendors. Eur J Echocardiogr. 2010;11:414–6. doi: 10.1093/ejechocard/jeq006. [DOI] [PubMed] [Google Scholar]
- 9.Voors AA, van der Horst IC. Diabetes: A driver for heart failure. Heart. 2011;97:774–80. doi: 10.1136/hrt.2009.183624. [DOI] [PubMed] [Google Scholar]
- 10.Kamalesh M, Subramanian U, Sawada S, Eckert G, Temkit M, Tierney W. Decreased survival in diabetic patients with heart failure due to systolic dysfunction. Eur J Heart Fail. 2006;8:404–8. doi: 10.1016/j.ejheart.2005.10.005. [DOI] [PubMed] [Google Scholar]
- 11.Di Cori A, Di Bello V, Miccoli R, Talini E, Palagi C, Delle Donne MG, et al. Left ventricular function in normotensive young adults with well-controlled type 1 diabetes mellitus. Am J Cardiol. 2007;99:84–90. doi: 10.1016/j.amjcard.2006.07.063. [DOI] [PubMed] [Google Scholar]
- 12.Ng AC, Delgado V, Bertini M, van der Meer RW, Rijzewijk LJ, Shanks M, et al. Findings from left ventricular strain and strain rate imaging in asymptomatic patients with type 2 diabetes mellitus. Am J Cardiol. 2009;104:1398–401. doi: 10.1016/j.amjcard.2009.06.063. [DOI] [PubMed] [Google Scholar]
- 13.Htay T, Mehta D, Heo J, Iskandrian AE. Left ventricular function in patients with type 2 diabetes mellitus. Am J Cardiol. 2005;95:798–801. doi: 10.1016/j.amjcard.2004.11.043. [DOI] [PubMed] [Google Scholar]
- 14.Struthers AD, Morris AD. Screening for and treating left-ventricular abnormalities in diabetes mellitus: A new way of reducing cardiac deaths. Lancet. 2002;359:1430–2. doi: 10.1016/S0140-6736(02)08358-7. [DOI] [PubMed] [Google Scholar]
- 15.Lang RM, Bierig M, Devereux RB, Flachskampf FA, Foster E, Pellikka PA, et al. American Society of Echocardiography’s Nomenclature and Standards Committee, Task Force on Chamber Quantification, American College of Cardiology Echocardiography Committee; American Heart Association, European Association of Echocardiography, European Society of Cardiology. Recommendations for chamber quantification. Eur J Echocardiogr. 2006;7:79–108. doi: 10.1016/j.euje.2005.12.014. [DOI] [PubMed] [Google Scholar]
- 16.McMurray J, Adamopoulos S, Anker S, Auricchio A, Böhm M, Dickstein K, et al. ESC Committee for Practice Guidelines. ESC guidelines for the diagnosis and treatment of acute and chronic heart failure 2012: The Task Force for the Diagnosis and Treatment of Acute and Chronic Heart Failure 2012 of the European Society of Cardiology. Developed in collaboration with the Heart Failure Association (HFA) of the ESC. Eur J Heart Fail. 2012;14:803–69. doi: 10.1093/eurjhf/hfs105. [DOI] [PubMed] [Google Scholar]
- 17.Goldberg LR, Jessup M. Stage B heart failure: Management of asymptomatic left ventricular systolic dysfunction. Circulation. 2006;113:2851–60. doi: 10.1161/CIRCULATIONAHA.105.600437. [DOI] [PubMed] [Google Scholar]
- 18.Ammar KA, Jacobsen S, Mahoney D, Kors JA, Redfield MM, Burnett JC, Jr, et al. Prevalence and prognostic significance of heart failure stages: Application of the American College of Cardiology/American Heart Association Heart Failure Staging Criteria in the Community. Circulation. 2007;115:1563–70. doi: 10.1161/CIRCULATIONAHA.106.666818. [DOI] [PubMed] [Google Scholar]
- 19.Di Bello V, Fabiani I, Conte L, Barletta V, Delle Donne MG, Cuono C, et al. New echocardiographic techniques in the evaluation of left ventricular function in obesity. Obesity (Silver Spring) 2013;21:881–92. doi: 10.1002/oby.20071. [DOI] [PubMed] [Google Scholar]
- 20.Barbosa MM, Beleigoli AM, de Fatima Diniz M, Freire CV, Ribeiro AL, Nunes MC. Strain imaging in morbid obesity: Insights Into subclinical ventricular dysfunction. Clin Cardiol. 2011;34:288–93. doi: 10.1002/clc.20907. [DOI] [PMC free article] [PubMed] [Google Scholar]
- 21.Orhan AL, Uslu N, Sennur SU, Nurkalem Z, Uzun F, Erer HB, et al. Effects of isolated obesity on left and right ventricular function: A tissue doppler and strain rate imaging study. Echocardiography. 2010;27:236–43. doi: 10.1111/j.1540-8175.2009.01024.x. [DOI] [PubMed] [Google Scholar]
- 22.Ballo P, Cameli M, Mondillo S, Giacomin E, Lisi M, Padeletti M, et al. Impact of diabetes and hypertension on left ventricular longitudinal systolic function. Diabetes Res Clin Pract. 2010;90:209–15. doi: 10.1016/j.diabres.2010.08.004. [DOI] [PubMed] [Google Scholar]
- 23.van Heerebeek L, Hamdani N, Handoko ML, Falcao-Pires I, Musters RJ, Kupreishvili K, et al. Diastolic stiffness of the failing diabetic heart: Importance of fibrosis, advanced glycation end products, and myocyte resting tension. Circulation. 2008;117:43–51. doi: 10.1161/CIRCULATIONAHA.107.728550. [DOI] [PubMed] [Google Scholar]
- 24.Ng AC, Delgado V, Bertini M, van der Meer RW, Rijzewijk LJ, Hooi Ewe S, et al. Myocardial steatosis and biventricular strain and strain rate imaging in patients with Type 2 Diabetes Mellitus. Circulation. 2010;122:2538–44. doi: 10.1161/CIRCULATIONAHA.110.955542. [DOI] [PubMed] [Google Scholar]
- 25.Cook S, Varela-Carver A, Mongillo M, Kleinert C, Khan MT, Leccisotti L, et al. Abnormal myocardial insulin signalling in type 2 diabetes and left-ventricular dysfunction. Eur Heart J. 2010;31:100–11. doi: 10.1093/eurheartj/ehp396. [DOI] [PMC free article] [PubMed] [Google Scholar]
- 26.Hunt SA, Abraham WT, Chin MH, Feldman AM, Francis GS, Ganiats TG, et al. 2009 focused update incorporated into the ACC/AHA 2005 Guidelines for the Diagnosis and Management of Heart Failure in Adults: A report of the American College of Cardiology Foundation/American Heart Association Task Force on Practice Guidelines: Developed in collaboration with the International Society for Heart and Lung Transplantation. Circulation. 2009;119:e391–479. doi: 10.1161/CIRCULATIONAHA.109.192065. [DOI] [PubMed] [Google Scholar]


