

Abstract
Context:
The concept of visceral fat and its role in various metabolic disorders is well-known. Epicardial fat (EF) is also visceral fat, and very few studies are done, especially in the Indian subcontinent.
Aims:
To study and establish the relationship of EF thickness (EFT) and abdominal visceral fat thickness (VAT) in obese and nonobese type 2 diabetics and to evaluate the usefulness of EFT as a marker of visceral adiposity.
Settings and Designs:
This cross-sectional study was carried out in the Department of Medicine, JSS Hospital, Mysore, India, between October 2012 and October 2014.
Materials and Methods:
A total of 68 patients were studied. Patients underwent transthoracic echocardiography and ultrasound abdomen. EFT and VAT were measured.
Statistical Analysis:
SPSS version 17.0 (SPSS Inc., Chicago, IL, USA) was used. T-test used for comparing quantitative variables. Correlation analysis was done using Pearson correlation test. P ≤ 0.05 was considered statistically significant. Kruskal-Wallis and Mann-Whitney test were used for analysis.
Results:
The mean value of EFT was 5.92 mm, 7.43 mm, 12.97 mm, 11.27 mm, and 13.8 mm for nonobese, obesity Grade I, II, III, and morbid, respectively (P < 0.0001). The mean EFT between nonobese and obese diabetics was 5.92 mm and 10.2 mm, respectively (P < 0.0001). The mean VAT between nonobese and obese diabetics was 16.58 mm and 38.53 mm, respectively. EFT was significantly correlating with VAT in obese diabetics.
Conclusion:
EFT and VAT were significantly correlated among obese diabetics while not significantly correlated among nonobese diabetics, suggesting obesity is an independent risk factor for visceral adipose tissue deposition both in abdomen as well as in epicardial surface.
Keywords: Epicardial fat thickness, obesity in type 2 diabetes mellitus, visceral adiposity
INTRODUCTION
Obesity is one of the deadliest modern epidemics with exponential rise which make millions at risk for obesity-related morbidity and mortality, one of the significant diseases is coronary artery disease (CAD). Epicardial fat (EF) situated within the pericardium is a type of visceral adipose tissue which exerts local paracrine effects on coronary vessels and increases atherosclerosis.
The aims of the study were to study and establish the relationship of EF thickness (EFT) and visceral fat thickness (VAT) in obese and nonobese type 2 diabetes mellitus, and to evaluate the usefulness of EFT as a marker of visceral adiposity.
MATERIALS AND METHODS
Study setting: This study was carried out in the Department of Medicine, J.S.S. Hospital, Mysore.
Study design: This was a cross-sectional study.
Study period: The study was carried out between October 2012 and October 2014. Patients satisfying the following criteria were included in the study.
Inclusion criteria
Patients with body mass index (BMI) >25 were taken up as cases, and BMI 18-23 were taken up as controls.
Age between 18 and 55 years.
Patients of both sexes were studied.
Exclusion criteria
Subjects with BMI <18 and between 23 and 25.
Patients on any lipid lowering therapy.
Hypothyroidism.
Ascites.
Pregnancy.
Patients not willing for the study.
Patients with h/o previous cardiac, abdominal, or bariatric surgeries.
Methods
Echocardiography was performed using Philips HD 11 XE Machine by a single observer. Three measurements were done, and the average value was taken. It is defined as a relative echo-free space between the outer wall of myocardium and the visceral layer of pericardium, and its thickness was measured in parasternal long and short axis B-mode still free images perpendicular to the free wall of right ventricle at end-systole, using the aortic annulus as the anatomic reference for the parasternal long axis view and the papillary muscle level for short axis view.
Ultrasound abdomen was performed using Philips HD 11 XE Machine. Three measurements were done, and the average value was taken for statistical analysis. Ultrasonography-determined subcutaneous fat was taken as the distance between the skin and external face of the rectus abdominis muscle, and visceral fat was taken as the distance between the internal face of the same muscle and the anterior wall of the aorta.[1]
Lipid profile was done using Agappe lipid profile kit.
RESULTS
A total of 68 patients were included in the study. Among them, 13 (19.1%) were <40 years of age, 26 (38.2%) were between 40 and 50 years of age, and 29 (42.6%) were in 50-55 years age group. Around 55.9% (38) were males and 44.1% (30) were females. A total of 38 patients were obese (55.9%), and 30 were nonobese individuals (44.1%). In the gender wise obesity distribution, there were 21 obese and 17 nonobese males were studied and 17 obese and 13 nonobese females were studied. Around 47% (18) patients had Grade I obesity, 42% (16) had Grade II Obesity, 8% (3) had Grade II obesity, and 3% (1) had obesity [Graph 1].
Graph 1.
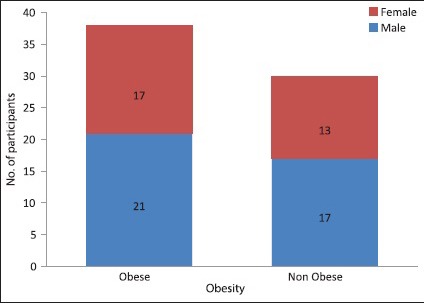
Gender distribution of obese and nonobese cases
The mean value of EFT among nonobese diabetic patients was 5.92 mm, among obesity Grade I/II/III/morbidly obese was 7.43 mm, 12.97 mm, 11.27 mm, and 13.80 mm, respectively. The median value for nonobese, obesity Grade I, II, III, and morbid patients was 4.7 mm, 7.3 mm, 8.4 mm, 11.2 mm, and 13.8 mm, respectively. The P value between different grades of obesity and EFT measurement was <0.0001, which was statistically significant.
The mean EFT among nonobese diabetics was 5.92 mm with a median of 4.7 mm and among obese group was 10.2 mm with a median of 8.3 mm. The difference is found to be statistically significant with a P < 0.0001 [Tables 1 and 2].
Table 1.
Epicardial fat thickness measurements according to the grades of obesity
| EFT (mm) | n | Mean | SD | Median |
|---|---|---|---|---|
| Nonobese | 30 | 5.92 | 6.93 | 4.7 |
| Obesity Grade I | 18 | 7.43 | 1.61 | 7.3 |
| Obesity Grade II | 16 | 12.97 | 18.64 | 8.4 |
| Obesity Grade III | 3 | 11.27 | 0.60 | 11.2 |
| Morbid obesity | 1 | 13.80 | 13.8 | |
| Total | 68 | 8.33 | 10.40 | 7.l |
P < 0.0001, Kruskal-Wallis test. SD = Standard deviation, EFT = Epicardial fat thickness
Table 2.
Epicardial fat thickness measurements in obese and nonobese
| EFT (mm) | n | Mean | SD | Median |
|---|---|---|---|---|
| Nonobese | 30 | 5.92 | 6.93 | 4.7 |
| Obese | 38 | 10.2 | 12.2 | 8.3 |
| Total | 68 | 8.33 | 10.4 |
Mann-Whitney test, P < 0.0001. EFT = Epicardial fat thickness, SD: Standard deviation
The mean value of VAT among nonobese diabetic patients was 16.58 mm, among obesity Grade I/II/III/morbidly obese was 31.34 mm, 40.32 mm, 47 mm, and 82 mm, respectively.
Correlation analysis
Overall
BMI was not significantly correlated with EFT but was significantly correlated with VAT (P = 0.0001) and Pearson correlation coefficient(r) of 0.858 (excellent). EFT was not significantly correlated with VAT, waist circumference (WC), and waist:hip ratio (W:H) [Table 3].
Table 3.
Correlation of average epicardial fat thickness with body mass index, average visceral fat thickness, waist circumference, and waist:hip ratio
| Average EFT | BMI | Average VAT | WC | W:H ratio |
|---|---|---|---|---|
| Pearson correlation | 0.225 | 0.186 | 0.236 | 0.118 |
| Significant two-tailed | 0.065 | 0.129 | 0.053 | 0.340 |
| n | 68 | 68 | 68 | 68 |
VAT = Visceral fat thickness, EFT = Epicardial fat thickness, WC = Waist circumference, W:H ratio = Waist:hip ratio, BMI = Body mass index
The correlation of abdominal VAT with WC was found to be statistically significant with a P < 0.0001 and r = 0.798 (good). The correlation of abdominal VAT with W:H ratio was found to be statistically significant with a P < 0.0001 and r = 0.505 (fair) [Table 4 and Graph 2].
Table 4.
Correlation of abdominal visceral fat thickness with body mass index, epicardial fat thickness, waist circumference, and waist:hip ratio
| Average VAT mm | BMI | Average EFT | WC | W:H ratio |
|---|---|---|---|---|
| Pearson correlation | 0.858 | 0.186 | 0.798** | 0.505** |
| Significant two-tailed | 0.0001 | 0.129 | 0.0001 | 0.0001 |
| n | 68 | 68 | 68 | 68 |
VAT = Visceral fat thickness, EFT = Epicardial fat thickness, WC = Waist circumference, W:H ratio = Waist:hip ratio, BMI = Body mass index
Graph 2.
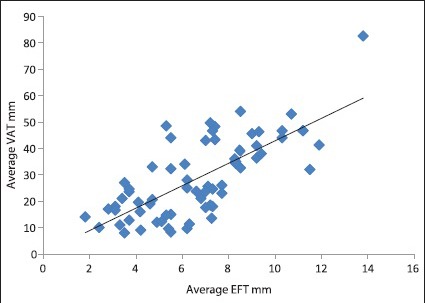
Correlation of average abdominal visceral thickness with average epicardial fat thickness
Nonobese
The correlation of EFT with abdominal VAT, WC, W:H ratio, total cholesterol, high-density lipoprotein cholesterol (HDLC), low-density lipoprotein cholesterol (LDLC), and triglycerides (TG) was found to be statistically not significant in nonobese individuals [Table 5].
Table 5.
Correlation of epicardial fat thickness
| EFT | VAT | WC | W:H | TC | HbA1c | HDL | LDL | TG |
|---|---|---|---|---|---|---|---|---|
| r | 0.054 | −0.02 | −0.285 | 0.266 | 0.266 | −0.138 | 0.087 | 0.275 |
| P | 0.776 | 0.918 | 0.127 | 0.155 | 0.155 | 0.468 | 0.648 | 0.141 |
| n | 30 | 30 | 30 | 30 | 30 | 30 | 30 | 30 |
VAT = Visceral fat thickness, EFT = Epicardial fat thickness, WC = Waist circumference, W:H = Waist:hip ratio, TC = Total cholesterol, HDL = High-density lipoprotein, LDL = Low-density lipoprotein, TG = Triglycerides
The correlation of VAT with EFT, WC, W:H ratio, total cholesterol, HDLC, LDLC, and TG was found to be statistically not significant in nonobese individuals [Table 6 and Graph 3].
Table 6.
Correlation of abdominal visceral fat thickness among nonobese individuals with other variables among nonobese individuals
| VAT | EFT | WC | W:H | TC | HbA1c | HDL | LDL | TG |
|---|---|---|---|---|---|---|---|---|
| r | 0.054 | 0.229 | 0.159 | −0.076 | −0.221 | −0.133 | 0.168 | 0.245 |
| P | 0.776 | 0.224 | 0.4 | 0.688 | 0.241 | 0.482 | 0.374 | 0.191 |
| n | 30 | 30 | 30 | 30 | 30 | 30 | 30 | 30 |
VAT = Visceral fat thickness, EFT = Epicardial fat thickness, WC = Waist circumference, W:H = Waist:hip ratio, TC = Total cholesterol, HDL = High-density lipoprotein, LDL = Low-density lipoprotein, TG = Triglycerides
Graph 3.
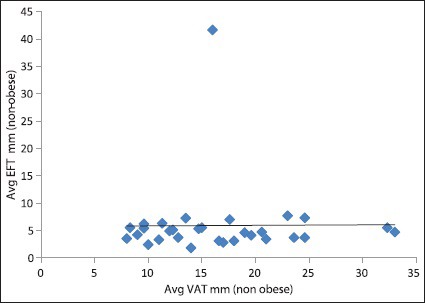
Correlation of average abdominal visceral thickness with average epicardial fat thickness among nonobese patients
Obese
The correlation of EFT with abdominal VAT was found to be statistically significant with a P = 0.009 and r = 0.416 (fair). EFT with WC was found to be correlated significantly with a P = 0 and r = 0.615 (good). EFT in obese individuals was not found to have statistically significant correlation with W:H ratio, total cholesterol, HbA1C, HDLC, LDLC, and TG [Table 7].
Table 7.
Correlation of epicardial fat thickness with other variables among obese group
| EFT | VAT | WC | W:H | TC | HbA1c | HDL | LDL | TG |
|---|---|---|---|---|---|---|---|---|
| r | 0.416 | 0.615 | 0.063 | 0.219 | −0.059 | −0.293 | 0.248 | −0.12 |
| P | 0.009 | 0 | 0.706 | 0.186 | 0.724 | 0.074 | 0.134 | 0.474 |
| n | 38 | 38 | 38 | 38 | 38 | 38 | 38 | 38 |
VAT = Visceral fat thickness, EFT = Epicardial fat thickness, WC = Waist circumference, W:H = Waist:hip ratio, TC = Total cholesterol, HDL = High-density lipoprotein, LDL = Low-density lipoprotein, TG = Triglycerides
The correlation of abdominal VAT was found to be significantly correlated with WC with a P = 0.007 and r = 0.429 (fair). However, it was not found to be significantly correlated with other parameters such as W:H ratio, total cholesterol, HbA1C, HDLC, LDLC, and TG in obese individuals [Table 8 and Graph 4].
Table 8.
Correlation of visceral fat thickness with other variables among obese group
| VAT | EFT | WC | W:H | TC | HbA1c | HDL | LDL | TG |
|---|---|---|---|---|---|---|---|---|
| r | 0.416** | 0.429** | 0.156 | 0.266 | −0.309 | −0.274 | 0.24 | 0.015 |
| P | 0.009 | 0.007 | 0.349 | 0.106 | 0.059 | 0.096 | 0.147 | 0.93 |
| n | 38 | 38 | 38 | 38 | 38 | 38 | 38 | 38 |
VAT = Visceral fat thickness, EFT = Epicardial fat thickness, WC = Waist circumference, W:H = Waist:hip ratio, TC = Total cholesterol, HDL = High-density lipoprotein, LDL = Low-density lipoprotein, TG = Triglycerides
Graph 4.
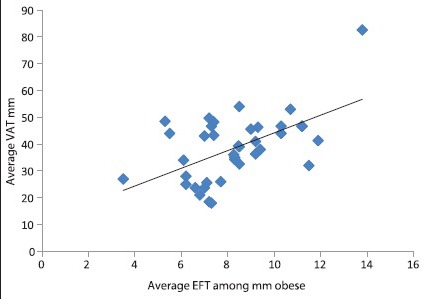
Correlation of average epicardial fat thickness and abdominal visceral thickness among obese patients
DISCUSSION
The mean age for the study group was 48.02 ± 6.79 years. A total of 38 (55.9%) patients were in obese diabetic category and 30 (44.1%) were nonobese diabetics. WHO BMI classification for South-East Asian population was used for the classification of obesity.
In this study, we had tried to find out the relationship of diabesity with a recently discovered and less studied visceral fat (EF), which is found to have a greater impact on coronary atherosclerosis than abdominal visceral adiposity. We found that EFT is significantly related to VAT in the obese diabetic group (P = 0.009, r = 0.416), whereas it is not significantly related among nonobese diabetics (P = 0.776) signifying that obesity is an independent risk factor for EF deposition among the visceral adipose tissues and may give an insight on its relation with increased CAD.
The values of EF measurements in this study are similar to most of the other major studies in this field[2,3,4] while it differed from a single study by Shetty et al.[5]
Another key finding from this study is that the BMI, which is used widely for defining and classifying obesity, that is significantly correlated with VAT, and is not significantly correlated with EFT, suggesting that EF should be used as a marker to identify at-risk patients for CAD in place of more commonly used BMI and VAT.
The incidence of CAD increases with increase in EFT and the average EFT in ischemic heart disease (IHD) patients in a study was 6.36 mm. There was no significant difference in the EFT as per the type of IHD.[3]
EFT >7 mm is associated with a higher systolic and diastolic blood pressure, higher pulse pressure, more smoking behavior, and high-sensitivity C-reactive protein than EFT <7 mm.[4] This study shows that the EFT among nonobese diabetics is <7 mm and even with Grade I obesity, the EFT increases to more than 7 mm. This signifies that even mild obesity is associated with increased risk of CAD and sudden cardiac death. Weight loss causes a reduction in EFT[6] and hence is beneficial in improving the long-term morbidity and mortality. One drawback of this study was that we have not included overweight or pre-obese people, and so their CAD risk cannot be commented by this present study.
EFT is also associated with obesity-related insulin resistance. One of the drawbacks of this study was that we could not establish the relationship of EFT with insulin resistance because we studied only diagnosed diabetes cases, and most patients were started on insulin therapy at admission and so was not possible to calculate homeostatic model assessment-insulin resistance.
The strengths of this vis-a-vis earlier studies are that probably this was the first study done only on diabetic patients. It is the first study in India, findings of which correlates with other international studies. Moreover, all the echocardiographic measurements were done by a single physician trained in echocardiography. However, this study is not without limitations. The number of population studied could have been large. Moreover, the second is magnetic resonance imaging gives a better estimate of EFT and VAT while we used ultrasound and echocardiography.
CONCLUSION
These findings of our study suggest that EFT measurement should be made routine during echocardiography of subjects at high risk for CAD as it is more significantly associated with it than other markers of obesity. It is a very simple, reliable, nonharmful, and reproducible technique. The controversy raised by this study is that EFT was not significantly correlated with VAT among nonobese groups as suggested by other major studies.[2] However, there are two differences which might possibly explain though in part regarding this. First, our study was done only on diabetes subjects, and other study had taken subjects from the normal population. Second, the criteria of BMI used for defining obesity are different. This study uses the criteria for Asian populations, and other studies used the standard WHO classification for obesity. More studies with large populations are needed to set up the normal levels of EFT among different subgroups of age, sex, and other variables such as diabetes and smoking.
Financial support and sponsorship
Nil.
Conflicts of interest
There are no conflicts of interest.
REFERENCES
- 1.Shah AA, Chakravarthy KB, Maiya AG, Vora V, Gopee M. Epicardial fat in young overweight Indians. Ann Med Health Sci Res. 2014;4:S56–S57. doi: 10.4103/2141-9248.131720. [DOI] [PMC free article] [PubMed] [Google Scholar]
- 2.Marchington JM, Mattacks CA, Pond CM. Adipose tissue in the mammalian heart and pericardium: Structure, foetal development and biochemical properties. Comp Biochem Physiol B. 1989;94:225–32. doi: 10.1016/0305-0491(89)90337-4. [DOI] [PubMed] [Google Scholar]
- 3.Jeong JW, Jeong MH, Yun KH, Oh SK, Park EM, Kim YK, et al. Echocardiographic epicardial fat thickness and coronary artery disease. Circ J. 2007;71:536–9. doi: 10.1253/circj.71.536. [DOI] [PubMed] [Google Scholar]
- 4.Natale F, Tedesco MA, Mocerino R, de Simone V, Di Marco GM, Aronne L, et al. Visceral adiposity and arterial stiffness: Echocardiographic epicardial fat thickness reflects, better than waist circumference, carotid arterial stiffness in a large population of hypertensives. Eur J Echocardiogr. 2009;10:549–55. doi: 10.1093/ejechocard/jep002. [DOI] [PubMed] [Google Scholar]
- 5.Shetty R, Vivek G, Naha K, Nayak K, Goyal A, Dias LS. Correlation of epicardial fat and anthropometric measurements in Asian-Indians: A community based study. Avicenna J Med. 2012;2:89–93. doi: 10.4103/2231-0770.110739. [DOI] [PMC free article] [PubMed] [Google Scholar]
- 6.Iacobel G, Singh N, Wharton S, Sharma AM. Substantial changes in epicardial fat thickness after weight loss in severely obese subjects. Obesity. 2008;251:1–5. doi: 10.1038/oby.2008.251. [DOI] [PubMed] [Google Scholar]