Figure 3.

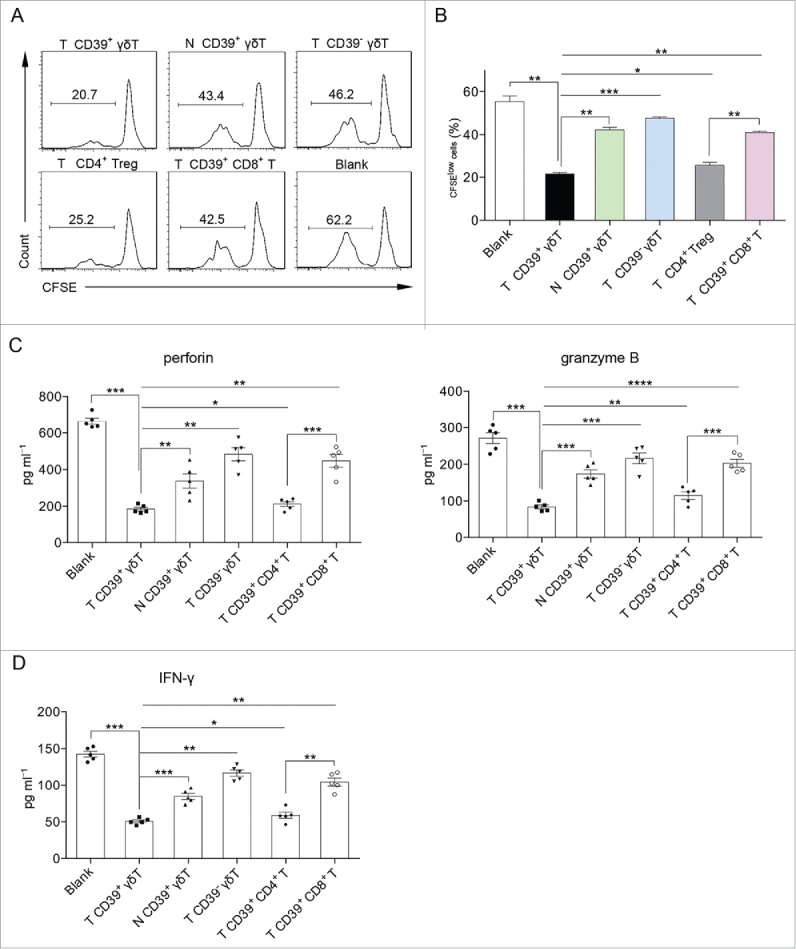
CD39+ γδT cells are the predominant immunosuppressive T cells in CRC. (A, B) Sorted CD39+ γδT, CD39− γδT, CD4+ Treg, CD39+ CD8+ T cells from tumor tissue and CD39+ γδT cells from paired normal tissue were in vitro co-cultured with CFSE-labeled allogeneic CD3+ T cells in the presence of CD3 and CD28 mAbs, respectively. CD3+ T cell proliferation was evaluated on day 6 by FCM (A). Bar diagram summarizes the percentages of proliferated cells (CFSElow) in CD3+ T cells (B). N: normal tissue; T: tumor tissue. Data are shown as mean ± SEM; n = 5; *p < 0.05; **p < 0.01; ***p < 0.001. (C) Sorted CD39+ γδT, CD39− γδT, CD39+ CD4+ T, CD39+ CD8+ T cells from tumor tissue and CD39+ γδT cells from paired normal tissue were in vitro co-cultured with allogeneic CD8+ T cells in the presence of CD3 and CD28 mAbs. Concentrations of perforin (left panel) and granzyme B (right panel) in the supernatants were detected on day 6 by ELISA. N: normal tissue; T: tumor tissue. Data are shown as mean ± SEM; n = 5; *p < 0.05; **p < 0.01; ***p < 0.001; ****p < 0.0001. (D) Sorted CD39+ γδT, CD39− γδT, CD39+ CD4+ T, CD39+ CD8+ T cells from tumor tissue and CD39+ γδT cells from paired normal tissue were in vitro co-cultured with allogeneic CD4+ T cells in the presence of CD3 and CD28 mAbs. IFNγ levels in the supernatants were detected on day 6 by ELISA. N: normal tissue; T: tumor tissue. Data are shown as mean ± SEM; n = 5; *p < 0.05; **p < 0.01; ***p < 0.001.
