

Abstract
Background
Many diagnostic tests for insulin dysregulation use reference intervals established with an insulin radioimmunoassay (RIA) that is no longer available. A chemiluminescent immunoassay (CLIA) is commonly used for the measurement of serum insulin concentration in clinical practice but requires further validation, especially at clinically relevant reference intervals.
Objectives
To evaluate the CLIA for measurement of equine insulin and compare it to the previously validated, but now unavailable RIA.
Samples
Equine serum samples (n = 78) from clinical and experimental studies.
Methods
In this experimental study, performance of the CLIA was evaluated using standard variables, including comparison with the RIA. Continuous and binary outcomes were analyzed.
Results
The CLIA showed good intra‐assay (coefficient of variation [CV], 1.8–2.4%) and interassay (CV, 3–7.1%) precision. Acceptable recovery on dilution (100 ± 10%) was achieved only at dilutions <1:1. Recovery on addition was acceptable. Comparison of the CLIA and RIA showed strong positive correlation (r = 0.91–0.98), with fixed and proportional bias. At 3 diagnostic cutoffs, sensitivity of CLIA compared with RIA ranged from 67 to 100% and specificity from 96 to 100%.
Conclusions and Clinical Importance
The CLIA is a highly repeatable assay which is suitable for within‐ and between‐horse comparisons. Dilution of high concentration samples should be performed with charcoal‐stripped serum (CSS) and at the lowest dilution factor possible. At concentrations commonly used for diagnosis of insulin dysregulation (≤100 μIU/mL), results from the CLIA tend to be lower than from the RIA and should be interpreted accordingly. Further standardization of equine insulin assays is required.
Keywords: ELISA, Horse, Laminitis, Metabolic
Abbreviations
- CGIT
combined glucose‐insulin tolerance test
- CLIA
chemiluminescent immunoassay
- CSS
charcoal‐stripped serum
- CV
coefficient of variation
- LC‐MS
liquid chromatography‐mass spectrometry
- LOA
limits of agreement
- RIA
radioimmunoassay
Measurement of serum insulin concentration, both basal and after PO or IV glucose challenge, frequently is performed in equine clinical practice to determine the risk or cause of laminitis. Increased basal or dynamic insulin concentration is suggestive of insulin dysregulation, which has been shown to be central to the pathophysiology of endocrinopathic laminitis.1, 2, 3, 4, 5 Several insulin immunoassays are available commercially, most of which use antibodies against human or porcine insulin and none of which use antibodies specifically generated against equine insulin.6 Many of the reference ranges commonly used in clinical practice and experimental studies to diagnose insulin dysregulation (e.g, basal insulin >32 μIU/mL2 or insulin >100 μIU/mL 45 minutes post‐CGIT7) are based on studies using a specific radioimmunoassay (RIA)1 that has been validated for use in horses,8 but is no longer commercially available. A chemiluminescent immunoassay (CLIA)2 is commonly used in commercial laboratories for measurement of insulin concentration in clinical samples. One study compared the RIA and the CLIA and found poor agreement between the 2 assays, but when 5 discordant samples from a total of 40 were removed from the data set, bias and total error were within acceptable limits.9 Considering the common use of the CLIA in clinical practice and experimental studies, further evaluation of the assay is required. The purpose of our study was to evaluate the CLIA for measurement of equine serum insulin concentration and compare it to the previously validated but now unavailable RIA. We hypothesized that, at clinically relevant ranges, differences in serum insulin concentrations between the 2 assays would be clinically unimportant.
Materials and Methods
Serum Samples
Excess equine serum from 3 sources was placed in aliquots and stored at −80°C: (1) horses that were presented to the metabolic management clinic at the Philip Leverhulme Equine Hospital between October 2012 and March 2014 for suspected endocrinopathic laminitis and that underwent a combined glucose‐insulin tolerance test (CGIT)10; (2) healthy ponies maintained on a euglycemic hyperinsulinemic clamp during an experimental study performed in 20061; and (3) ponies enrolled in a cross‐over study examining insulinemic responses to different feeds performed in 2014. Studies 1, 2, and 3 were approved by the University of Liverpool Committee on Research Ethics, the Animal Ethics Committee of the University of Queensland, and a project license under the Animals (scientific procedures) Act 1986, respectively.
Precision: Intra‐ and Interassay Coefficients of Variation (CV)
Intra‐assay CV was calculated with 10 replicates of low (mean, 12.6 μIU/mL), medium (mean, 29.5 μIU/mL), and high (mean, 70.8 μIU/mL) insulin concentration samples from study 3 by the same CLIA cartridge.
Five control samples from study 3 representing a range of mean insulin concentrations (12.7 μIU/mL, 22.1 μIU/mL, 71.8 μIU/mL, 194.8 μIU/mL, and 274.8 μIU/mL) were frozen in aliquots at −80°C and used to determine interassay CV of the CLIA. Replicates were analyzed on 6 different batches of reagents.
Dilutional Parallelism and Effect of Diluent
Four equine serum samples with initial, undiluted insulin concentrations of 83.2 μIU/mL, 150 μIU/mL, 217 μIU/mL, and 281 μIU/mL from study 3 were diluted in ratios of sample:diluent of 2:1, 1:1, 1:2, 1:4, and 1:6, giving dilution factors of 0.33, 0.5, 0.67, 0.8, and 0.86, respectively. Samples were diluted with equine charcoal‐stripped serum (CSS), the manufacturer‐recommended, commercially available assay diluent for the CLIA3 (standard diluent), and 0.9% NaCl4 solution to compare the effect of different diluents. Charcoal‐stripped serum was prepared in advance based on a method previously described11 and the manufacturer's datasheet.5 Dextran‐coated charcoal5 (0.02 g/mL) was added to equine serum, which was left on a laboratory rocker for 12 hours at 4°C. The product then was centrifuged at 2000 g for 15 minutes, decanted, divided into aliquots, and stored at −20°C until use. After thawing, the serum was filtered through a 5‐μm inline filter and analyzed to ensure that insulin concentration was zero. Linear regression was performed to determine the intercept and slope for the lines for each diluent. Mean percentage recovery was calculated for each of the 3 diluents at each of the different dilution factors.
Recovery on Addition
Because equine insulin standard solutions are not commercially available, a human insulin standard solution2 was used with a mean measured concentration of 46.2 μIU/mL (range, 43–57 μIU/mL). Two different equine serum samples with low (3.2 μIU/mL) and medium (20.6 μIU/mL) measured insulin concentrations, and CSS (insulin concentration = 0 μIU/mL) were spiked with different volumes of the insulin standard. Recovery was calculated as a ratio of the measured increase in concentration to the predicted increase in concentration, and the mean value calculated.
Comparison between CLIA and RIA
Serum samples (n = 78) representing a wide range of insulin concentrations from sources 1 (n = 53) and 2 (n = 25) were thawed and assayed simultaneously by the CLIA and in duplicate by the RIA, according to the manufacturer's instructions. All assays were performed at the Institute of Veterinary Science's clinical pathology laboratory and by the same experienced laboratory technician. The maximum reportable concentrations for the RIA and CLIA were 350 μIU/mL and 300 μIU/mL, respectively; thus, any samples with insulin concentration >300 μIU/mL on either assay (23/78 samples) were diluted 1:10 with CSS and repeated on both assays.
Samples below the lower detectable limit for each assay (2 μIU/mL for CLIA and 5 μIU/mL for RIA) were designated as having an insulin concentration of 0 μIU/mL, because this was considered to be a clinically unimportant difference. Based on how it was obtained, each sample was designated as either a basal insulin, 45 minutes post‐CGIT or hyperinsulinemic clamp sample. Binary outcomes were created by cutoff values (20 μIU/mL and 32 μIU/mL for basal samples and 100 μIU/mL for 45 minutes post‐CGIT) commonly used in clinical practice to diagnose insulin dysregulation. Hyperinsulinemic clamp samples were excluded from the binary outcomes data.
Statistical Analysis
Coefficient of variation (%) was calculated as the ratio of the standard deviation to the mean multiplied by 100. An intra‐ or interassay CV ≤10% was considered acceptable. Dilutional parallelism was assessed by linear regression to determine the slope and intercept of the line in comparison with 1 and 0, respectively. The percentage recovery on dilution and on addition were determined by calculating (measured concentration/expected concentration) × 100. Recovery of 100 ± 10% was considered acceptable.
Comparison between the CLIA and RIA was made by Deming's regression method12 and the strength of the linear relationship by Spearman's rank correlation coefficient. Agreement between the 2 methods was performed by Bland‐Altman analysis.13 These analyses were performed for all samples, and then also for samples with CLIA insulin concentrations <300 μIU/mL and <100 μIU/mL to provide more specific data for the most clinically relevant concentration ranges. Agreement between binary outcomes for RIA and CLIA was assessed by Cohen's kappa with κ value interpretation as <0.2 poor, 0.21–0.4 fair, 0.41–0.6 moderate, 0.61–0.8 good, and 0.81–1 very good strength of agreement. Sensitivity and specificity of CLIA against RIA as the gold standard for each cutoff value were determined by 2‐by‐2 tables. Statistical analysis was performed by SPSS version 226 and Medcalc version 16.4.3.7
Results
Precision: Intra‐ and Interassay Coefficients of Variation
Precision of the CLIA assay was excellent, with intra‐assay CVs of 1.8, 2.4, and 1.9% for low, medium, and high insulin concentrations, respectively. Similarly, interassay CVs were all within acceptable limits, with 6.1, 5.4, 3.0, 7.1, and 5.9% for samples with mean insulin concentrations of 12.7 μIU/mL, 22.1 μIU/mL, 71.8 μIU/mL, 194.8 μIU/mL, and 274.8 μIU/mL, respectively.
Dilutional Parallelism
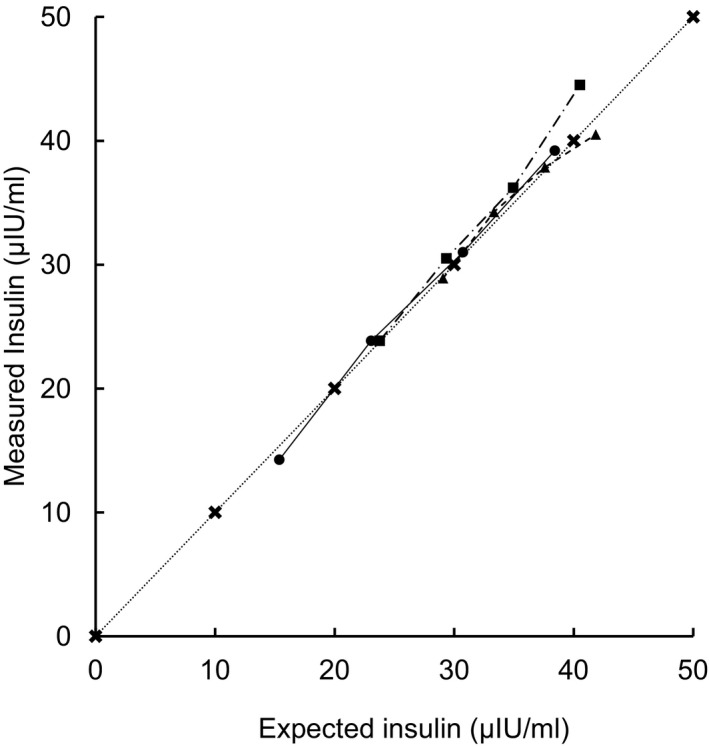
Dilutional parallelism with 3 different diluents of an equine serum sample with an initial insulin concentration of 217 μIU/mL is shown in Figure 1. Linear regression at this concentration indicated the best fit line as y = 1.17x − 27.1 (r 2 = 0.99, P < .001) for CSS, y = 0.96x − 26.7 (r 2 = 0.94, P = .007) for standard diluent, and y = 1.18x − 39.1 (r 2 = 0.99, P = .001) for 0.9% NaCl.
Figure 1.

Plot of measured against expected values for serum insulin after serial dilution of a high endogenous insulin concentration (217 μIU/mL) using charcoal‐stripped serum (circles) standard diluent (squares) and 0.9% saline solution (triangles). Crosses indicate measured = expected.
Mean percentage recovery from the 4 initial insulin concentrations was calculated for each of the diluents at different dilution factors and is shown in Figure 2. For all diluents, percentage recovery decreased as the dilution factor increased, and dilutional parallelism was not observed. Overall, mean percentage recovery was greater for CSS compared with standard diluent (P < .0005) and 0.9% NaCl (P < .0005). No significant difference in mean percentage recovery was detected between CSS and 0.9% NaCl at dilution factors 0.33 (P = .49) and 0.5 (P = .29). When using CSS as a diluent, the mean recovery at a dilution factor of 0.33 (2:1 sample:CSS) was 90.9%, and at dilution factors ≥0.5 (1:1 sample:CSS), mean recoveries were ≤80.6%.
Figure 2.

Mean ± standard deviation percentage recovery from 4 initial insulin concentrations plotted against dilution factor. Diluents were charcoal‐stripped serum (CSS) (circles) standard diluent (squares) and 0.9% saline solution (triangles). * = significant difference (P < .05) in mean recovery between CSS and 0.9% saline solution. There was a significant difference in mean recovery between CSS and standard diluent at all dilution factors.
Recovery on Addition
Recovery of the insulin standard is shown in Figure 3. The mean (95% confidence interval [CI]) percentage recoveries from the 3 different initial concentrations (0 μIU/mL, 3.2 μIU/mL, and 20.6 μIU/mL) were all within the acceptable range, at 99.8% (CI, 92.1–107.5), 106.9% (CI, 98.0–115.8), and 100.1% (CI, 91.0–109), respectively.
Figure 3.
Recovery on addition of an insulin standard to 3 different low insulin concentration equine serum samples (Initial insulin concentration: circles = 0 μIU/mL, squares = low, triangles = medium). Measured concentration plotted against expected concentration. Dotted line = reference of measured = expected.
Comparison between CLIA and RIA
Scatter plots of all CLIA concentrations, CLIA concentrations <300 μIU/mL, and CLIA concentrations <100 μIU/mL against RIA concentrations with a line of best fit derived by Deming regression analysis and a reference y = x line are shown in Figure 4A, B, and C, respectively. There was strong positive correlation (r = 0.91–0.98, P < .0005) in all 3 comparisons. For all CLIA concentrations (Fig 4A), the gradient (95% CI) of the best fit line was 1.24 (CI, 1.14–1.34), and the intercept (95% CI) was −7.98 (CI, −16.6 to 0.59). For CLIA concentrations <300 μIU/mL (Fig 4B), the gradient (95% CI) of the best fit line was 1.27 (CI, 1.04–1.49), and the intercept (95% CI) was −12.26 (CI, −19.35 to −5.16). For CLIA concentrations <100 μIU/mL (Fig 4C), the gradient (95% CI) of the best fit line was 0.84 (CI, 0.77–0.92), and the intercept (95% CI) was −2.4 (CI, −4.87 to 0.07).
Figure 4.

Scatter plots of chemiluminescent immunoassay (CLIA) against radioimmunoassay (RIA) insulin concentrations, for (A) all samples (n = 78), (B) samples with CLIA<300 μIU/mL (n = 57), and (C) samples with CLIA <100 μIU/mL (n = 47). All samples with an initial CLIA >300 μIU/mL were diluted 1:10 with charcoal‐stripped serum for both assays. The solid line represents the line of best fit derived from Deming regression analysis and the dotted line is a y = x reference.
A Bland‐Altman plot (Fig 5A) of all samples showed a fixed bias with CLIA concentrations a mean of 50.4 μIU/mL higher than RIA concentrations, and with 95% limits of agreement (LOA) of −261 to 160 μIU/mL. When only samples with CLIA <300 μIU/mL were included (Fig 5B), the fixed bias (0.5 μIU/mL) was not significant, and 95% LOA were −38.7 to 39.6 μIU/mL. For samples <100 μIU/mL (Fig 5C), a fixed bias was present with RIA concentrations a mean of 6.2 μIU/mL higher than CLIA concentrations, with 95% LOA of −9.5 to 21.8 μIU/mL.
Figure 5.
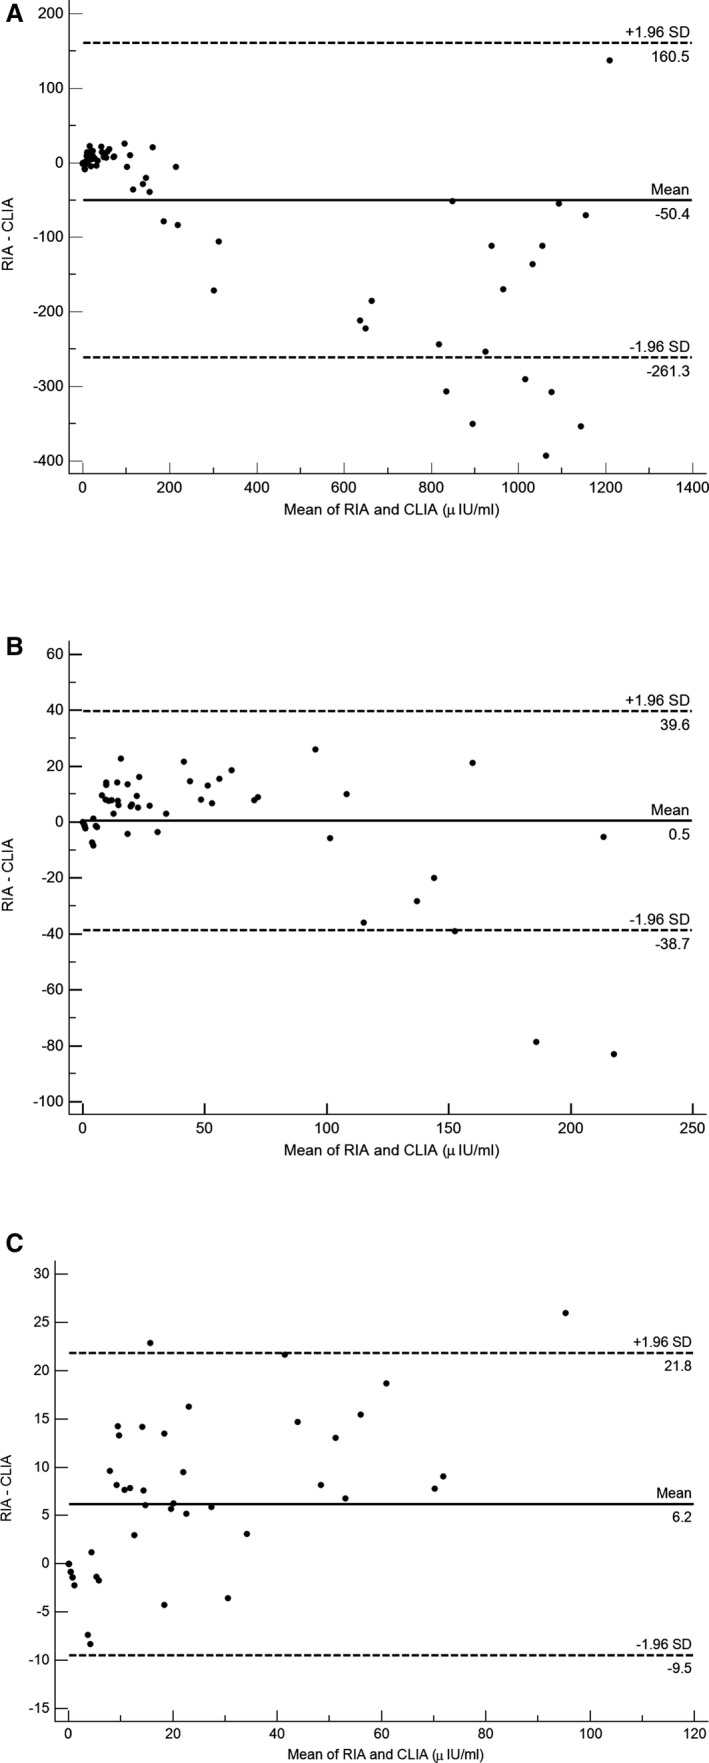
Bland‐Altman plots of chemiluminescent immunoassay (CLIA) and radioimmunoassay (RIA) insulin results for (A) all samples (n = 78), (B) samples with CLIA <300 μIU/mL (n = 57), and (C) samples with CLIA <100 μIU/mL (n = 47). Mean bias (solid line) and 95% limits of agreement (dotted line) are indicated and labeled.
The kappa statistic of agreement between the RIA and CLIA for binary outcomes at diagnostic cutoff values for insulin of >20 μIU/mL was 0.66 (95% CI, 0.43–0.88; P < .0005); for >32 μIU/mL, it was 0.94 (95% CI, 0.82–1; P < .0005); and for >100 μIU/mL, it was 1.0 (95% CI, 1.0–1.0; P < .0005).
Sensitivity, specificity, and negative and positive predictive values of CLIA against RIA as the gold standard for the 3 diagnostic cutoffs are shown in Table 1.
Table 1.
Sensitivity, specificity, and positive and negative predictive values for CLIA insulin concentrations against RIA concentrations, at 3 commonly used diagnostic cutoffs
| Diagnostic cutoff | Number of Samples | Sensitivity (%) | Specificity (%) | Positive Predictive Value (%) | Negative Predictive value (%) |
|---|---|---|---|---|---|
|
Basal Insulin >20 μIU/mL |
34 | 67 | 96 | 92 | 81 |
|
Basal Insulin >32 μIU/mL |
34 | 100 | 97 | 91 | 100 |
|
CGIT 45 minutes Insulin >100 μIU/mL |
15 | 100 | 100 | 100 | 100 |
CGIT, combined glucose‐insulin tolerance test.
Discussion
Performance measures of the CLIA in our study indicate that it has high precision, both within and between runs and at a wide range of clinically relevant insulin concentrations. Accuracy of the assay is variable however with very good recovery on addition but acceptable recovery on dilution only when CSS or 0.9% saline is used and at low dilution factors. When compared to the previously validated RIA, serum insulin concentrations measured with the CLIA were strongly and positively correlated. Significant constant and proportional biases were detected, which varied according to insulin concentration. When binary outcomes at commonly used diagnostic cutoffs were compared, there were reasonable to good levels of agreement, sensitivity, specificity, and predictive values.
The high intra‐ and interassay precision of the CLIA at clinically relevant insulin concentrations found in our study means that any differences detected over time or between samples are likely to be real rather than due to assay variability. A clinical example would be serial monitoring of basal insulin concentration before and after a period of dietary restriction. The CLIA compares favorably to the reported precision of other immunoassays for measurement of equine insulin, with the RIA, for example, having reported intra‐assay CVs ranging from 4.4 to 10.7%8, 14, 15, 16 and other ELISAs having CVs as high as 19.9%.14 The automated processes used for the CLIA mean that some of the imprecision that can be caused by operator error during manual assays8 is avoided. All CLIA results in our study were obtained using a single analyzer.2 Other platforms in the same range of analyzers exist, and although they use the same antibodies, reagents, and standards, variability is possible among platforms and among individual analyzers using the same platform. Ideally, normal reference intervals should be established for each individual analyzer.
A diluent3 consisting of concentrated insulin‐free nonhuman serum matrix with preservative is supplied by the manufacturers of the CLIA intended for automated onboard (dilution factors specified by the operator) or manual dilution before loading of samples that exceed the reportable range of the assay (>300 μIU/mL). Although the CLIA still gives results for insulin concentrations above this limit, it is recommended in the manufacturer's instructions that sample dilution be performed. To our knowledge, no comparisons of diluents for the CLIA have been published. Our study showed that mean recovery at most dilution factors and initial concentrations was higher after dilution with CSS compared with the standard diluent or 0.9% NaCl. The exception was at dilution factors 0.33 and 0.5, where no significant difference in percentage recovery between CSS and 0.9% NaCl was detected. Two previous studies using the RIA showed similar results, where recovery of insulin was higher after dilution with CSS compared to phosphate‐buffered saline, distilled water, and the zero standard supplied.8, 14 With all diluents in our study, percentage recovery of insulin decreased with increasing dilution, presumably due to interference with antibody binding or an alteration in the effective insulin concentration caused by substances in the diluent. Dilution factors >0.33 decreased the percentage recovery to below 90%, so at high insulin concentrations the increased dilution required to bring the insulin concentration to within the reportable range might falsely decrease the final result. Hence, it is recommended that the lowest possible sample dilution be used to minimize this effect. At lower dilution factors, 0.9% NaCl offers advantages over CSS, such as ease of preparation and consistency among batches and laboratories, for no demonstrated difference in recovery. Given the recovery data above, a weakness in the design of our study was that all samples with an initial insulin concentration >300 μIU/mL were diluted 1:10 before being measured with CLIA and RIA. This is likely to have underestimated the insulin concentration in these samples more than if a lower dilution had been used.
The amino acid sequence of mammalian insulin is well conserved, with the equine insulin molecule differing by only 2 amino acids from humans and 1 amino acid from porcine insulin.17 These differences result in alterations in secondary, tertiary, and quaternary structure and antibody binding site conformation, leading to variable specificity of insulin immunoassays for different mammalian insulins. Although there is an ELISA that has been optimized for use in horses8 , no immunoassay currently available uses antibodies that have been raised specifically against equine insulin or equine insulin standards. An equine insulin standard9 solution used in an earlier validation study9 has been discontinued, meaning that human insulin standards had to be used for recovery on addition in our study. Recovery on addition was within acceptable limits, which contrasts with the poor recovery obtained with the equine insulin standard on the CLIA and RIA in the aforementioned study.9 This difference is most likely caused by the different types of insulin used, but the concentration of the standards was not confirmed with liquid chromatography‐mass spectrometry (LC‐MS) in either study and could have influenced results.
The lack of equine‐specific standards or access to a reference assay makes assessing the accuracy of any equine insulin assay difficult. For the CLIA in our study, accuracy was determined by comparison with the RIA, because it has been used widely in experimental studies and showed the best performance in a study of 5 insulin assays for horses.8 The gold standard technique for insulin quantification is LC‐MS,18 but it was not used in our study due to lack of availability. To our knowledge, insulin LC‐MS has been used to measure equine serum insulin concentration in only 1 study.8 In that study, insulin concentration determined by LC‐MS had only moderate correlation with the RIA assay, with consistent underestimation of insulin concentration by the RIA. Standardization of human insulin immunoassays with isotope dilution‐liquid chromatography‐tandem mass spectrometry resulted in successful reductions in total error18; a similar process could be applied to improve the accuracy of equine insulin assays.
There was a strong correlation between the RIA and CLIA in our study. There were small but statistically significant constant and proportional biases, however, which varied according to concentration. Results from the CLIA tended to be higher than those of the RIA for high concentrations of insulin, whereas the opposite was the case for lower concentrations (<100 μIU/mL). The gradients and intercepts seen from Deming regression analysis line of best fit reflect this finding, and although most were significantly different from 1 and 0, respectively, these differences were relatively small.
A limitation of our study was that most of the high insulin concentration (>300 μIU/mL) samples were from study 2 and most of the low samples were from study 1. The horses, diagnostic test performed, and sample storage time were different between the 2 groups of samples, and this difference might have influenced the relative performance of the CLIA and RIA. The euglycemic hyperinsulinemic clamp samples from study 2 (all of which had insulin concentrations >530 μIU/mL on RIA and >742 μIU/mL on CLIA) will have contained largely recombinant human insulin, whereas the post‐CGIT samples from study 1 are likely to have contained a mixture of human and endogenous insulin. As described above, antibody binding affinity can vary among heterologous insulin molecules and an assay comparison using samples with only endogenous insulin, for example, after PO sugar test, might yield different results. In addition, in our study any samples with an initial CLIA insulin concentration >300 μIU/mL were diluted with CSS before CLIA and RIA analysis, and this dilution might have affected final results differently for the RIA and CLIA.
Binary outcomes from the 2 assays at 3 different cutoffs demonstrated generally good performance of the CLIA compared with the RIA. The tendency for the CLIA to give lower results than the RIA at low concentrations is reflected in the lower sensitivity and negative predictive values seen for the 20 μIU/mL cutoff, but not the 32 μIU/mL cutoff, which had excellent sensitivity and specificity. Deming regression analysis of insulin concentrations <100 μIU/mL resulted in a best fit line gradient (95% CI) of 0.84 (CI, 0.77–0.92), meaning that when using RIA derived cutoffs, a CLIA result should be interpreted as having good specificity but lower sensitivity.
To summarize, the CLIA had good precision, recovery on addition and with CSS as the diluent and low dilution factors, adequate recovery on dilution. On this basis, the performance of the CLIA should be considered adequate for comparative measurements of equine insulin, for example, monitoring response to dietary intervention, or comparing groups of horses in experimental studies. The accuracy of the CLIA is difficult to assess with no specific reference standards or assays for equine insulin, and further research to establish standardization and validation of assays is warranted. In comparison with the RIA, the CLIA had fixed and proportional bias. At the range of insulin concentrations most commonly used for diagnostic purposes (0–100 μIU/mL), there was reasonable agreement between the assays. Small proportional and fixed biases were detected which resulted in CLIA underestimating the insulin concentration compared with RIA. When using diagnostic cutoffs for insulin dysregulation that have been determined by the RIA, CLIA results should be interpreted accordingly.
Acknowledgments
The authors gratefully acknowledge the technical assistance of Jean Routley.
Conflict of Interest Declaration: Authors declare no conflict of interest.
Off‐label Antimicrobial Declaration: Authors declare no off‐label use of antimicrobials.
The work was performed at the University of Liverpool, Neston, Wirral, CH64 7TE, UK.
Grant support: The work was self‐funded.
The paper has not been presented at any scientific meetings.
Footnotes
Coat‐a‐Count Insulin, Siemens Healthcare, Camberley, Surrey, UK
Immulite 2000 Insulin, Siemens Healthcare, Camberley, Surrey, UK
Insulin sample diluent, Immulite 2000 systems, Siemens, Gwynedd, UK
Aquapharm 1, Animalcare, York, UK
Sigma‐Aldrich Ltd., Dorset, UK
IBM, New York
MedCalc bvba, Ostend, Belgium
Equine Insulin ELISA, Mercodia AB, Uppsala, Sweden
Shibayagi Co., Ishihara, Japan
References
- 1. Asplin KE, Sillence MN, Pollitt CC, et al. Induction of laminitis by prolonged hyperinsulinaemia in clinically normal ponies. Vet J 2007;174:530–535. [DOI] [PubMed] [Google Scholar]
- 2. Carter RA, Treiber KH, Geor RJ, et al. Prediction of incipient pasture‐associated laminitis from hyperinsulinaemia, hyperleptinaemia and generalised and localised obesity in a cohort of ponies. Equine Vet J 2009;41:171–178. [DOI] [PubMed] [Google Scholar]
- 3. Jeffcott LB, Field JR, McLean JG, et al. Glucose tolerance and insulin sensitivity in ponies and Standardbred horses. Equine Vet J 1986;18:97–101. [DOI] [PubMed] [Google Scholar]
- 4. Karikoski NP, McGowan CM, Singer ER, et al. Pathology of natural cases of equine endocrinopathic laminitis associated with hyperinsulinemia. Vet Path 2015;52:945–956. [DOI] [PubMed] [Google Scholar]
- 5. Treiber KH, Kronfeld DS, Hess TM, et al. Evaluation of genetic and metabolic predispositions and nutritional risk factors for pasture‐associated laminitis in ponies. J Am Vet Med Assoc 2006;228:1538–1545. [DOI] [PubMed] [Google Scholar]
- 6. Mercodia . Mercodia Equine insulin ELISA. Directions for Use Version 4.0. Available at: https://www.mercodia.se/assets/upload/files/DfU/Equine/Insulin%20Equine%20version%204_0.pdf 2016. Accessed July 23, 2016.
- 7. Eiler H, Frank N, Andrews FM, et al. Physiologic assessment of blood glucose homeostasis via combined intravenous glucose and insulin testing in horses. Am J Vet Res 2005;66:1598–1604. [DOI] [PubMed] [Google Scholar]
- 8. Tinworth KD, Wynn PC, Boston RC, et al. Evaluation of commercially available assays for the measurement of equine insulin. Dom Animal Endocrinol 2011;41:81–90. [DOI] [PubMed] [Google Scholar]
- 9. Banse HE, McCann J, Yang F, et al. Comparison of two methods for measurement of equine insulin. J Vet Diagn Invest 2014;26:527–530. [DOI] [PubMed] [Google Scholar]
- 10. Morgan RA, Keen JA, McGowan CM. Treatment of equine metabolic syndrome: A clinical case series. Equine Vet J 2015;48:422–426. [DOI] [PubMed] [Google Scholar]
- 11. Herbert V, Lau K‐S, Gottlieb C, et al. Coated charcoal immunoassay of insulin. J Clin Endocrin Met 1965;25:1375–1384. [DOI] [PubMed] [Google Scholar]
- 12. Deming WE. Statistical Adjustment of Data. New York: John Wiley and Sons; 1943. [Google Scholar]
- 13. Bland JM, Altman DG. Statistical methods for assessing agreement between two methods of clinical measurement. Lancet 1986;1:307–310. [PubMed] [Google Scholar]
- 14. Borer‐Weir KE, Bailey SR, Menzies‐Gow NJ, et al. Evaluation of a commercially available radioimmunoassay and species‐specific ELISAs for measurement of high concentrations of insulin in equine serum. Am J Vet Res 2012;73:1596–1602. [DOI] [PubMed] [Google Scholar]
- 15. Öberg J, Bröjer J, Wattle O, et al. Evaluation of an equine‐optimized enzyme‐linked immunosorbent assay for serum insulin measurement and stability study of equine serum insulin. Comp Clin Path 2011;21:1291–1300. [Google Scholar]
- 16. Tinworth KD, Wynn PC, Harris PA, et al. Optimising the Siemens Coat‐A‐Count radioimmunoassay to measure insulin in equine plasma. J Equine Vet Sci 2009;29:411–413. [Google Scholar]
- 17. Ho EN, Wan TS, Wong AS, et al. Doping control analysis of insulin and its analogues in equine plasma by liquid chromatography‐tandem mass spectrometry. J Chromatogr A 2008;1201:183–190. [DOI] [PubMed] [Google Scholar]
- 18. Rodriguez‐Cabaleiro D, Van Uytfanghe K, Stove V, et al. Pilot study for the standardization of insulin immunoassays with isotope dilution liquid chromatography/tandem mass spectrometry. Clin Chem 2007;53:1462–1469. [DOI] [PubMed] [Google Scholar]