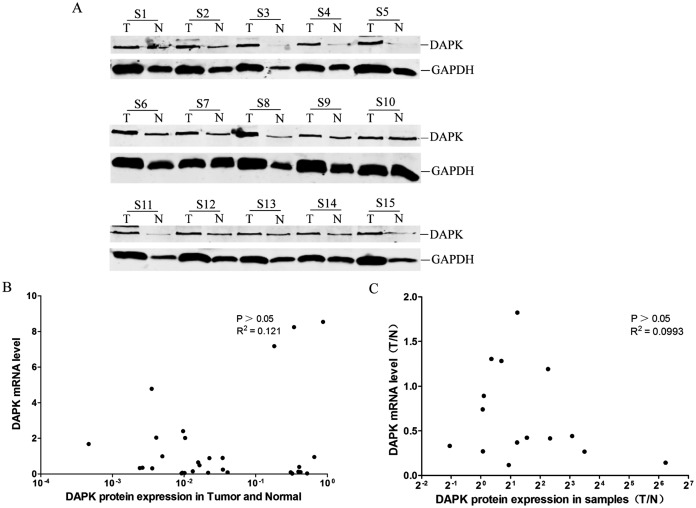
Figure 3. Analysis of the correlation between DAPK mRNA and protein expression in breast cancer samples.
(A) The protein expression of DAPK was detected using western blot. T, the breast cancer tissue; N, the corresponding adjacent normal tissue; S1–S15, patient codes. (B) Correlation analysis of DAPK mRNA expression and DAPK protein expression in breast cancer samples. The cDNA from HEK293T cells were used as a positive control and formation of the standard curve. (C) Correlation analysis of the T/N ratio of DAPK mRNA expression and DAPK protein expression in breast cancer samples.

