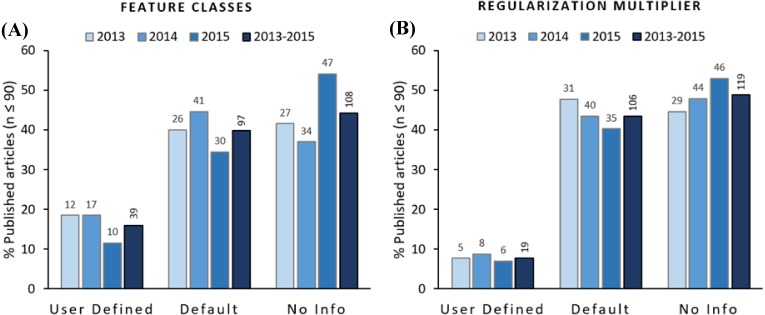
Figure 3. Feature classes (A) and regularization multipliers (B) reported to be used for modelling in the analyzed articles.
Columns show the percentage of articles using user-defined, software default, and articles not providing information. Numbers on top of columns represent the number of articles pertaining to each category per year. Columns on the right of each category show the percentage and number of articles for the 2013–2015 period.

