Abstract
Aim: To evaluate the short-term effects of calcitriol and sevelamer hydrochloride on fibroblast growth factor-23 (FGF23) in humans and to determine whether the effect is direct or indirect through calcitriol-induced increased absorption of phosphorus from the intestine. Patients and Methods: A total of 15 healthy individuals were tested at three time points and stages, for 24 h and at 1-week intervals. During each stage, blood samples were taken at three time points (0, 8 and 24 h); baseline stage: under no intervention; second stage, while receiving 0.5 μg calcitriol orally twice daily; and at the third stage, while receiving 0.5 μg calcitriol orally twice daily and sevelamer hydrochloride during meals. The changes in FGF23, parathyroid hormone, calcitriol, Ca, and phosphorus were determined. Results: During calcitriol administration, the FGF23 level changed significantly (p=0.008), with the level at 24 h levels being significantly higher than at 8 h (8.8 pg/ml vs. 13.0 pg/ml, p=0.036). There was a statistically significant difference in the percentage change, among the three stages, at time 8 to 24 h and 0 to 24 h for FGF23 (p=0.014 and p=0.015, respectively), with significant differences between baseline vs. calcitriol for 8 to 24 h FGF23 change (−9.23% vs. 26.98%, p=0.003) and a trend between baseline vs. calcitriol (p=0.061) and calcitriol plus sevelamer (p=0.069) for 0 to 24 h FGF23 change. Conclusion: Administration of calcitriol to healthy individuals increases the circulating level of FGF23 within 24 h. Combined calcitriol and sevelamer administration restrains the increase of FGF23, suggesting that calcitriol-induced increased absorption of phosphate from the intestine might also be involved in the increase of FGF23.
Keywords: Calcitriol, phosphorus, FGF23, sevelamer hydrochloride, healthy adults
Fibroblast growth factor-23 (FGF23) is a circulating factor that plays an important role in the regulation of phosphate and vitamin D (1-3). FGF23 is produced by mature osteoblasts and osteocytes (2) and acts through FGF receptor–Klotho complexes in cell membranes. The kidney is the major target for FGF23; in the proximal renal tubule, FGF23 acts to promote phosphaturia by down-regulating the expression of luminal sodium-dependent phosphate transporters and to reduce synthesis of 1,25-dihydroxyvitamin D by down-regulating 1a-hydroxylase and up-regulating 24-hydroxylase activity (4-6).
Although the control of FGF23 production remains poorly understood, a complex interplay between systemic and local factors allows the coordination of bone buffering capacity with renal phosphate handling. The primary systemic factors that stimulate FGF23 secretion appear to be calcitriol and increased dietary phosphorus intake. Moreover the FGF23 level is directly correlated with serum parathyroid hormone (PTH), calcium, and phosphate level in uremic patients who are on maintenance hemodialysis (7-9).
There is evidence that the plasma FGF23 level is regulated or affected by dietary phosphate. Recently, dietary consumption of phosphate was shown to increase serum FGF23 level in both uremic rats and non-uremic mice (10-12). In healthy individuals, increased dietary phosphate load has been reported to increase the serum level of FGF23 (13-16).
In addition, calcitriol was shown to up-regulate serum FGF23 level in mice and in parathyroidectomized rats without a corresponding increase in serum phosphate level (10), suggesting a role for both dietary phosphate and calcitriol in FGF23 secretion. Concerning humans, there are data that correlate calcitriol with FGF23 in patients with renal impairment (17) and in patients with hypoparathyroidism (18), while data relating calcitriol with FGF23 in healthy individuals do not exist as far as we are aware.
In this study, we attempted to examine the short-term effect of calcitriol on FGF23 level in humans and to determine whether the effect is direct or indirect through calcitriol-induced increased absorption of phosphorus from the intestine.
Patients and Methods
The study was approved by the Scientific Board of KAT hospital and validated by the central Institutional Review Board (no.: 11/23-9-2010). Informed consent was obtained from all participants. Twenty healthy adult volunteers, aged 20-50 years old, of both sexes, were enrolled in the study and 15 of them completed the study. All participants had no history of chronic diseases (kidney, liver or cardiovascular diseases, diabetes mellitus, malabsorption, etc.) and were not taking any medications or supplements.
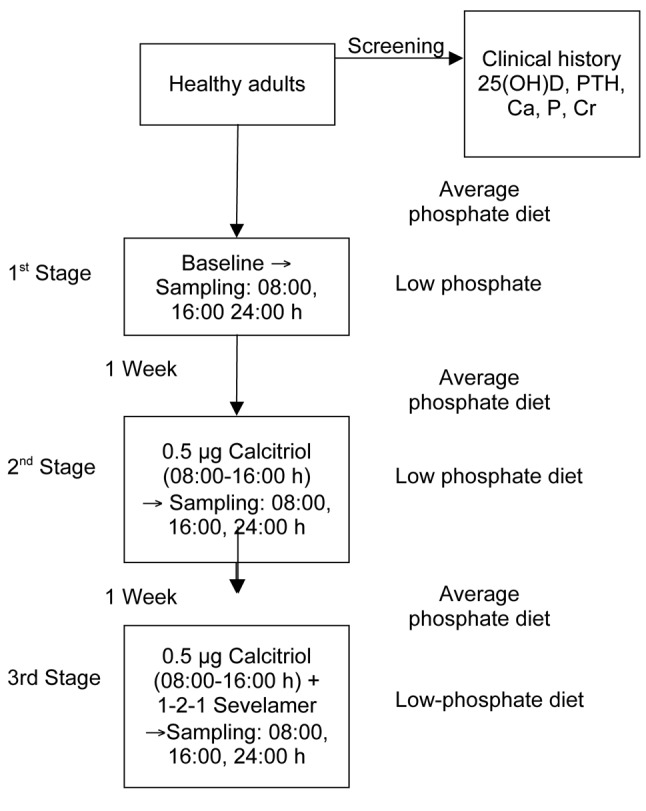
All participants were tested at three time points/stages, lasting 24 h and at 1-week intervals (Figure 1). During each stage, blood samples were taken at 08.00 h (fasting), at 16.00 h, and the next morning at 08.00 h (fasting) (time 0, 8 and 24 h respectively). At baseline, samples were taken under no intervention. At the second stage, while fasting, participants received 0.5 μg oral calcitriol (before blood sampling at 08.00 and 16.00. At the third stage, participants received 0.5 μg oral calcitriol preprandially (before blood sampling at time 08.00 and 16.00) and sevelamer hydrochloride during meals at a dose of 800 mg, 16.00 mg and 800 mg, respectively. Τhe low-phosphorus diet combined with sevelamer administration provides a reliable further reduction in the intake of phosphorus with subsequent weakness in increasing its absorption from the intestinal tract, which was induced by the administration of calcitriol. Participants followed a diet with a low-phosphorus intake on the days of blood sampling (phosphorus intake to 625 mg/day; Low P diet: Consumption of single serving of dairy per day, up to 150 g meat, chicken, fish or seafood and avoidance of cola type refreshments, beer and chocolate), while the week prior to blood sampling they followed a diet with a medium phosphorus intake (phosphorus intake of 1,500 to 1,800 mg/day) based on instructions given in their special diets in order to be able to compare the findings of the three stages of the study.
Figure 1. Design of the study.
Biochemical measurements. Blood samples from all participants were collected into tubes containing either K3-ethylenediaminetetra-acetic acid (K3-EDTA) or SST-Gel/clot activator for plasma and serum separation, respectively. Plasma was prepared by centrifugation (1,370 × g at 4˚C for 10 min). For serum separation, blood was allowed to clot at room temperature for 20 min and then it was centrifuged (1,500 × g at 4˚C for 15 min). Serum and plasma samples were stored in multiple aliquots at −80˚C until tested. 1,25(OH)2 Vitamin D levels were determined in serum using an enzyme-linked immunosorbent assay (Immunodiagnostic Systems, Boldon, UK). The lowest concentration of 1,25(OH)2 vitamin D measurable (sensitivity of this assay) was 6 pmol/l. The total analytical imprecision (coefficient of variation) CVa of this assay was <20.0%.
The level of human intact FGF23 was determined in EDTA-plasma using a commercial kit (Immunotopics, San Clemente, CA, USA). This method is a two-site enzyme-linked immunosorbent assay (ELISA) for the measurement of FGF-23 in plasma or cell culture media. Two affinity-purified goat polyclonal antibodies are used to detect epitopes within the amino-terminal and the carboxyl-terminal portions of FGF-23. A standard curve is generated by plotting the absorbance versus the respective intact FGF-23 concentration for each standard on linear or logarithmic scales. The concentration of human intact FGF-23 in the samples is determined directly from this curve. The enzymatic activity of the antibody complex bound to the well is directly proportional to the amount of intact FGF-23 in the sample. Results are reported in pg/ml. The lowest concentration of human intact FGF23 measurable (sensitivity of this assay) was 1 pg/ml. The total analytical imprecision CVa of this assay was <10.0%. The 1,25-hydroxyvitamin D level in serum was determined using an enzyme immunoassay (Immunodiagnostic Systems DHVD3, USCN Life Science Inc. Wuhan, Hubei, PR China). The sensitivity of this assay was 5 nmol/I. The total analytical imprecision (CVa) of this assay in our laboratory was <10.0%. The PTH level was determined in plasma using a second-generation electrochemiluminescence immunoassay (Cobas e411; Roche, Mannheim, Germany). The assay had a sensitivity of 1.2 pg/ml. The total analytical imprecision (CVa) of this assay in our laboratory was <3.5%.
Serum creatinine level was determined using a modified Jaffe method on an Architect ci-16200 analyzer (Abbott, Chicago, IL, USA). The calibration of this assay is isotope-dilution mass spectrometry traceable. The total analytical imprecision (CVa) of this assay in our laboratory was <2.8%. Serum total calcium, inorganic phosphate and albumin levels were aIso determined using colorimetric assays on an Architect ci-16200 analyzer (Abbott). The total analytical imprecision (CVa) of these assays in our laboratory was <1.2%, <2.6% and <3.5%, respectively.
Statistical analysis. For continuous variables, data are presented as means±SD or median [interquartile range (IQR)] in the case of non-normally distributed variables. Differences between times at the three different stages were tested with Friedman and Wilcoxon test. Moreover to analyze the differences between stages over time, we calculated the percentage change of variables from baseline at each reassessment. Comparison of percentage changes from baseline between the three stages was analyzed using the Friedman test. Pairwise comparisons were performed by the Wilcoxon test. All tests were two-sided and statistical significance was set at p<0.05. Power analysis indicated that a sample of 15 per stage was sufficient to have a 90% chance of revealing a difference between calcitriol and calcitriol plus sevelamer stage greater than 8% (15% versus 7%, SD 5%) percentage change of FGF23 with 5% significance. All analyses were carried out using the statistical package Statistical Package for the Social Sciences, ver. 17.00 (SPSS Inc. Chicago, IL, USA).
Results
Participant characteristics. The mean age of the male participants (n=4) was 35.5±7.05 years (range=25-40 years) and the mean body mass index (BMI) was 24.83±2.73 kg/m2 (range=21.75-28.37 kg/m2). Concerning females (n=11), the mean age was 38.18±6.73 years (range=25-50 years) and the mean BMI was 22.92±3.44 kg/m2 (range=18.59-29.60 kg/m2).
Baseline. During the first stage of the study (baseline) there was no statistically significant difference (all p>0.05) concerning Ca, P, FGF23, PTH and calcitriol (Figures 2-4) levels between the three time points (0 vs. 8 vs. 24 h) (Table I). Furthermore there was no statistically significant difference between the stages (1 vs. 2 vs. 3) at time 0 h (p>0.050) for any of the variables tested (Table II).
Table I. Comparison of variables at each time point for the first stage(baseline).
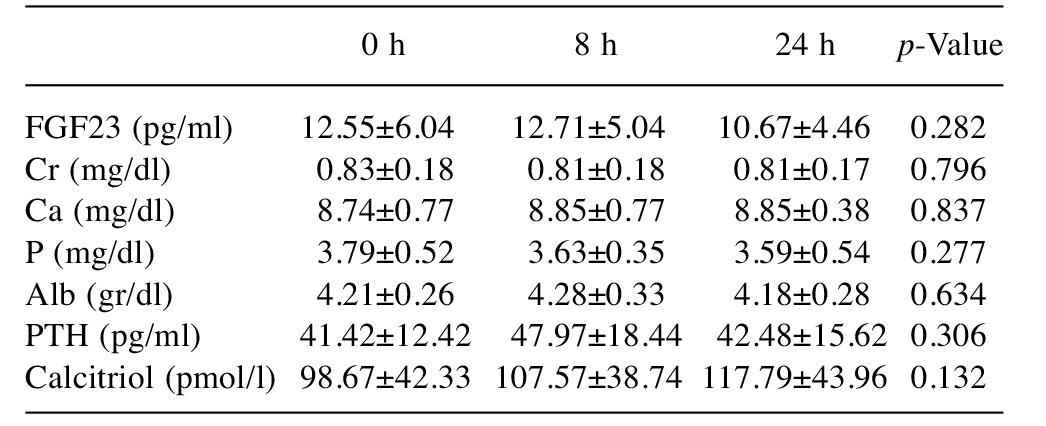
Alb; Albumin; Cr: creatinine; FGF23: fibroblast growth factor-23; PTH:parathyroid hormone. Data are presented as means±SD
Table II. Comparison of variables between stages at time 0.
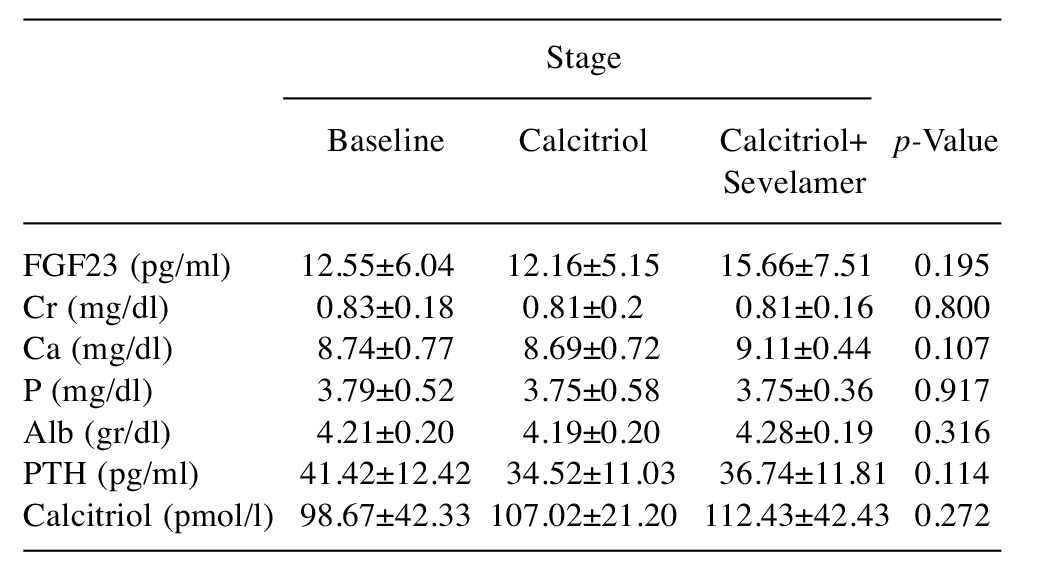
Alb; Albumin; Cr: creatinine; FGF23: fibroblast growth factor-23; PTH:parathyroid hormone. Data are presented as mean±SD
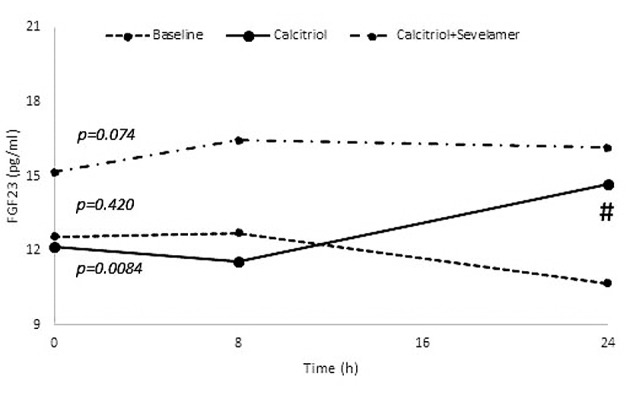
Stages 2 and 3. Changes of FGF23: During calcitriol administration (stage 2), the FGF23 level changed significantly (p=0.008), with the 24 h level being significantly higher than that at 8 h (p=0.036). However during combined calcitriol and sevelamer administration (stage 3), the FGF23 level did not change significantly (p=0.074) (Figure 2).
Figure 2. Changes of fibroblast growth factor-23 (FGF23) during the three stages of this study. Values are presented as means. p-Values at the beginning of the lines represent the results of Friedman test. #p<0.05 for the comparison between 8 vs. 24 h.
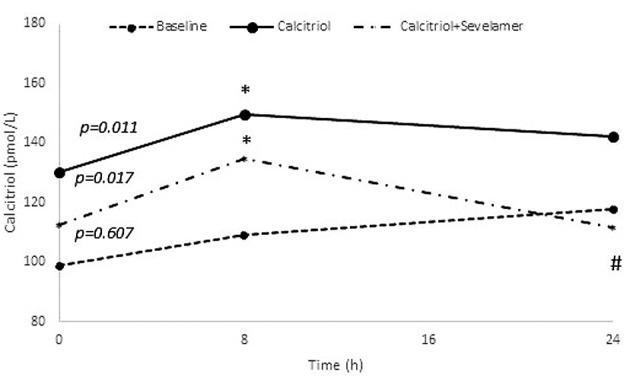
Changes of calcium, phosphate, PTH and calcitriol: During calcitriol administration (stage 2), calcium and phosphate levels did not change significantly (p=0.882 and p=0.717), respectively. During combined calcitriol and sevelamer administration (stage 3), calcium and phosphate levels also did not change (p=0.417 and p=0.516). During calcitriol administration (stage 2), and combined calcitriol and sevelamer administration (stage 3) there was no significant change in PTH (p=0.085 and p=0.449, respectively) (Figure 3). However, the calcitriol level did change at both stage 2 and stage 3 (p=0.011 and p=0.017, respectively), with the 8 h calcitriol level being significantly higher than that at baseline (p=0.031 and p=0.023, respectively) (Figure 4).
Figure 3. Changes of parathyroid hormone (PTH) during the three stages of this study. Values are presented as means. p-Values at the beginning of the lines represent the results of Friedman test.
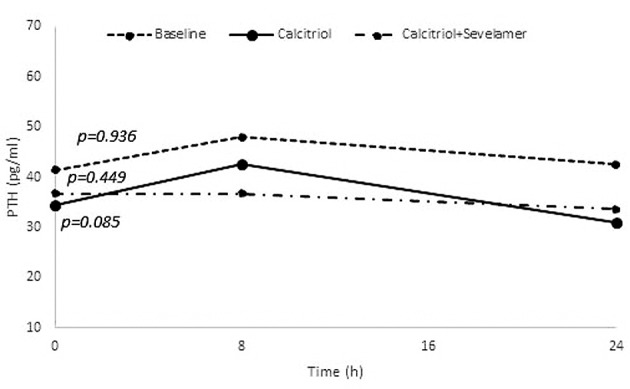
Figure 4. Changes of calcitriol during the three stages of this study. Values are presented as means. p-Values at the beginning of the lines represent the results of Friedman test. *p<0.05 for the comparison between 8 vs. 0 h. #p<0.05 for the comparison between 8 vs. 24 h.
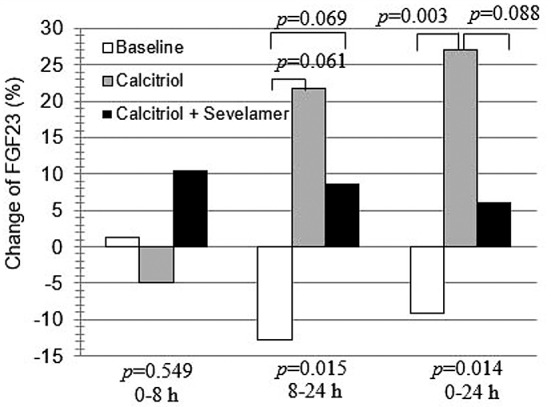
Percentage change of FGF23. In order to analyze the response to calcitriol vs. combined calcitriol and sevelamer administration over time, we calculated the percentage change of each variable for the three different stages (Table III) and compared changes from time 0 to 8 h, 8 to 24 h and 0 to 24 h by the Friedman and Wilcoxon tests.
Table III. Between-stage comparison of percentage change in value from baseline during the observation period.

Data are presented as median (interquartile range), *p<0.050 vs. baseline
There was no statistically significant difference in change of FGF23 among the three stages during the time period of 0 to 8 h (Figure 5). However for 0 to 24 h and 8 to 24 h, the change in FGF23 did differ between stages). Pairwise comparisons indicated a significant difference in FGF23 change at 8 vs. 24 h between baseline and calcitriol (p=0.003) and a trend for differences from 0 to 24 h between the baseline stage vs. calcitriol (p=0.061) and baseline vs. combined calcitriol and sevelamer stage (p=0.069).
Figure 5. Change of fibroblast growth factor (FGF23) (%) between the three different stages of this study. Bars represent median levels. p- Values represent the results of Friedman and Wilcoxon tests.
Discussion
In this study, we showed that oral administration of calcitriol to healthy adults tended to increase the circulating FGF23 level after 24 h, while combined calcitriol and sevelamer, manipulation that would restrain increase in phosphate level following calcitriol, failed to lead to the same result. Moreover, the percentage changes of FGF23 after calcitriol were significantly higher compared to baseline. In contrast, concomitant sevelamer and calcitriol administration did not result in short-term FGF23 change, indicating that prevention of phosphate elevation by sevelamer might result in a lower FGF23 level.
A review of existing studies involving FGF23 reveals that active vitamin D seems to be the most important systemic factor regulating FGF23. Ito et al. identified a vitamin D-responsive element in the promoter region of the gene for FGF23 and found that treatment with calcitriol in the presence of high phosphate in K-562 erythroleukemia cell lines caused a dose-dependent increase in FGF23; on the contrary, calcium had no effect (19). In addition, Saito et al. reported that administration of 1,25(OH)2D increased serum FGF23 in thyroparathyroidectomized but there was no response in vitamin D receptor null mice (10). Moreover, disruption of 1,25(OH)2D pathways reduced circulating FGF23. These findings suggest that calcitriol directly or indirectly regulates circulating FGF23. Serum FGF23 had a strong correlation with serum and dietary phosphorus in uremic rats but administration of calcitriol also caused a several-fold increase in FGF23. Studies in humans with hypoparathyroidism indicate that FGF23 is markedly elevated within 24 h in response to calcitriol (19), further highlighting the stimulating effect of calcitriol and the requirement of PTH for the full phosphaturic response to FGF23.
Phosphate also seems to have a crucial role in the regulation of FGF23. Assessing the responses to changes of dietary phosphate in laboratory animals, Ito et al. found that plasma FGF23 levels are stimulated by high dietary and plasma inorganic phosphate, while in K562 cells, FGF23 promoter activity was increased in high-phosphate medium (19). Similar results were also reported by other investigators (10,12).
Studies in humans by Antoniucci et al. (15) and Burnett et al. (16) revealed that serum FGF23 decreased during phosphorus restriction and increased during supplementation, concluding that dietary phosphate variation, rather than the plasma level, is the key regulator of circulating FGF23, a finding that was more clearly demonstrated in assays measuring the intact FGF23 molecule.
On the other hand, Oliveira et al. found that sevelamer hydrochloride mildly the lowered FGF23 level without significantly changing serum calcium or phosphate levels in normophosphatemic patients with chronic kidney diseas (20).
In our study, we observed that oral administration of calcitriol to healthy adults tended to increase the circulating FGF23 level after 24 h, both in terms of the percentage change and absolute FGF23 level, while no significant changes were observed as early as 8 h after the administration of calcitriol. Notably, the magnitude of percentage change of FGF23 in the calcitriol-only stage was higher compared with the calcitriol plus sevelamer stage (21.8% vs. 8.6%), suggesting that calcitriol-induced increased absorption of phosphorus from the intestine might also contribute to the increase of FGF23. In other words, diminished phosphate absorption from the gut, caused by parallel sevelamer administration in the third stage, limited the increase in FGF23. However, no statistically significant difference in change between the calcitriol only and calcitriol plus sevelamer stages emerged, probably due to the small number of participants.
Our study has limitations. Firstly, although certain dietary instructions were given to the participants concerning the phosphorus intake throughout the study, it is possible that lack of compliance led to false estimation of the indirect effect of calcitriol to FGF23 through phosphate. Secondly, we only assessed the effect of calcitriol on FGF23 over a brief period and it is unknown if these changes would be maintained during a longer observation.
Finally, although we estimated that a sample of 15 people per group was required in order to have a 90% likelihood of highlighting the difference in percentage change in between-stage comparisons (considering that the analysis was performed by the Wilcoxon test and all tests were two-sided) and we performed the study with 15 participants; a bigger number of participants may had highlighted the difference in the percentage increase of FGF23 between the calcitriol and calcitriol plus sevelamer groups.
In summary, this study shows that the administration of calcitriol to healthy humans increases the circulating level of FGF23 within 24 h of the manipulation and there is a tendency for higher increase on administration of calcitriol vs. calcitriol plus sevelamer, defined by the magnitude of change of FGF23, suggesting that calcitriol-induced increased absorption of phosphorus from the intestine is also responsible for the increase of FGF23.
Acknowledgements
This work was supported by a grant from the Hellenic Endocrine Society.
References
- 1.Yamashita T, Yoshioka M, Itoh N. Identification of a novel fibroblast growth factor, FGF23, preferentially expressed in the ventrolateral thalamic nucleus of the brain. Biochem Biophys Res Commun. 2000;277:494–498. doi: 10.1006/bbrc.2000.3696. [DOI] [PubMed] [Google Scholar]
- 2.Mirams M, Robinson BG, Mason RS, Nelson AE. Bone as a source of FGF23: Regulation by phosphate. Bone. 2004;35:1192–1199. doi: 10.1016/j.bone.2004.06.014. [DOI] [PubMed] [Google Scholar]
- 3.Shimada T, Kakitani M, Yamazaki Y, Hasegawa H, Takeuchi Y, Fujita T, Fukumoto S, Tomizuka K, Yamashita T. Targeted ablation of FGF23 demonstrates an essential physiological role of FGF23 in phosphate and vitamin D metabolism. J Clin Invest. 2004;113:561–568. doi: 10.1172/JCI19081. [DOI] [PMC free article] [PubMed] [Google Scholar]
- 4.Saito H, Kusano K, Kinosaki M, Ito H, Hirata M, Segawall H, Miyamoto K, Fukushima N. Human fibroblast growth factor 23 mutans suppress Na+-depended phosphate cotransport activity and 1 alpha, 25-dihydroxyvitamine D3 production. J Biol Chem. 2003;278:2206–2211. doi: 10.1074/jbc.M207872200. [DOI] [PubMed] [Google Scholar]
- 5.Shimada T, Hasegawa H, Yamazaki Y, Muto T, Hino R, Takeuchi Y, Fujita T, Nakahara K, Fukumoto S, Yamashita T. FGF23 is a potent regulator of vitamin D metabolism and phosphate homeostasis. J Bone Miner Res. 2004;19:429–435. doi: 10.1359/JBMR.0301264. [DOI] [PubMed] [Google Scholar]
- 6.Liu S, Tang W, Liu S1, Tang W, Zhou J, Stubbs JR, Luo Q, Pi M, Quarles LD. Fibroblast growth factor 23 is a counter-regulatory phosphaturic hormone for vitamin D. J Am Soc Nephrol. 2006;17:1305–1315. doi: 10.1681/ASN.2005111185. [DOI] [PubMed] [Google Scholar]
- 7.Gutierrez OM. Fibroblast growth factor 23 and disordered vitamin d metabolism in chronic kidney disease: updating the “trade-off” hypothesis. Clin J Am Soc Nephrol. 2010;5:1710–1716. doi: 10.2215/CJN.02640310. [DOI] [PubMed] [Google Scholar]
- 8.Imanishi Y, Inaba M, Nakatsuka K, Nagasue K, Okuno S, Yoshihara A, Miura M, Miyauchi A, Kobayashi K, Miki T, Shoji T, Ishimura E, Nishizawa Y. FGF23 in patients with end-stage renal disease on hemodialysis. Kidney Int. 2004;65:1943–1946. doi: 10.1111/j.1523-1755.2004.00604.x. [DOI] [PubMed] [Google Scholar]
- 9.Larsson T, Nisbeth U, Ljunggren O, Juppner H, Jonsson KB. Circulating concentration of FGF23 increases as renal function declines in patients with chronic kidney disease, but does not change in response to variation in phosphate intake in healthy volunteers. Kidney Int. 2003;64:2272–2279. doi: 10.1046/j.1523-1755.2003.00328.x. [DOI] [PubMed] [Google Scholar]
- 10.Saito H, Maeda A, Ohtomo S, Hirata M, Kusano K, Kato S, Ogata E, Segawa H, Miyamoto K, Fukushima N. Circulating FGF23 is regulated by 1alpha,25-dihydroxyvitamin D3 and phosphorus in vivo. J Biol Chem. 2005;280:2543–2549. doi: 10.1074/jbc.M408903200. [DOI] [PubMed] [Google Scholar]
- 11.Nagano N, Miyata S, Abe M, Kobayashi N, Wakita S, Yamashita T, Wada M. Effect of manipulating serum phosphorus with phosphate binder on circulating PTH and FGF23 in renal failure rats. Kidney Int. 2006;69:531–537. doi: 10.1038/sj.ki.5000020. [DOI] [PubMed] [Google Scholar]
- 12.Perwad F, Azam N, Zhang MY, Yamashita T, Tenenhouse HS, Portale AA. Dietary and serum phosphorus regulate fibroblast growth factor 23 expression and 1,25- dihydroxy-vitamine D metabolism in mice. Endocrinology. 2005;146:5358–5364. doi: 10.1210/en.2005-0777. [DOI] [PubMed] [Google Scholar]
- 13.Ferrari SL, Bonjour JP, Rizzoli R. Fibroblast growth factor-23 relationship to dietary phosphate and renal phosphate handling in healthy young men. J Clin Endocrinol Metab. 2005;90(3):1519–1524. doi: 10.1210/jc.2004-1039. [DOI] [PubMed] [Google Scholar]
- 14.Nishida Y, Taketani Y, Yamanaka-Okumura H, Imamura F, Taniguchi A, Sato T, Shuto E, Nashiki K, Arai H, Yamamoto H, Takeda E. Acute effect of oral phosphate loading on serum fibroblast growth factor 23 levels in healthy men. Kidney Int. 2006;70:2141–2147. doi: 10.1038/sj.ki.5002000. [DOI] [PubMed] [Google Scholar]
- 15.Antoniucci DM1, Yamashita T, Portale AA. Dietary phosphorus regulates serum fibroblast growth factor-23 concentrations in healthy men. J Clin Endocrinol Metab. 2006;91(8):3144–3149. doi: 10.1210/jc.2006-0021. [DOI] [PubMed] [Google Scholar]
- 16.Burnett SA, Gunawardene S, Bringhurst FR, Jüppner H, Lee H, Finkelstein JS. Regulation of C- terminal and Intact FGF23 by dietary phosphate in men and in women. J Bone Miner Res. 2006;21:1187–1196. doi: 10.1359/jbmr.060507. [DOI] [PubMed] [Google Scholar]
- 17.Kazama J, Sato F, Omori K, Hama H, Yamamoto S, Maruyama H, Narita I, Gejyo F, Yamashita T, Fukumoto S, Fukagawa M. Pretreatment serum FGF23 predict the efficacy of calcitriol therapy in dialysis patients. Kidney Int. 2005;67:1120–1125. doi: 10.1111/j.1523-1755.2005.00178.x. [DOI] [PubMed] [Google Scholar]
- 18.Collins M, Lindsay J, Jain A, Kelly M, Cutler C, Weinstein L, Liu J, Fedarko N, Winer K. Fibroblast growth factor 23 is regulated by 1,25- dihydroxyvitamine D. J Bone Miner Res. 2005;20:1944–1950. doi: 10.1359/JBMR.050718. [DOI] [PubMed] [Google Scholar]
- 19.Ito M, Sakai Y, Furumoto M, Segawa H, Haito S, Yamanaka S, Nakamura R, Kuwahata M, Miyamoto K. Vitamin D and phosphate regulate fibroblast growth factor-23 in K-562 cells. Am J Physiol Endocrinol Metab. 2005;288(6):E1101–1109. doi: 10.1152/ajpendo.00502.2004. [DOI] [PubMed] [Google Scholar]
- 20.Oliveira RB, Cancela AL Graciolli FG, Dos Reis LM, Draibe SA, Cuppari L, Carvalho AB, Jorgetti V, Canziani ME, Moyses RM. Early control of PTH and FGF23 in normophosphatemic CKD patients: a new target in CKD-MBD therapy. Clin J Am Soc Nephrol. 2010;5:286–291. doi: 10.2215/CJN.05420709. [DOI] [PMC free article] [PubMed] [Google Scholar]


