

Abstract
Array-based comparative genomic hybridization (CGH) measures copy-number variations at multiple loci simultaneously, providing an important tool for studying cancer and developmental disorders and for developing diagnostic and therapeutic targets. Arrays for CGH based on PCR products representing assemblies of BAC or cDNA clones typically require maintenance, propagation, replication, and verification of large clone sets. Furthermore, it is difficult to control the specificity of the hybridization to the complex sequences that are present in each feature of such arrays. To develop a more robust and flexible platform, we created probe-design methods and assay protocols that make oligonucleotide microarrays synthesized in situ by inkjet technology compatible with array-based comparative genomic hybridization applications employing samples of total genomic DNA. Hybridization of a series of cell lines with variable numbers of X chromosomes to arrays designed for CGH measurements gave median ratios for X-chromosome probes within 6% of the theoretical values (0.5 for XY/XX, 1.0 for XX/XX, 1.4 for XXX/XX, 2.1 for XXXX/XX, and 2.6 for XXXXX/XX). Furthermore, these arrays detected and mapped regions of single-copy losses, homozygous deletions, and amplicons of various sizes in different model systems, including diploid cells with a chromosomal breakpoint that has been mapped and sequenced to a precise nucleotide and tumor cell lines with highly variable regions of gains and losses. Our results demonstrate that oligonucleotide arrays designed for CGH provide a robust and precise platform for detecting chromosomal alterations throughout a genome with high sensitivity even when using full-complexity genomic samples.
Keywords: cancer, DNA microarrays, genome
Array-based comparative genomic hybridization (aCGH) allows the identification of chromosomal regions of gains and losses in cancers and genetic diseases (1-5). Oligonucleotide-array probes can be designed in silico for any sequenced region of a genome, thus allowing genome-wide and higher-density region-specific coverage, in principle. Application-specific designs, assays, and analysis methods allow routine use of oligonucleotide arrays for gene-expression studies and characterization of DNA polymorphisms and mutations (6-11). Typically, these applications use labeled targets of markedly reduced complexity relative to a complete genome (for example, expressed sequences in transcriptional profiling and PCR amplicons for polymorphic allele analyses). The usefulness of oligonucleotide arrays for aCGH has also been examined by using targets of reduced complexity (12-16). However, the broadest use of aCGH, including both a simplified preparation of targets and hybridization of samples to any array design of interest, requires preserving the greatest possible complexity of targets derived from whole-genome samples. Therefore, we investigated and developed probe-design criteria, assay conditions, and analysis methods that enable 60-mer oligonucleotide arrays to be used for CGH measurements even when using total genomic DNA.
We used two array designs for these studies. The first design, consisting of 60-mer oligonucleotide probes designed and validated for expression profiling of >17,000 transcripts (expression array), was used to develop initial assay conditions for aCGH. The second design consisted of custom microarrays containing a higher density of probes that represent unique genomic sequences for selected chromosomes (CGH array). The content of the CGH array was biased toward gene regions, but it also included noncoding regions for chromosome-wide coverage. These arrays were used to explore performance improvements that could be made possible by developing oligonucleotide probe-selection methods specifically for CGH.
Materials and Methods
Genomic DNA. We obtained genomic DNA from normal male 46,XY and normal female 46,XX from Promega. The following cell lines are part of the National Institute of General Medical Sciences Human Genetic Cell Repository and were obtained from the Coriell Institute for Medical Research (Camden, NJ): 47,XXX (repository no. GM04626), 48,XXXX (repository no. GM01415D), 49,XXXXX (repository no. GM05009C), and the 18q deletion-syndrome cell line (repository no. GM50122). The colon (COLO 320DM, HT 29, and HCT116) and breast (MDA-MB-231 and MDA-MB-453) carcinoma cell lines were obtained from the American Type Culture Collection. Each cell line was grown under the conditions recommended by the supplier. Genomic DNA was prepared from each cell line by using the DNeasy tissue kit (Qiagen, Germantown, MD). Tumor biopsies were collected from 1980-2003 and accessed by means of the National Cooperative Human Tissue Network (Charlottesville, VA). Total cellular DNA was isolated from fresh-frozen tumor specimens by using TRIzol reagent (Invitrogen) extraction techniques and further purified by phenol-chloroform extraction.
Oligonucleotide Microarrays. Expression array. The human 1A microarray (Agilent Technologies) contained in situ synthesized 60-mer oligonucleotides representing 17,086 unique human genes. The probes on these arrays were designed primarily for 3′ regions of expressed sequences in the human genome.
CGH array. A custom oligonucleotide array designed for CGH contained 4,878 chromosome-X, 3,293 chromosome-18, 7,723 chromosome-17, and 5,464 chromosome-16 60-mer probes. These probes included both coding and noncoding sequences on these chromosomes. Also, there were 917 other autosomal probes on the CGH array that were common to both designs.
aCGH. For each CGH hybridization, we digested 20 μg of genomic DNA from the reference (46,XX female) and the corresponding experimental sample with AluI (20 units) and RsaI (20 units) (Promega). Alternatively, 10 ng of genomic DNA from the reference and experimental sample was amplified with φ29 polymerase according to the supplier's protocols (Qiagen) before restriction digestion. All digests were done for a minimum of 2 h at 37°C and then verified by agarose gel analysis. Individual reference and experimental samples were then filtered by using the QIAQuick PCR clean-up kit (Qiagen). Labeling reactions were performed with 6 μg of purified restricted DNA and a Bioprime labeling kit (Invitrogen) according to the manufacturer's instructions in a volume of 50 μl with a modified dNTP pool containing 120 μM each of dATP, dGTP, and dCTP; 60 μM dTTP; and 60 μM Cy5-dUTP (for the experimental sample) or Cy3-dUTP (for the 46,XX female reference) (PerkinElmer). Labeled targets were subsequently filtered by using a Centricon YM-30 column (Millipore). Experimental and reference targets for each hybridization were pooled and mixed with 50 μg of human Cot-1 DNA (Invitrogen)/100 μg of yeast tRNA (Invitrogen)/1× hybridization control targets (SP310, Operon Technologies, Alameda, CA). The target mixture was purified, concentrated with a Centricon YM-30 column, resuspended to a final volume of 250 μl, and then mixed with an equal volume of Agilent 2× in situ hybridization buffer.
Before hybridization to the array, the 500-μl hybridization mixtures were denatured at 100°C for 1.5 min and incubated at 37°C for 30 min. To remove any precipitate, the mixture was centrifuged at ≥14,000 × g for 5 min and transferred to a new tube, leaving a small residual volume (≤5 μl). The sample was applied to the array by using an Agilent microarray hybridization chamber, and hybridization was carried out for 14-18 h at 65°C in a rotating oven (Robbins Scientific, Mountain View, CA) at 4 rpm. The arrays were then disassembled in 0.5× SSC/0.005% Triton X-102 (wash 1) at 65°C then washed for 10 min at room temperature in wash 1, followed by 5 min at room temperature in 0.1× SSC/0.005% Triton X-102 (wash 2). Slides were dried and scanned by using an Agilent 2565AA DNA microarray scanner.
Image and Data Analysis. Microarray images were analyzed by using feature extraction software (version 6.1.1, Agilent Technologies). Default settings were used, except that probes from autosomal chromosomes were used for dye normalization by using the locally weighted linear-regression curve fit option. Also, we used signals from negative control features for background subtraction. The expression array design included 10 replicate features for a subset of 100 probes. For each probe with replicate features, the mean and standard deviation of background-subtracted signals was calculated in both channels independently after the elimination of outliers. Outlier feature rejection was based on limits of 1.5 intraquartile ranges from the median.
We applied three filtering procedures to our expression array data sets. First, 97 of the 17,086 probes were removed from our analyses because they had mean signals in the reference channel of less than three standard deviations above the mean of the negative control feature signals in at least three of five hybridizations. Second, to remove probes that cross mRNA splice boundaries, we removed the 755 probes that were not contiguous in the genome. Last, all expression-array probes were screened for homology against the whole human genome (http://genome.ucsc.edu; June 28, 2002). There were 5,175 probes that, although unique in the transcriptome, gave more than one hit in the genome and were removed subsequently from our analyses. This filter excluded probes with even as many as 19 mismatches to a second homologous site. A total of 11,072 probes on the expression arrays satisfied all three filtering criteria.
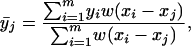
We did not apply any filters to the CGH array data sets. However, given the high density of probes per chromosome on the CGH arrays, visual interpretation of known genomic lesions in plots of raw data are obscured by even a small percentage of outlier probes. Therefore, we applied a 50-kb moving average, as calculated below, to plots presented in Figs. 4, 5, 6. The log2 ratio measured for all m probes of the chromosome was smoothed by using the following weighted moving average:
 |
1 |
Fig. 4.

Detection and mapping of single-copy intrachromosomal losses on chromosome 18q with CGH arrays. (A) The log2 ratios of the 3,293 chromosome-18 probes are plotted as a function of chromosomal position (×10 Mb) for hybridization of the GM50122 18q-cell line to the CGH array using a 50-kb moving average. Regions of loss (green), gain (red), and no change (blue) were color-coded by using a noise model based on six independent hybridizations with samples containing normal chromosome 18 with the CGH array (see Materials and Methods). (B) Localized view of breakpoint region on 18q21.3. Arrows indicate the nucleotide position (59,462,941) of the defined breakpoint in this cell line. The minimum error rate for detection of single-copy deletions of 18q21.3-qtel sequences in GM50122 versus XX hybridizations was 9% for the 637 18q probes that mapped distal to the breakpoint region on the CGH arrays. Data for GM050122 are given in Data Sets 23 and 24, which are published as supporting information on the PNAS web site.
Fig. 5.

Detection of homozygous deletions in HCT116 colon carcinoma cells with CGH arrays. (A) The log2 ratios of the 5464 chromosome-16 probes are plotted as a function of chromosomal position using a 50-kb weighted moving average. Regions of loss (green), gain (red), and no change (blue) were color-coded by using a noise model based on eight independent hybridizations with samples containing normal chromosome 16 with the CGH array (see Materials and Methods). The known homozygous deletions at the (1) A2BP1 (16p) and (2) FRA16D (16q) loci are shown. (B and C) Localized view of 16p homozygous deletion (B) and 16q homozygous deletion (C). Also, loss of terminal 16p (3) and duplication of terminal 16q (4) were detected. Data sets for HCT116 are given in Data Sets 25 and 26, which are published as supporting information on the PNAS web site.
Fig. 6.

Detection of complex chromosome-17 rearrangements in MDA-MB-453 cells with CGH arrays. The log2 ratios of the 7,723 chromosome-17 probes are plotted as a function of chromosomal position by using a 50-kb weighted moving average. (A) Regions of loss (green), gain (red), and no change (blue) in MDA-MB-453 cells were color-coded by using a noise model based on eight independent hybridizations of samples containing normal chromosome-17 (see Materials and Methods). Loss of 17p that spans the TP53 locus (p13.1) was observed. Also, distinct regions of amplification and loss were detected on the q arm. (B) Representative example of log2 ratios for chromosome-17 probes in a 46,XX self/self hybridization. Complete data sets for MDA-MB-453 and 46,XX self/self are given in Data Sets 27 and 28, which are published as supporting information on the PNAS web site.
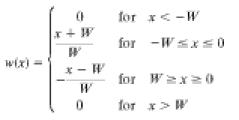
where yi is the measured log2 ratio at xi. The weights are given by the following triangular function:
 |
2 |
where xi is the chromosomal position (in bases) of probe i, and W is the half width of the triangular function.
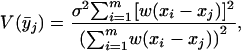
To begin exploring error modeling of aCGH data, we color-coded points in CGH array plots by using the following method. The variance of each smoothed point is estimated in terms of the uncertainties of each of the points as follows:
 |
3 |
where σ is the standard deviation of the log2 ratio for each set of chromosome-specific probes on the CGH array in a series of hybridizations with cell lines that are diploid for the entire chromosome under investigation. In each example, probes with log2 ratios  are shown in red (increase in copy number), probes with log2 ratios
  are shown in green (decrease in copy number), and all remaining probes are shown in blue (no change).
Results and Discussion
Designed for Expression Arrays. To characterize the capability of 60-mer oligonucleotide microarrays to detect and map regions of amplification and deletion throughout the genome, we used the expression array to measure copy-number variations in four well characterized tumor cell lines (COLO 320DM, HT 29, MDA-MB-231, and MDA-MB-453) with chromosomal abnormalities that have been analyzed by BAC aCGH (3) (Data Sets 1-8, which are published as supporting information on the PNAS web site). The lesions detected in the tumor cells include a high-level (log2 ratio = 6.4) amplification of MYC in COLO 320DM and an amplicon spanning 8q23.1-24.23 with a 3-fold (log2 ratio, 1.5) increase in the copy number of MYC with simultaneous single-copy 8p deletion in HT 29 (Fig. 1). These values are in quantitative agreement with previously published aCGH results (2, 3). For each cell line, plots of fluorescence ratios by position along each chromosome after smoothing with a full-width moving average of 1 Mb revealed features common to these data and previously published BAC aCGH results (Figs. 7-10, which are published as supporting information on the PNAS web site) (3).
Fig. 1.

Detection of copy-number variations in tumor cell lines with expression arrays. The log2 ratios of the 292 probes mapped on chromosome 8 that represent unique genomic sequences and had mean signals in the reference channel greater than three standard deviations above the mean of the negative control feature signals are plotted for COLO 320DM (A) and HT 29 (B) colorectal carcinoma cell lines as a function of chromosomal position with no moving averages. Previously characterized genomic lesions including high-level amplification of MYC in COLO 320DM and simultaneous 8p deletion and amplification of 8q in HT 29 cells were observed. Complete data for COLO 320DM and HT 29 are given in Data Sets 1-4 and Figs. 7 and 8, which are published as supporting information on the PNAS web site.
To test oligonucleotide aCGH with in vivo material, we used the expression arrays to screen four soft-tissue sarcomas analyzed previously with cDNA aCGH. A comparison using a common build of the human genome to map probe positions revealed a striking similarity between the cDNA and oligonucleotide aCGH profiles (Fig. 2). For example, amplicons on 12q that contained known targets of amplification in sarcomas were identified in these tumors by both array platforms (17-20) (Data Sets 9-12).
Fig. 2.

Detection of copy-number variations in sarcoma tissues with cDNA and oligonucleotide expression arrays. Log2 ratios are plotted with no moving average as a function of chromosomal position (Mb) for the cDNA (A) and oligonucleotide (B) arrays, showing detection of amplified regions in ST112, ST130, and ST240. The custom cDNA arrays contained PCR products representing 511 clones mapped to chromosome 12 (26). The oligonucleotide-array data plots include ratios from 399 oligonucleotide probes from chromosome 12 that represent unique genomic sequences and had mean signals in the reference channel greater than three standard deviations above the mean of the negative-control feature signals. Data sets for chromosome-12 probes on the oligonucleotide arrays for the four sarcoma patient samples are given in Data Sets 9-12, which are published as supporting information on the PNAS web site.
Designed for CGH Arrays. To begin exploring the freedom of design that in situ-synthesized 60-mer arrays allow, we created arrays that included 21,253 probes representing unique genomic sequences that span chromosomes X, 18, 17, and 16 at average spacings of 31, 23, 10.5, and 16 kb, respectively. These probes, in contrast to the probes on the expression arrays that are restricted to the 3′ regions of expressed sequences, represent unique genomic sequences, include coding and noncoding sequences, and have a narrower range of Tm values. For example, the X-chromosome probes have Tm values that range from 72-101°C on the expression arrays and from 75-87°C on the CGH arrays.
The initial assessment of the performance of these arrays was done with hybridizations of genomic DNA samples from a series of cell lines with variable copy numbers of the X chromosome using 46,XX DNA as a reference. A comparison of the median ratios for the X-chromosome probes from these hybridizations on the expression array (373 probes) and the CGH array (4,878 probes) revealed that the correlation coefficients were 0.98 and 0.99, respectively, and the slope increased from 0.47 to 0.96 (Fig. 3). The widths of the distributions of the ratios of the X-chromosome probes were broadest for XXXX/XX and XXXXX/XX hybridizations, similar to previous studies (2, 3), possibly reflecting the variability in these samples. Notably, however, the median ratio values on the CGH arrays of the X-chromosome probes in these data were 0.5 for XY/XX, 1.0 for XX/XX, 1.4 for XXX/XX, 2.1 for XXXX/XX, and 2.6 for XXXXX/XX (Fig. 3 C and D). To our knowledge, these data are in the closest agreement with the ideal values of 0.5, 1.0, 1.5, 2.0, and 2.5 reported for aCGH. These data emphasize the usefulness of designing and selecting in situ-synthesized oligonucleotide probes for aCGH assays.
Fig. 3.

Performance of expression and CGH arrays for detecting varying copy numbers of the X chromosome. Distributions and medians (dashed lines) of log2 ratios from X-chromosome oligonucleotide probes in XY/XX (blue), XX/XX (green), XXX/XX (red), XXXX/XX (teal), and XXXXX/XX (purple) hybridizations on expression (A) and CGH (C) arrays. Measured mean (open circles) and median (filled circles) fluorescence ratios of X-chromosome probes are plotted versus theoretical ratios for the expression (B) and CGH (D) arrays. Error bars represent the standard deviation for each median value. Median fluorescence ratios were as follows: 0.7 (XY/XX), 1.0 (XX/XX), 1.1 (XXX/XX), 1.3 (XXXX/XX), and 1.7 (XXXXX/XX) for the expression array; and 0.5 (XY/XX), 1.0 (XX/XX), 1.4 (XXX/XX), 2.1 (XXXX/XX), and 2.6 (XXXXXXX) for the CGH arrays. The expression arrays contain 644 X-chromosome probes designed for transcriptional analysis. A total of 269 of these X-chromosome probes failed the homology filter, and another two X-chromosome probes failed the low-signal filter. Thus, each expression-array plot includes 373 X-chromosome probes representing unique genomic sequences that gave signal intensities at least three standard deviations above the average of negative control feature signals. CGH array plots include all of the 4,878 chromosome-X probes on these arrays. The minimum error rate for detection of single copy deletions of X-chromosome sequences in XY versus XX hybridizations was 21% for the 373 filtered X-chromosome probes on the expression arrays and 5% for the 4,878 X-chromosome probes on the CGH arrays. X-chromosome probe sequences and complete data sets for expression arrays and CGH arrays from the five X-series cell lines and cumulative frequency distributions for the CGH arrays are given in Tables 1 and 2, Data Sets 13-22, and Fig. 12 which are published as supporting information on the PNAS web site.
To assess our ability to detect and map intrachromosomal single-copy losses, we examined the 3,293 probes on these arrays representing unique genomic sequences at an average spacing of ≈23 kb along chromosome 18 in the 18q-syndrome patient-derived cell line GM50122. The breakpoint in this cell line has been mapped and sequenced to an exact nucleotide position (21). The single-copy loss on 18q was detected, and the breakpoint region was localized visually and numerically to the known genomic location by using a moving average of 50 kb and our noise model for chromosome 18 (Fig. 4).
In addition to single-copy losses, tumor cells may contain homozygous deletions that target specific genes. Therefore, to assess our ability to detect and map homozygous deletions by using the CGH array, we used HCT116 colon carcinoma cells as a model system. These cells contain two known homozygous deletions on chromosome 16 that include the A2BP1 gene (16p13.2) and the FRA16D locus (16q23.2) (22, 23). The first of these homozygous deletions was detected by BAC aCGH, whereas the second homozygous deletion (16q) was characterized by positional cloning. The only loci with probes on these arrays whose measured log2 ratios were below a theoretical threshold of -2 in replicate experiments were 16p13.2 (nine probes) and 16q23.2 (two probes) (Fig. 5). The nine probes at 16p13.2 map to the first exon of the A2BP1 gene, consistent with prior BAC array data, and further defining the boundary of the deletion. Also, we observed a small terminal 16p loss and duplication on the end of the q-arm, consistent with previous BAC aCGH results (3).
Last, to assess the ability of oligonucleotide arrays to map and characterize chromosomes with complex rearrangements in aneuploid tumor cells, we used chromosome 17 in TP53mut MDA-MB-435 cells as a model (24). The CGH arrays contained 7,723 probes across chromosome 17, providing an average spacing of <11 kb between probes. Loss on 17p that spanned the TP53 locus at 17p13.1 was visualized by using a weighted moving-average window of 50 kb (Fig. 6). Also, distinct regions of gain (e.g., q21.32-q21.33, q23.2-q24.3, q25.1, and q25.3) and loss (e.g., 17q21.2-q21.31, q23.2, and q24.3) were detected with these arrays, consistent with previously published aCGH data (3). Recent studies have shown that highly processive DNA polymerases, such as φ29, can be used to prepare templates from limiting starting materials for aCGH measurements (25). The same patterns of chromosome 17 losses and gains in MDA-MB-453 cells were detected with the CGH arrays by using 10 ng of starting material and φ29 amplification (Fig. 11, which is published as supporting information on the PNAS web site).
Our results demonstrate that in situ synthesized 60-mer oligonucleotide arrays can reproducibly detect genomic lesions including single-copy and homozygous deletions, as well as variable amplicons even when using whole genomes as targets. Also, we show that our initial design and selection of oligonucleotide probes for CGH measurements enable more accurate measurements of genomic DNA copy-number changes than 60-mer probes optimized for mRNA detection. These findings imply that additional theoretical and experimental efforts to refine probe sequence selection, assay protocols, and analysis methods may yield further improvements in performance. The ability to use full-complexity samples with oligonucleotide arrays provides researchers the flexibility and performance to study copy-number variation in essentially any region of the genome with a single, simplified sample preparation. Thus, our data suggest that this technology could emerge as a standard tool for research and diagnostics of cancer and genetic disease.
Supplementary Material
Acknowledgments
We thank Michael Bittner for critical reading of the manuscript.
Author contributions: M.T.B., A.S., N.S., B.C., P.M., L.B., and S.L. designed research; M.T.B., A.S., A.B.-D., N.S., D.L., P.T., B.C., K.B., P.M., L.B., and S.L. performed research; A.B.-D., N.S., D.L., R.K., P.T., B.C., K.B., P.M., and Z.Y. contributed new reagents/analytic tools; M.T.B., A.S., A.B.-D., N.S., B.C., P.M., Z.Y., L.B., and S.L. analyzed data; and M.T.B., A.S., N.S., B.C., P.M., L.B., and S.L. wrote the paper.
Abbreviations: CGH, comparative genomic hybridization; aCGH, array-based CGH.
References
- 1.Pinkel, D., Segraves, R., Sudar, D., Clark, S., Poole, I., Kowbel, D., Collins, C., Kuo, W. L., Chen, C., Zhai, Y., et al. (1998) Nat. Genet. 20, 207-211. [DOI] [PubMed] [Google Scholar]
- 2.Pollack, J. R., Perou, C. M., Alizadeh, A. A., Eisen, M. B., Pergamenschikov, A., Williams, C. F., Jeffrey, S. S., Botstein, D. & Brown, P. O. (1999) Nat. Genet. 23, 41-46. [DOI] [PubMed] [Google Scholar]
- 3.Snijders, A. M., Nowak, N., Segraves, R., Blackwood, S., Brown, N., Conroy, J., Hamilton, G., Hindle, A. K., Huey, B., Kimura, K., et al. (2001) Nat. Genet. 29, 263-264. [DOI] [PubMed] [Google Scholar]
- 4.Greshock, J., Naylor, T. L., Margolin, A., Diskin, S., Cleaver, S. H., Futreal, P. A., deJong, P. J., Zhao, S., Liebman, M. & Weber, B. L. (2004) Genome Res. 14, 179-187. [DOI] [PMC free article] [PubMed] [Google Scholar]
- 5.Hodgson, G., Hager, J. H., Volik, S., Hariono, S., Wernick, M., Moore, D., Nowak, N., Albertson, D. G., Pinkel, D., Collins, C., et al. (2001) Nat. Genet. 29, 459-464. [DOI] [PubMed] [Google Scholar]
- 6.Chee, M., Yang, R., Hubell, E., Berno, A., Huang, X., Stern, D., Winkler, J., Lockhart, D., Morris, M. & Fodor, S. (1996) Science 274, 610-614. [DOI] [PubMed] [Google Scholar]
- 7.Lockhart, D., Dong, H., Byrne, M., Follettie, M., Gallo, M., Chee, M., Mittmann, M., Wang, C., Kobayashi, M., Horton, H. & Brown, E. (1996) Nat. Biotechnol. 14, 1675-1680. [DOI] [PubMed] [Google Scholar]
- 8.Hughes, T. R., Mao, M., Jones, A. R., Burchard, J., Marton, M. J., Shannon, K. W., Lefkowitz, S. M., Ziman, M., Schelter, J. M., Meyer, M. R., et al. (2001) Nat. Biotechnol. 19, 342-347. [DOI] [PubMed] [Google Scholar]
- 9.Hacia, J., Brody, L., Chee, M., Fodor, S. & Collins, F. (1996) Nat. Genet. 14, 441-447. [DOI] [PubMed] [Google Scholar]
- 10.Lindblad-Toh, K., Tanenbaum, D. M., Daly, M. J., Winchester, E., Lui, W. O., Villapakkam, A., Stanton, S. E., Larsson, C., Hudson, T. J., Johnson, B. E., et al. (2000) Nat. Biotechnol. 18, 1001-1005. [DOI] [PubMed] [Google Scholar]
- 11.Kennedy, G. C., Matsuzaki, H., Dong, S., Liu, W. M., Huang, J., Liu, G., Su, X., Cao, M., Chen, W., Zhang, J., et al. (2003) Nat. Biotechnol. 21, 1233-1237. [DOI] [PubMed] [Google Scholar]
- 12.Gray, J. W., Pinkel, D., Albertson, D., Collins, C. & Baldocchi, R. (1999) U.S. Patent US6465182.
- 13.Wigler, M. & Lucito, R. (1998) U.S. Patent US9823168.
- 14.Lucito, R., Healy, J., Alexander, J., Reiner, A., Esposito, D., Chi, M., Rodgers, L., Brady, A., Sebat, J., Troge, J., et al. (2003) Genome Res. 13, 2291-2305. [DOI] [PMC free article] [PubMed] [Google Scholar]
- 15.Zhao, X., Li, C., Paez, J. G., Chin, K., Janne, P. A., Chen, T. H., Girard, L., Minna, J., Christiani, D., Leo, C., et al. (2004) Cancer Res. 64, 3060-3071. [DOI] [PubMed] [Google Scholar]
- 16.Bignell, G. R., Huang, J., Greshock, J., Watt, S., Butler, A., West, S., Grigorova, M., Jones, K. W., Wei, W., Stratton, M. R., et al. (2004) Genome Res. 14, 287-295. [DOI] [PMC free article] [PubMed] [Google Scholar]
- 17.Jankowski, S. A., Mitchell, D. S., Smith, S. H., Trent, J. M. & Meltzer, P. S. (1994) Oncogene 9, 1205-1211. [PubMed] [Google Scholar]
- 18.Fritz, B., Schubert, F., Wrobel, G., Schwaenen, C., Wessendorf, S., Nessling, M., Korz, C., Rieker, R. J., Montgomery, K., Kucherlapati, R., et al. (2002) Cancer Res. 62, 2993-2998. [PubMed] [Google Scholar]
- 19.Reifenberger, G., Ichimura, K., Reifenberger, J., Elkahloun, A. G., Meltzer, P. S. & Collins, V. P. (1996) Cancer Res. 56, 5141-5145. [PubMed] [Google Scholar]
- 20.Meza-Zepeda, L. A., Berner, J. M., Henriksen, J., South, A. P., Pedeutour, F., Dahlberg, A. B., Godager, L. H., Nizetic, D., Forus, A. & Myklebost, O. (2001) Genes Chromosomes Cancer 31, 264-273. [DOI] [PubMed] [Google Scholar]
- 21.Katz, S. G., Schneider, S. S., Bartuski, A., Trask, B. J., Massa, H., Overhauser, J., Lalande, M., Lansdorp, P. M. & Silverman, G. A. (1999) Hum. Mol. Genet. 8, 87-92. [DOI] [PubMed] [Google Scholar]
- 22.Paige, J. W., Taylor, K. J., Stewart, A., Sgouros, J. G., Gabra, H., Sellar, G. C., Smyth, J. F., Porteous, D. J. & Watson, J. E. V. (2000) Cancer Res. 60, 1690-1697. [PubMed] [Google Scholar]
- 23.Albertson, D. G. & Pinkel, D. (2003) Hum. Mol. Genet. 12, Spec. No. 2, R145-52. [DOI] [PubMed] [Google Scholar]
- 24.Gayet, J., Zhou, X. P., Duval, A., Rolland, S., Hoang, J. M., Cottu, P. & Hamelin, R. (2001) Oncogene 20, 5025-5032. [DOI] [PubMed] [Google Scholar]
- 25.Paez, J. G., Lin, M., Beroukhim, R., Lee, J. C., Zhao, X., Richter, D. J., Gabriel, S., Herman, P., Sasaki, H., Altshuler, D., et al. (2004) Nucleic Acids Res. 32, e71. [DOI] [PMC free article] [PubMed] [Google Scholar]
- 26.Hedenfalk, I., Ringner, M., Ben-Dor, A., Yakhini, Z., Chen, Y., Chebil, G., Ach, R., Loman, N., Olsson, H., Meltzer, P., et al. (2003) Proc. Natl. Acad. Sci. USA 100, 2532-2537. [DOI] [PMC free article] [PubMed] [Google Scholar]
Associated Data
This section collects any data citations, data availability statements, or supplementary materials included in this article.