Abstract
Although infiltrating macrophages influence many pathological processes after spinal cord injury (SCI), the intrinsic molecular mechanisms that regulate their function are poorly understood. A major hurdle has been dissecting macrophage-specific functions from those in other cell types as well as understanding how their functions change over time. Therefore, we used the RiboTag method to obtain macrophage-specific mRNA directly from the injured spinal cord in mice and performed RNA sequencing to investigate their transcriptional profile. Our data show that at 7 d after SCI, macrophages are best described as foam cells, with lipid catabolism representing the main biological process, and canonical nuclear receptor pathways as their potential mediators. Genetic deletion of a lipoprotein receptor, CD36, reduces macrophage lipid content and improves lesion size and locomotor recovery. Therefore, we report the first macrophage-specific transcriptional profile after SCI and highlight the lipid catabolic pathway as an important macrophage function that can be therapeutically targeted after SCI.
SIGNIFICANCE STATEMENT The intrinsic molecular mechanisms that regulate macrophage function after spinal cord injury (SCI) are poorly understood. We obtained macrophage-specific mRNA directly from the injured spinal cord and performed RNA sequencing to investigate their transcriptional profile. Our data show that at 7 d after SCI, macrophages are best described as foam cells, with lipid catabolism representing the main biological process and canonical nuclear receptor pathways as their potential mediators. Genetic deletion of a lipoprotein receptor, CD36, reduces macrophage lipid content and improves lesion size and locomotor recovery. Therefore, we report the first macrophage-specific transcriptional profile after SCI and highlight the lipid catabolic pathway as an important macrophage function that can be therapeutically targeted after SCI.
Keywords: axon regeneration, fibrotic scar, foamy macrophages, glial scar, myelin laden macrophages, neuroinflammation
Introduction
Spinal cord injury (SCI) results in extensive infiltration of macrophages that play both beneficial and detrimental roles in multiple aspects of SCI pathology including inflammation, scar formation, and axon regeneration. For example, macrophage depletion acutely after SCI improves locomotion, increases tissue sparing, and reduces scar formation (Popovich et al., 1999; Zhu et al., 2015b). On the other hand, macrophages can promote axon regeneration as well as remyelination (Gensel et al., 2009; Kigerl et al., 2009; Miron et al., 2013; Kwon et al., 2015). While the macrophage phenotype seems to be partly responsible for these different pathologies, the molecular pathways underlying macrophage function after SCI are still poorly understood.
An important determinant of macrophage function is their surrounding microenvironment (Amit et al., 2016). After SCI, this environment changes dramatically over the first week. The first few days are dominated by an inflammatory response that perpetuates a “cytokine storm,” which promotes monocyte migration to the injury site and their differentiation into macrophages that also contribute to this inflammatory environment. After the acute inflammation subsides, the massive cell death that follows results in an environment filled with cellular debris, especially myelin debris that creates a unique lipid-dense environment (Wang et al., 2015). Recent studies suggest that myelin debris have significant effects on macrophage function after SCI (Greenhalgh and David, 2014; Kroner et al., 2014; Wang et al., 2015). This is reminiscent of specialized macrophages called foam cells that reside in lipid-dense atherosclerotic plaques (Schulz and Massberg, 2014). While myelin-laden macrophages in the CNS have also been referred to as foam cells (Bogie et al., 2013; Wang et al., 2015), whether they share similar genetic profiles as classic foam cells in peripheral tissues is not known.
A comprehensive transcriptome-wide analysis of macrophages may provide important mechanistic insight into their complex functions after SCI. However, virtually all previous transcriptomic studies on SCI have used homogenates of the entire injury site, which is problematic in trying to understand macrophage-specific pathways since other cell types such as neurons, microglia, and astrocytes contribute to the RNA expression patterns and have overlapping as well as distinct functions after SCI (Lööv et al., 2012; Evans et al., 2014; Greenhalgh and David, 2014; Sofroniew, 2015). Recent gene profiling techniques, such as translating ribosome affinity purification (TRAP) and RiboTag, have made it possible to obtain cell type-specific information from complex tissue (Heiman et al., 2008; Sanz et al., 2009). These techniques use GFP (for TRAP) or hemagglutinin (HA; for RiboTag) to tag ribosomal protein subunit that can be immunoprecipitated from complex tissue followed by RNA isolation. While TRAP requires generation of a new transgenic mouse line for each cell type of interest, a distinct advantage of RiboTag is that RiboTag mice can be bred to any preexisting Cre driver mice, thereby making this technology a very efficient choice for isolating cell type-specific RNA.
In this study, we used the RiboTag method and RNA-sequencing to obtain a macrophage-specific transcriptional profile after SCI. We compared macrophages as they first enter the injury site (3 d) and when their population reaches a peak (7 d) to gain a better understanding of how macrophage function changes during this critical pathogenic period. Our gene expression data demonstrates macrophages whose function transitions from inflammation and migration to lipid catabolism that is mediated by canonical nuclear receptor pathways. Reducing macrophage lipid content by genetic deletion of the lipoprotein receptor, CD36, is associated with reduced lesion size and improved locomotion after SCI. To our knowledge, this is the first study to perform a cell type–specific genomewide transcriptional analysis of macrophages after SCI and provides important insight into molecular pathways of lipid catabolism that can be therapeutically targeted after SCI.
Materials and Methods
Animals and surgical procedures.
LysM-Cre mice (The Jackson Laboratory stock #004781; RRID:IMSR_JAX:004781) were bred to Rpl22(HA)fl/fl RiboTag mice (The Jackson Laboratory, stock #011029; RRID:IMSR_JAX:011029) to generate LysMRpl22(HA) mice that were heterozygous for lysM-Cre (knock-in line) and homozygous for Rpl22(HA). CD45.1 mice were purchased from The Jackson Laboratory (stock #002014; RRID:IMSR_JAX:002014). Rosa26-tdTomato reporter mice were kindly donated by Dr. F. Wang (Arenkiel et al., 2011). CD36 KO mice were obtained from The Jackson Laboratory (stock #019006; RRID:IMSR_JAX:019006). All mice were in the C57BL/6 genetic background.
Mouse contusive SCI was performed as described previously (Lee and Lee, 2013). Mice were anesthetized (ketamine/xylazine, 100 mg/15 mg/kg, i.p.) before receiving midthoracic (T8) contusive spinal cord injuries. Female mice received a laminectomy at T8 and then the spinal column was stabilized using spinal clamps and positioned on an Infinite Horizon impactor device (Precision Systems and Instrumentation). The exposed spinal cord was visually aligned with the impactor tip and then given a moderate (75 kdyn) contusion via a computer-controlled delivery. Chimeric mice were 14–16 weeks old and other mice were 7–9 weeks old at the time of injury. All SCI mice received fluid supplements (lactated Ringer's solution, 1 ml), antibiotics (Baytril, 10 mg/kg), and analgesics (buprenorphine, 0.05 mg/kg) subcutaneously for the first week (twice per day) following surgery. Twice daily bladder expressions continued for the duration of the study. All procedures involving animals were approved by the University of Miami Institutional Animal Care and Use Committee and followed NIH guidelines.
Locomotor recovery in CD36 KO mice was assessed by two people using the Basso Mouse Scale (Basso et al., 2006) open field test at 1 d and weekly after injury. Scores for left and right hindlimbs were averaged for each animal at each time point, and scores from the two experimenters were averaged for each animal. Experimenters were blinded to the experimental groups by housing different genotypes together, randomly selecting each mouse for behavioral testing, and recording the animal number only after testing was completed. Experimenters remained blinded to the genotypes until the end of the experiment.
Immunohistochemistry.
Mice were perfused transcardially with 4% paraformaldehyde. Brains and spinal cords were harvested, postfixed for 2 h and placed in 30% sucrose overnight. An 8 mm mouse spinal segment centered at the injury site was embedded in OCT compound (Tissue-Tek) and sectioned on a cryostat. Sagittal sections were cut serially at 16 μm. Sections were washed with PBS and blocked using 5% normal goat serum in PBS with 0.1% Triton X-100. Incubation of primary antibodies was performed at 4°C in the blocking solution overnight, followed by incubation of appropriate Alexa Fluor secondary antibodies (Invitrogen; 1:500). Sections were mounted in Vectashield containing DAPI (Vector Laboratories), and images were collected with a Nikon Eclipse Ti fluorescent microscope or an Olympus FluoView 1000 confocal microscope. Primary antibodies used for immunohistochemistry were rat anti-HA (Roche, catalog #11867423001; RRID:AB_10094468; 1:200), rabbit anti-Iba1 (Wako, catalog #019-19741; RRID:AB_839504; 1:500), rat anti-CD36 (R&D Systems, MAB25191; RRID:AB_11128648; 1:50), and rat anti-GFAP (Invitrogen, catalog #130300; RRID:AB_2532994; 1:1000).
For measuring lipid droplets, after immunostaining with Iba-1 antibody, BODIPY (1 mg/ml; D3922, Invitrogen) was diluted in PBS and applied to spinal cord sections for 30 min followed by three 10 min PBS washes. All sections were mounted with Vectashield with DAPI (H-1200, Vector Laboratories) and covered with glass coverslips. For counting BODIPY-labeled lipid droplets in macrophages, BODIPY images were taken using an Olympus FV1000 FluoView confocal microscope using a 60× objective. The lipid droplets on five images per section were counted based on their size (2–5, 5–10, and 10–100 μm2) using ImageJ software (version 1.50i), and the numbers were averaged for each tissue section. For measuring lesion area, spinal cord sections were immunostained with GFAP antibody and images of the injury site were taken on a Nikon Eclipse Ti fluorescent microscope. Using ImageJ software, we drew a contour around the GFAP-negative area (lesion site) and measured the area of the enclosed region. Three spinal cord sections centered at the injury epicenter (section with largest lesion size) were counted for each animal and averaged for the final number of lipid droplets and lesion area. All experimenters performing the analyses were blinded to the experimental groups.
Bone marrow transplantation.
Bone marrow transplantation was performed as described previously (Zhu et al., 2015b). Female lysM-Cre+/Rpl22(HA)fl/fl donor mice (8–12 weeks old) were anesthetized (ketamine/xylazine, 100 mg/15 mg/kg i.p) and killed by cervical dislocation. Bone marrow cells from femur and tibia were flushed out with sterile HBSS using a 27.5 gauge needle attached to a 10 ml syringe. Red blood cells from bone marrow were lysed with Tris-buffered ammonium chloride (140 mm NH4Cl and 17 mm Tris, pH 7.65) for 1 min at 37°C. After three washes with sterile HBSS, bone marrow cells were passed through a 40 μm cell strainer to prepare single cell suspension. The number of live cells was estimated by trypan blue staining. Donor cells were injected into the tail vein (5 × 10⁵ cells/mouse) of female wild-type (WT) CD45.1 recipient mice (6–8 weeks old) that received lethal whole-body irradiation (900 rad, Gammacell 40, cesium-137 source) 1 d earlier. These lysMRpl22(HA)→CD45.1 chimeras were kept on antibiotics (gentamicin in drinking water, 0.5 mg/ml) for 2 weeks after irradiation/transplantation and allowed at least 8 weeks for reconstitution before receiving SCI as described below. Since the lysMRpl22(HA) donor mice carry a normal CD45.2 allele, the chimerism efficiency was determined by assessing the CD45.2/CD45.1 ratio using flow cytometry as described below.
Flow cytometry.
For calculation of chimerism efficiency, 150 μl of blood was collected from uninjured lysMRpl22(HA)→CD45.1 chimeras through the tail vein and mixed with heparinized HBSS (1 IU per 100 μl blood). Immune cells from blood were enriched with Ficoll-Paque (GE Healthcare) according to the manufacturer's instructions. To assess immune cell infiltration after SCI, mice were anesthetized and perfused transcardially with cold PBS at specified time points after injury. A 4 mm spinal segment centered at the injury site was dissected, and the meninges were removed. Spinal cord tissue was dissociated and passed through a 70 μm cell strainer. Cell suspension was mixed with myelin removal beads (Miltenyi Biotec, catalog #130-096-733) and passed through a MACS LS column (Miltenyi Biotec, catalog #130-042-401) according to manufacturer's instructions. The number of live cells was quantified by trypan blue staining. Cell suspension was Fc blocked with anti-mouse CD16/32 (BioLegend, catalog #101319; RRID:AB_1574973; 1:200) for 10 min on ice and subsequently incubated for 30 min at 4°C with the following surface antigens: anti-CD45.1-PE/Cy7 (BioLegend, catalog #110729; RRID:AB_1134170; 1:500), anti-CD45.2-Pacific Blue (BioLegend, catalog #109819; RRID:AB_492873; 1:500), anti-CD11b-Brilliant Violet 650 (BioLegend, catalog #101239; RRID:AB_11125575; 1:500), anti-Ly6G-PerCP/Cy5.5 (BioLegend, catalog #127615; RRID:AB_1877272; 1:200), anti-Ly6C-Brilliant Violet 510 (BioLegend, catalog #128033; RRID:AB_2562351; 1:200), anti-CD11c-APC/Cy7 (BioLegend, catalog #117323; RRID:AB_830646; 1:100), anti-CD86-PE/Cy5 (BioLegend, catalog #105015; RRID:AB_493603; 1:200), and anti-CD43-APC (BioLegend, catalog #143207; RRID:AB_11149489; 1:200). After surface staining, cells were fixed and permeabilized using the Foxp3 staining Kit (eBiosicence) before incubation with anti-CD206-PE/Cy7 (BioLegend, catalog #141719; RRID:AB_2562247; 1:200). The following isotype control antibodies were used to determine flow cytometry gating: rat IgG2a-PerCP/Cy5.5 (BioLegend, catalog #400531; RRID:AB_893691; 1:200), Armenian hamster IgG-APC/Cy7 (BioLegend, catalog #400927; RRID:AB_830906; 1:100), rat IgG2a-PE/Cy5 (BioLegend, catalog #400509; RRID:AB_326531; 1:200), rat IgG2b-APC (BioLegend, catalog #400611; RRID:AB_326555; 1:200), and rat IgG2a-PE/Cy7 (BioLegend, catalog #400521; RRID:AB_326541; 1:200). Cell suspension was analyzed using a BD LSRFortessa-HTS flow cytometer, and data were quantified using the FACS-Diva software (BD Biosciences).
RNA isolation and sequencing.
Protocol for RNA immunoprecipitation was adapted from the original RiboTag paper (Sanz et al., 2009). Tissue homogenate was prepared as follows: 4 mm spinal cord injury site tissues at 3 and 7 d after SCI (4 animals were pooled as one biological replicate, n = 3 at each time point) were rapidly extracted and weighed before homogenization (6% w/v) with a prechilled Dounce homogenizer in homogenization buffer [50 mm Tris, pH 7.5, 100 mm KCl, 12 mm MgCl2, 1% Nonidet P-40, 1 mm DTT, 200 U/ml Rnasin (Promega, catalog #N2115), 1 mg/ml heparin, 100 g/ml cycloheximide (Sigma, catalog #C7698), and protease inhibitor mixture (Sigma, catalog #P8340)]. Samples were then centrifuged at 10,000 × g for 10 min at 4°C. Mouse (monoclonal) anti-HA antibody (Covance, MMS-101R-200; RRID:AB_10064220; 10 μl) was added to the supernatant (800 μl) and the mixture was rotated for 4 h in a cold room, followed by protein G magnetic beads and (Invitrogen, catalog #100.04D) incubation overnight at 4°C while rotating. The next day, samples were placed in a magnetic rack on ice, and the supernatant was removed. Pellets were washed three times for 5 min each in high salt buffer (50 mm Tris, pH 7.5, 300 mm KCl, 12 mm MgCl2, 1% Nonidet P-40, 1 mm DTT, 100 g/ml cycloheximide). Total RNA was prepared according to the manufacturer's instructions using a RNeasy Micro plus kit (Qiagen) and quantified with a NanoDrop 1000 spectrophotometer (Thermo Fisher Scientific).
RNA quality was assessed by a Bioanalyzer (Agilent Technologies), and our samples reached an averaged RIN number of 9.8. For library preparation, 150–300 ng total RNA per sample were used. Ribosomal RNA contamination was eliminated using the Ribo-Zero rRNA Removal Kit (Illumina), and sequencing libraries were constructed using the ScriptSeq v2 RNA-Seq Library Preparation Kit (Illumina). The samples were pair-end sequenced at 100 bp using an Illumina HiSeq 2000 sequencer at the University of Miami Hussman Institute for Human Genomics Core Facility. Sequencing data is publicly available at the National Center for Biotechnology Information through Gene Expression Omnibus accession number GSE84737.
Quantitative real-time PCR.
To validate our RNA sequencing results, we performed quantitative real-time PCR (qPCR) analysis of select genes using total RNA from injury site homogenates rather than RiboTag polyribosomal mRNA. This was mainly due to technical issues including insufficient RNA generated using RiboTag to run validation qPCRs on many genes and the complexity of generating another set of RiboTag chimeric mice solely for validation purposes. At 3 and 7 d after SCI, C57BL/6 mice were anesthetized and transcardially perfused with cold PBS. A 4 mm segment of the spinal cord centered at the injury site was dissected and homogenized, and total RNA was isolated according to manufacturer's instructions using a RNeasy Micro plus kit (Qiagen). RNA quantity was measured using a NanoDrop 1000 (Thermo Fisher Scientific). RNA was treated with DNAase (AMPD1, Sigma-Aldrich) and reverse transcribed to cDNA using the Advantage RT-for-PCR Kit (ClonTech). Transcript levels were assessed by one-step qPCR assays using SYBR Green PCR Master Mix (Applied Biosystems) in a 7300 Real Time PCR machine (Applied Biosystems). Fold enrichment was calculated using the ΔΔCt method with normalization to GAPDH. Primer sequences are listed in Table 1.
Table 1.
List of qPCR primers used to validate candidate genes
| Gene | Forward Primer (5′–3′) | Reverse Primer (5′–3′) |
|---|---|---|
| Abca1 | ACCCGCTGTATGGAAGGAAA | AGGGGTTCTTCATGGTCCAG |
| Abcg1 | ACCTACCACAACCCAGCAGACTTT | GGTGCCAAAGAAACGGGTTCACAT |
| Acadm | GCGAGCAGAAATGAAACTCC | AGCTCTAGACGAAGCCACGA |
| Acox3 | GCGAACGACAGCTCACTATG | CGTCTGGCATGTACAGTTGG |
| Arg1 | TTTTTCCAGCAGACCAGCTT | CATGAGCTCCAACGGAAAGT |
| Cd5l | GTTGGGACCTCGTTAGAAGA | CGAAGATATGCAAGTGACCC |
| Cd11b | TACCGGAAGGATTCAGCAAG | TAGCAGGAAAGATGGGATGG |
| Cd36 | GAACCACTGCTTTCAAAAACTGG | TGCTGTTCTTTGCCACGTCA |
| Gapdh | GACCTCAACTACATGGTCTACA | ACTCCACGACATACTCAGCAC |
| Gfap | TCTCCTCCTCCAGCGATTCAAC | TGTGGATTTGGAGAGAAA |
| Hadhb | ACTCGGACCAACATATGCTACT | GCTAAAATCTGGCCTGAGAAGG |
| Lpl | GGGAGTTTGGCTCCAGAGTTT | TGTGTCTTCAGGGGTCCTTAG |
| Nse | GCAACTGTTTGCTGCTCAAG | TCAGCAATGAACGTGTCCTC |
| Plp | GTTCCAGAGGCCAACATCAAGCTC | AGCCATACAACAGTCAGGGCATAG |
| Pparg | CTGTGGACCTCTCCGTGATG | CCATTGGGTCAGCTCTTGTG |
Bioinformatic analysis.
RNA-seq read alignment, transcript assembly, and differential expression analysis were performed on the “Pegasus” high-performance computing cluster of the University of Miami. The Tuxedo Suite tools (Bowtie, TopHat, Cufflinks, and CummeRbund software packages; RRID:SCR_013194) were used to analyze and visualize the raw sequencing data as described previously (Lerch et al., 2012; Trapnell et al., 2012). Raw reads were first aligned to the mouse reference genome (assembly mm10) while supplying with a reference genome annotation (combined Ensembl, RefSeq, and University of California, Santa Cruz annotations) using Tophat software, version 2.0.12 (Kim et al., 2013). Aligned reads were then assembled into transcripts with the same reference genome annotation by the Cufflinks software, version 2.2. Next, gene expression levels were estimated and normalized by Cuffquant, version 2.2.1, and input into Cuffdiff version 2.2.1 (Trapnell et al., 2013) for gene differential expression analysis. Cuffdiff determines p values based on the square root of the Jensen–Shannon divergence between the relative abundance of transcripts. False discovery rate (FDR)-adjusted p values were calculated with the Benjamini–Hochberg method. We considered transcripts as differentially expressed (DE) if the FDR-adjusted p value was <0.05
We generated a master list of macrophage-specific genes by combining all genes represented in at least one of the following publicly available RNA sequencing data sets from isolated macrophages: Helft et al. (2012) (GEO GSE38838, FACS-purified alveolar macrophages); Hickman et al. (2013) (PRJNA219501, FACS-purified peritoneal macrophages); Melo et al. (2013) (SRP011061, cultured bone marrow-derived macrophages); Devaud et al. (2014) (GSE56904, FACS-purified renal macrophages). We then filtered our data set against the above gene list and eliminated the genes in our data set that were not in the master gene list since they were most likely due to contamination from other cell types during our enrichment procedure.
The gene set enrichment analysis (GSEA; RRID:SCR_003199; Subramanian et al., 2005) was performed using our entire data set of Fragments Per Kilobase of transcript per Million mapped reads (FPKM) values and custom gene sets created from published microarray data. The following software parameters were used: 10000 gene permutations, “3 d” versus “7 d” as the phenotypes, and t test as the ranking metrics. For single-sample GSEA (ssGSEA) analysis, 19 different macrophage types were obtained from nine publicly available data sets. A list of DE genes between each treatment group and the listed control was obtained, using criteria of log2FC ≥ 1.5 and an adjusted p value of <0.05, using the limma Bioconductor R package (Smyth, 2005). We then used the ssGSEA method (Barbie et al., 2009) to assess the activation of the DE genes from each treatment group in both day 3 and day 7 macrophages independently. This method was implemented using the gene set variation analysis Bioconductor R package (Hänzelmann et al., 2013).
Results
Isolation of macrophage-specific mRNA after spinal cord injury
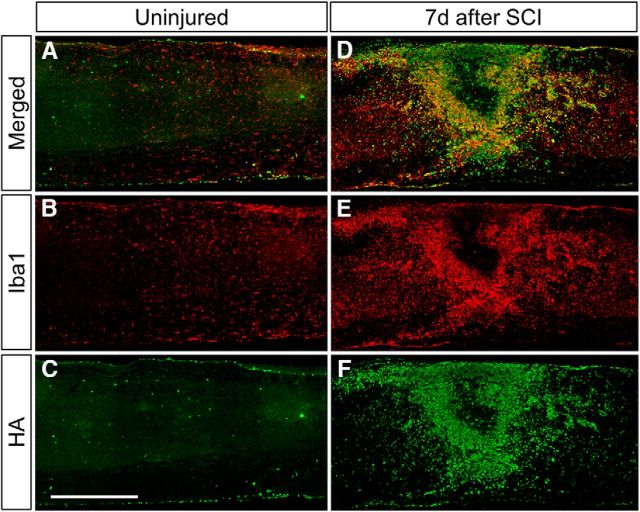
To generate a genetic mouse model that can be used to obtain mRNA specifically from macrophages at the spinal cord injury site, we bred lysM-Cre mice to Rpl22(HA)fl/fl mice to generate lysMRpl22(HA) mice in which hemagglutinin-tagged ribosomal protein L22 (Rpl22) is expressed specifically in myeloid cells. The uninjured spinal cord of lysMRpl22(HA) mice contained very little HA expression, most likely because lysM-Cre mice preferentially label macrophages over microglia (Fig. 1A–C; Zhu et al., 2015a). One week after SCI, the injury site is filled with Iba1+ macrophages that express HA (Fig. 1D–F), demonstrating the expected recombination and expression pattern in lysMRpl22(HA) mice after SCI.
Figure 1.
Isolation of macrophage-specific mRNA from the spinal cord injury site. A–C, In uninjured spinal cord, hemagglutinin (green) is expressed in a minor population of Iba1+ microglia and dendritic cells (red). D–F, At 7 d after SCI, HA is expressed in the majority of myeloid cells at the injury core. Immunohistochemistry was performed on lysMRpl22(HA) mice. All images are sagittal sections of the midthoracic spinal cord. Scale bar, 500 μm. n = 3 biological replicates per group.
To distinguish between microglia and hematogenous macrophages present at the injury site, we performed bone marrow transplantation using lysMRpl22(HA) mice as the donor (carrying the CD45.2 allele) and C57BL/6 WT mice (carrying the CD45.1 allele) as the recipient to generate lysMRpl22(HA)→WT chimeric mice in which only the hematogenous myeloid cells express HA-tagged Rpl22. A chimerism efficiency of 80–90% was achieved as determined by the CD45.1 to CD45.2 ratio in blood samples using flow cytometry. At 7 d after SCI, injury site tissue from lysMRpl22(HA)→WT mice was dissected, homogenized, and immunoprecipitated using a monoclonal antibody against HA, followed by RNA extraction. As expected, the RNA was enriched for CD11b (macrophages, ∼8-fold) and depleted of neuron specific enolase (neurons, ∼6-fold), glial fibrillary acidic protein (astrocytes, ∼15-fold), and proteolipid protein (oligodendrocytes, ∼28-fold; enrichment data not shown).
Since lysM-Cre mice do not label all macrophages (Clausen et al., 1999; Abram et al., 2014), we wanted to determine whether the recombined macrophages were representative of the general macrophage population. Thus, we used lysMtdTom mice (lysM-Cre mice bred to Rosa26-tdTomato mice) as the donor and C57BL/6 mice as the recipient to generate lysMtdTom→WT chimeric mice in which only bone marrow-derived myeloid cells express tdTomato. At 7 and 14 d after SCI in lysMtdTom→WT mice, injury sites were processed for flow cytometry, and the general macrophage population (CD11b+CD45hi cells) was compared to recombined macrophages (CD11b+tdTomato+ cells; Fig. 2A,B). Approximately 49% of the total macrophage population was tdTomato+, suggesting that we obtained RNA from ∼49% of the macrophages using the RiboTag method. Ly6G+ cells comprised <3% of these cell populations, indicating that CD11b+CD45hi cells were mostly macrophages rather than neutrophils at 7 and 14 d, consistent with previous reports (Stirling and Yong, 2008; Beck et al., 2010). At 7 d after SCI, the antigenic profile using Ly6C, CD11c, CD86, CD206, and CD43 between these two groups was similar (Fig. 2C–H). At 14 d, the two populations continued to be mostly similar with the exception of Ly6C that was expressed by a slightly larger percentage of tdTomato+ cells (24 vs 15%; Fig. 2I–T). Taken together, our data indicate that the lysM-Cre expressing macrophages at the injury site are representative of infiltrating macrophages in general.
Figure 2.
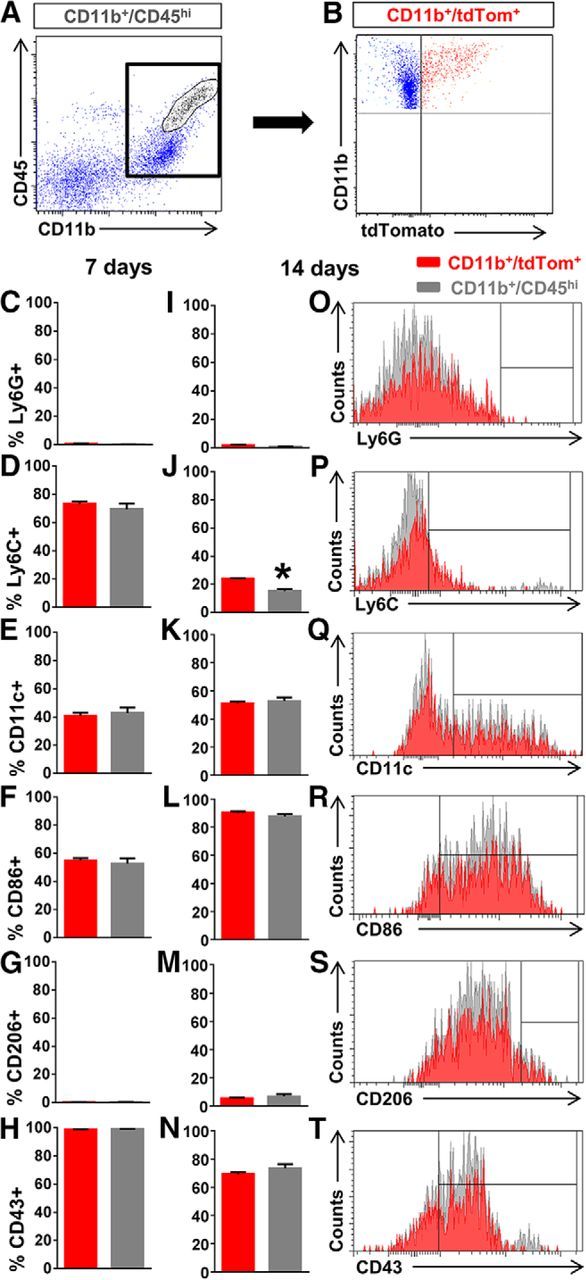
Myeloid cells labeled in lysM-Cre mice are representative of the general macrophage population after SCI. A–T, We performed SCI on lysMtdTom→WT chimera mice and assessed the injury site using flow cytometry to determine whether macrophages labeled in lysMtdTom mice (CD11b+/tdTom+; B, red) were representative of the general macrophage population in the injury site (CD11b+/CD45hi; A, circled region). Except for a slight difference in Ly6C+ cells at 14 d after SCI, macrophages labeled in lysMtdTom (red bars) mice did not differ from the general macrophage population (gray bars) in the percentage of cells that expressed Ly6G, CD11c, CD86, CD206, or CD43 at both 7 and 14 d after SCI. *p < 0.05 using Student's unpaired t test. n = 5 biological replicates per group. Error bars indicate SEM.
Sequencing macrophage-specific mRNA after spinal cord injury
Sequencing of RNA from macrophages in the SCI site of lysMRpl22(HA)→WT chimeric mice at 3 and 7 d after SCI resulted in ∼80–107 million 100 bp pair-end reads, of which 84–90% aligned with the mouse reference genome (Fig. 3A). A total of 15,565 genes were identified with 5597 being differentially expressed between 3 and 7 d macrophages as determined by Cuffdiff (FDR-adjusted p < 0.05). Principal component analysis of all genes in each biological sample revealed separation between the 3 and 7 d experimental conditions (Fig. 3B). Hierarchical clustering and heat map of differentially expressed genes showed similar results (Fig. 3C). We compared the top 20% most highly expressed genes between 7 and 3 d. Of the 2416 genes, 1725 genes were common to both time points, whereas 367 genes were unique to 3 d and 324 genes were to 7 d macrophages (Fig. 3D). Interestingly, ctss, ctsd, ctsb, apoe, psap, and gpnmb were expressed only at 3 d and were not detected at 7 d (Fig. 3E), even though many genes highly expressed in 7 d macrophages were also detected at low levels in 3 d macrophages (Fig. 3F). ctss, ctsd, and ctsb (cathepsins family members) and psap (prosaposin) are lysosomal hydrolases involved in degradation of proteins and glycosphingolipids. Apoe encodes apolipoprotein E, which is a secreted protein that plays important roles in lipid metabolism. Gpnmb (also known as osteoactivin) is a phagocytic protein and an inflammatory mediator that is upregulated during monocyte-to-macrophage differentiation (Ripoll et al., 2007; Li et al., 2010). This unique gene expression profile suggests that macrophages have started to clear tissue debris from the injury site upon their arrival at 3 d after SCI. Of the top differentially expressed genes between 3 and 7 d macrophages, cxcl3, myl1, cacna1 g, tcap, and des were the highest at 3 d, and rpgrip1, serpinb1c, cd5l, msrb2, and cxcr1 were the highest at 7 d (Fig. 4).
Figure 3.
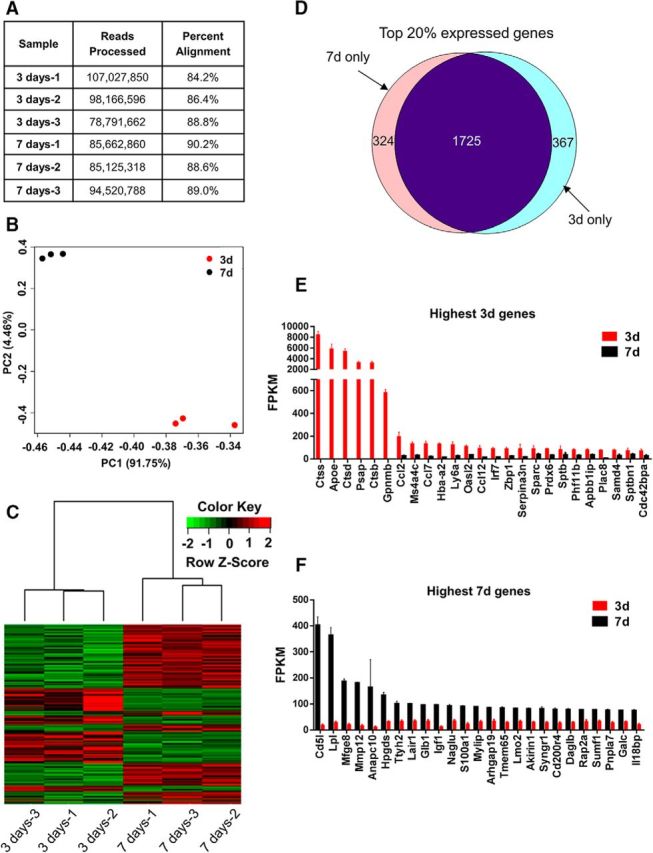
Macrophages at 3 and 7 d after SCI display distinct clustering and different expression of highly enriched genes. A, The 3 d (n = 3) and 7 d (n = 3) samples showed a range of 80–107 million 100 base pair sequence reads with 84–90% alignment. B, C, Both principal component analysis of all genes (B) and hierarchical clustering of differentially expressed genes (C) showed small intragroup differences and distinct separation of the 3 d and 7 d macrophage data sets. D, Venn diagram displaying the number of same or different genes from the top 20% of the highest expressed genes (2416 genes with highest FPKM values) in 3 and 7 d macrophages. From the top 20% expressed genes represented in D, the 25 genes with the highest FPKM values are listed in E and F. n is the number of biological replicates. Error bars indicate SEM.
Figure 4.
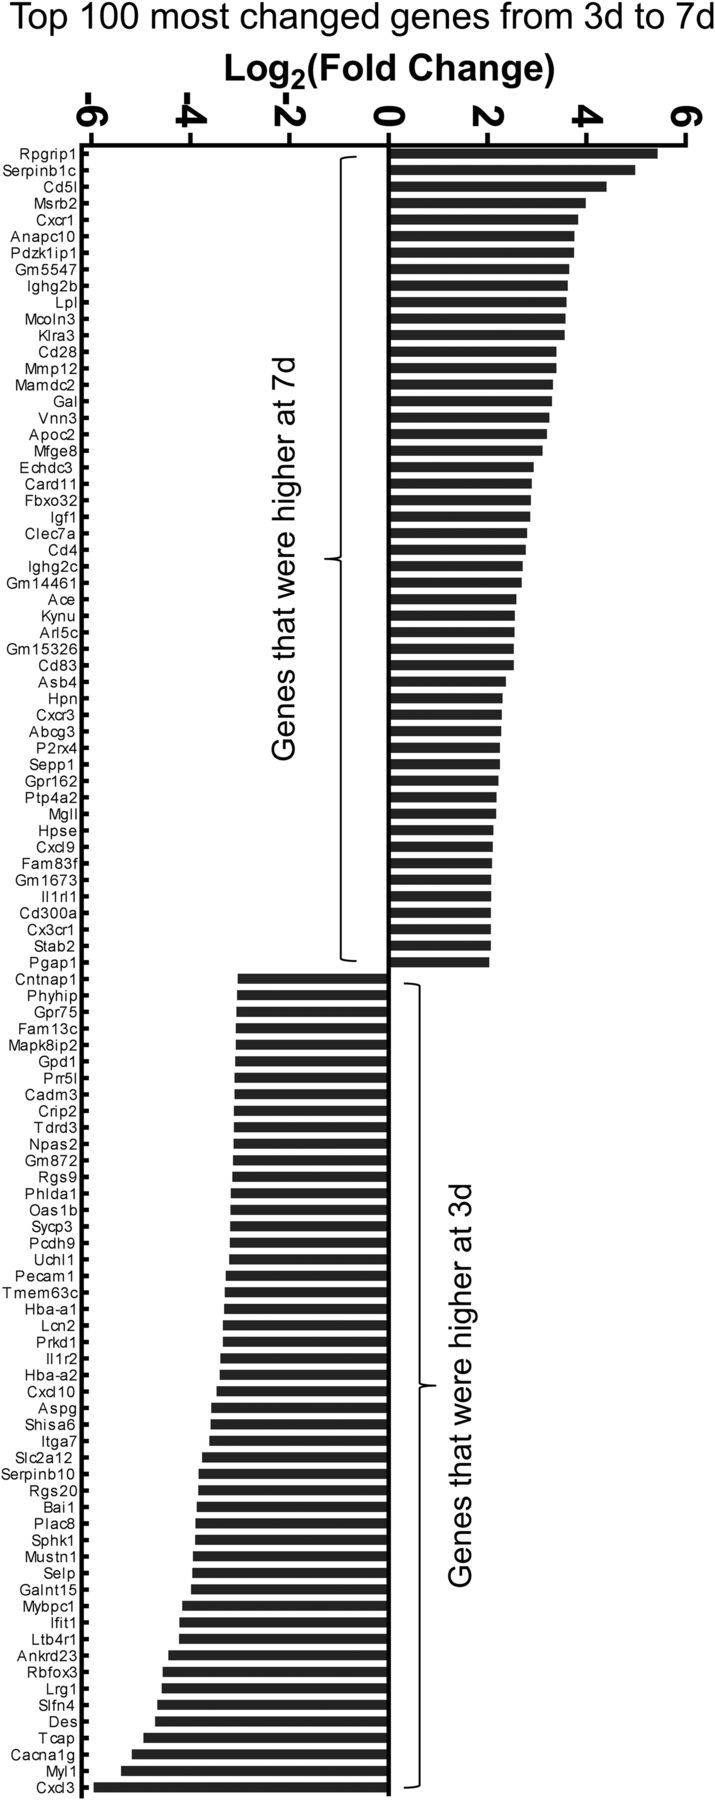
The most differentially expressed genes between macrophages at 3 and 7 d after SCI. A rank order list of 100 genes that were expressed higher in 7 or 3 d macrophages is shown. Note that although ctss, ctsd, ctsb, apoe, psap, and gpnmb are also very highly expressed at 3 d, they are not included in the graph because their differential expression could not be mathematically calculated (results in infinity).
Macrophage transcriptional profile shifts from cell migration and cytokine signaling to lipid catabolism from 3 to 7 d after SCI
To identify the major biological processes that are altered between 3 and 7 d macrophages, we performed gene ontology (GO) enrichment analysis on the differentially expressed genes between the two groups using the DAVID bioinformatics tool (Huang da et al., 2009). While a diverse range of biological processes were revealed at 3 d after SCI, many of the most significantly enriched biological processes such as migratory behavior, cell and biological adhesion, taxis and chemotaxis, and leukocyte migration pertained to macrophage migration (Fig. 5A). Kyoto Encyclopedia of Genes and Genomes (KEGG) pathway analysis revealed cytokine-cytokine receptor interaction and chemokine signaling pathway as the two most enriched pathways (Fig. 5B). Consistent with cytokine/chemokine signaling, plasma membrane and extracellular space were the most enriched cellular components (Fig. 5C). Since cell migration was identified as the most prominent feature of macrophages at 3 d, we extracted genes that are associated with the GO terms related to cell migration. Manual annotation of the genes broadly categorized them into “cytokines and receptors” and “adhesion molecules” (Fig. 5D,E). The most enriched chemokines/cytokines included cxcl3 and ctgf (connective tissue growth factor), whereas the most enriched cytokine receptor was tnfrsf19 (also known as TROY; Fig. 5D). Whereas this enrichment reflects differences between 3 and 7 d macrophages, in terms of expression in FPKM values, ccl2, ccl7, and ccl12 were the highest expressed chemokines (Fig. 3E). Consistent with macrophage migration, other notable pathways included cell adhesion molecules and calcium signaling (Fig. 5B). The most enriched adhesion molecule was selp (P-selectin), and the most enriched member of the cadherin family was pcdh9 (protocadherin 9; Fig. 5E). Both selectins and cadherins are calcium-dependent cell adhesion molecules, and the most enriched calcium channel was cacna1g, which is the primary pore-forming subunit of voltage dependent calcium channels (Fig. 5E). Taken together, enriched genes in 3 d macrophages are consistent with interaction of macrophages with the extracellular environment as they migrate in response to chemokines expressed at the injury site.
Figure 5.
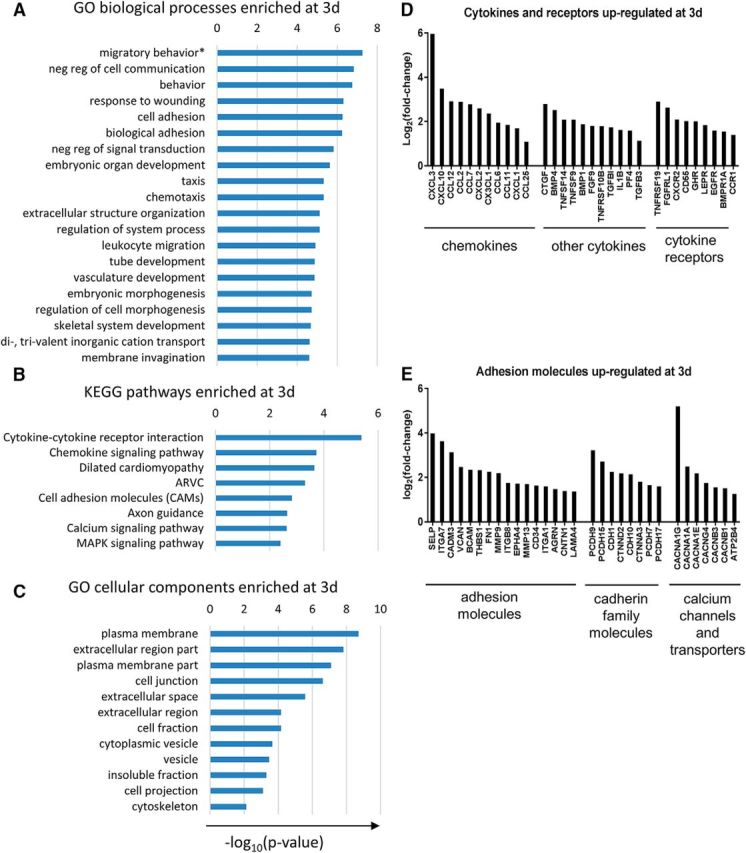
GO analysis shows enrichment of genes related to cell migration and cytokine signaling in 3 d macrophages. A, B, Many of the enriched biological processes are related to cell migration (A), while cytokine signaling represent the top two enriched pathways (B). C, Consistent with cell migration in response to cytokine signaling, many of the enriched cellular components are related to the cell membrane and extracellular matrix. D, E, Top differentially expressed genes (compared to 7 d) that are related to cytokine signaling (D) or cell adhesion (E). ARVC, Arrhythmogenic right ventricular cardiomyopathy. Differentially expressed genes (fold change > 2, FDR-adjusted p < 0.05) were analyzed using the DAVID bioinformatics tools with the following statistical testing cutoffs: p (Expression Analysis Systematic Explorer [EASE] score) < 0.05; FDR < 0.1; percentage of genes involved in a given term, >1%. *Migratory behavior refers to the GO term “locomotory behavior” (GO:0007626). “Migratory behavior” was used instead to avoid confusion with locomotor recovery after SCI.
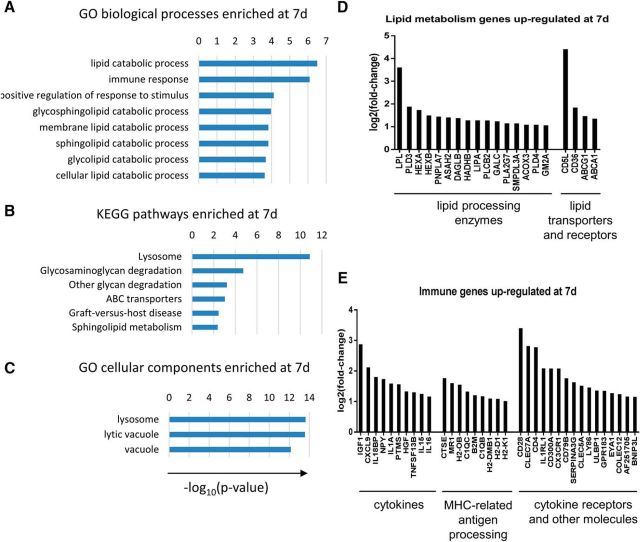
Whereas the list of biological processes enriched at 3 d was diverse, enriched biological processes in 7 d macrophages almost entirely pertained to lipid catabolism, including glycosphingolipid, sphingolipid, and glycolipid catabolism (Fig. 6A). KEGG pathway analysis showed lysosome as the most significantly enriched pathway in 7 d macrophages (Fig. 6B), whereas cellular component analysis revealed enrichment of genes associated with lysosome, lytic vacuole, and vacuole (Fig. 6C). The most enriched lipid processing enzyme was lpl (lipoprotein lipase), and the most enriched lipid transporter/receptor was cd36, which is a class B scavenger receptor for oxidized low-density lipoprotein (Fig. 6D). In terms of gene expression in FPKM values, cd5l and lpl were the two highest expressed genes in 7 d macrophages (Fig. 3F). Cd5l (also known as Apoptosis Inhibitor of Macrophages, or AIM) is also a mediator of lipid metabolism and a known ligand of CD36 (for review, see Sanjurjo et al., 2015). In addition to lipid catabolic processes, immune response was also an enriched biological process (Fig. 6A). Igf1 (insulin-like growth factor) was the most enriched cytokine/growth factor, while ctse (cathepsin E) was the most enriched MHC-related antigen processing gene (Fig. 6E).
Figure 6.
A, GO analysis shows enrichment of genes related to lipid catabolism and immune response in 7 d macrophages. Most of the enriched biological processes are related to lipid catabolism with some representation of immune response processes. B, C, Enrichment of lipid catabolic processes is consistent with enrichment of lysosome pathway (B) as well as lysosomal cellular components (C). D, E, Top differentially expressed genes (compared to 3 d) that are related to lipid metabolism processes (D) or immune response processes (E). Differentially expressed genes (fold change > 2, FDR-adjusted p < 0.05) were analyzed using the DAVID bioinformatics tools with the following statistical testing cutoffs: p (EASE score) < 0.05; FDR < 0.1; percentage of genes involved in a given term, >1%.
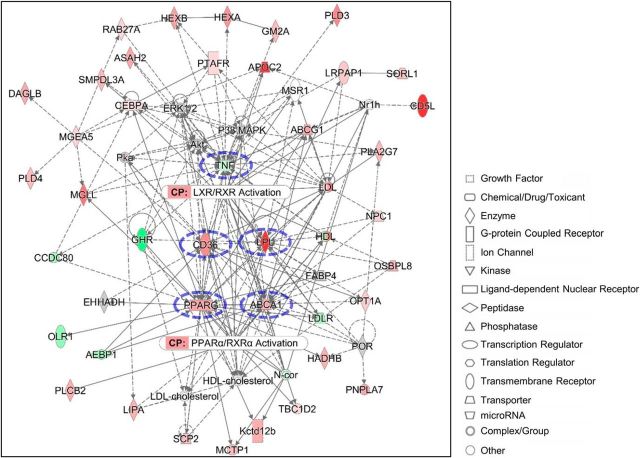
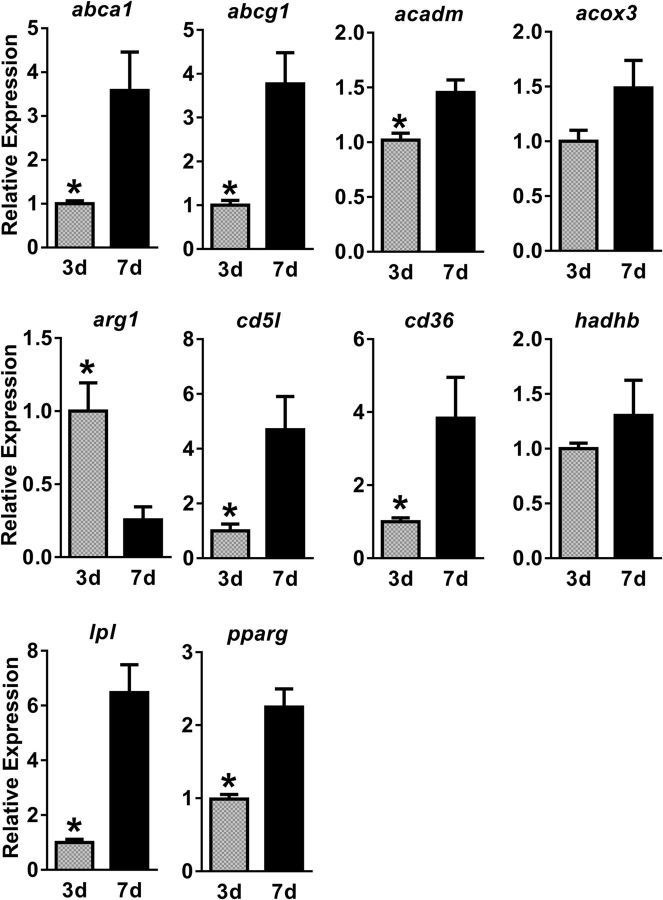
Using the genes associated with lipid catabolism in our gene ontology analysis (Fig. 6), we used ingenuity pathway analysis (IPA) to assemble a protein interaction network (Fig. 7). IPA identified five molecules as network hubs: TNF, CD36, LPL, PPARγ, and ABCA1. While tnf expression was decreased in 7 d macrophages, expression of the other four hub genes was increased. These four genes were validated in total RNA from injury site homogenate using qPCR (Fig. 8). Based on these network interactions, IPA identified Liver X Receptor/Retinoid X Receptor (LXR/RXR) and Peroxisome Proliferator-Activated Receptor alpha (PPARα/RXRα) as two canonical pathways that are activated in 7 d macrophages. Nuclear receptors LXR and PPAR form obligate heterodimers with RXR to regulate fatty acid synthesis and degradation, respectively (Nagy et al., 2012). Taken together, our data suggest that the most significant change in macrophage function from 3 to 7 d after SCI is increased lipid catabolism with nuclear receptors LXR, PPAR, and RXR as their major regulators.
Figure 7.
Pathway analysis identifies canonical lipid metabolism pathways with distinct network hubs. Molecular network generated by ingenuity pathway analysis using 7 d macrophage genes represented in lipid catabolism GO biological processes. Direct interactions are represented by continuous lines, while indirect interactions are represented by dashed lines. The color intensity of a molecule indicates the degree of increased (red) or decreased (green) enrichment of the gene compared to 3 d macrophages. Other colors indicate the presence (gray) or absence (white) of a given gene in the data set. The network forms hubs around cd36, lpl, pparg, abca1, and tnf (blue dotted circles). LXR/RXR and PPARα/RXRα canonical pathways (CPs) are the most highly enriched pathways identified by the network analysis.
Figure 8.
qPCR validation of select differentially expressed genes in 3 and 7 d macrophages. Total RNA isolated from the entire injury site at 3 or 7 d after SCI in C57BL/6 wild-type mice. Values are normalized to average 3 d expression levels. Error bars indicate SEM. *p < 0.05 compared to 7 d (unpaired two-tailed Student's t test). n = 5 per group (biological replicates).
Macrophages at 7 d after SCI resemble foam cells
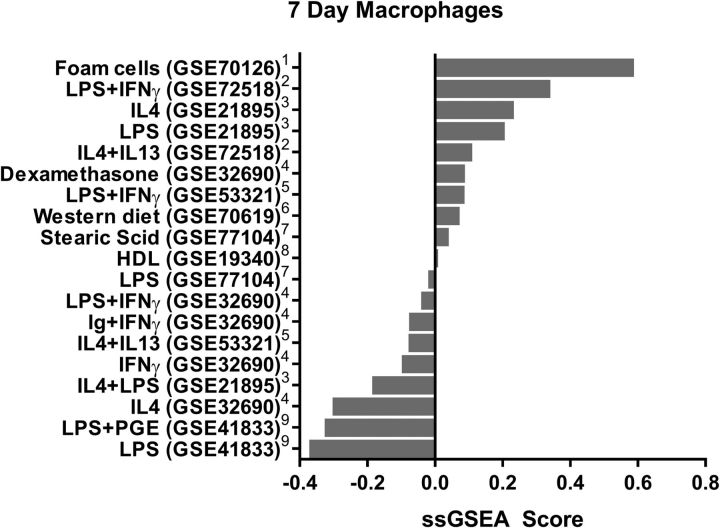
The predominance of lipid catabolic pathways suggested that 7 d macrophages were foam cells, which are specialized macrophages characterized by overexpression of the LXR/RXR pathway, the presence of lipid droplets, and commonly found in atherosclerotic plaques (Thomas et al., 2015). Thus, we performed gene set enrichment analysis (GSEA) to compare our data set with a previously published transcriptomic microarray data set that focused specifically on peritoneal foam cells in mice fed high-cholesterol and high-fat diet (Spann et al., 2012). Foam cell and non–foam cell signature gene sets were created by combining genes upregulated at least 1.5-fold in foam (210 genes) or non-foam (614 genes) cells, respectively. Both signature gene sets were then overlaid with our entire set of genes for enrichment analysis. Most notably, non–foam cell genes were highly overrepresented in 3 d macrophage genes, while foam cell genes were overrepresented in 7 d macrophage genes (Fig. 9A,B). Our GSEA data were consistent with histological evidence showing the absence of lipid droplets at 3 d after SCI (Fig. 9C–E) and their presence in macrophages at 7 d after SCI (Fig. 9F–H). We also performed ssGSEA analysis to compare our 7 d data sets to 19 other macrophage treatment conditions (Fig. 10), including another foam cell data set from an independent study (Thomas et al., 2015). When 7 d macrophages were compared to all other macrophage phenotypes, foam cells displayed the highest ssGSEA score (Fig. 10). Taken together, our data show that macrophages most resemble foam cells by 7 d after SCI.
Figure 9.
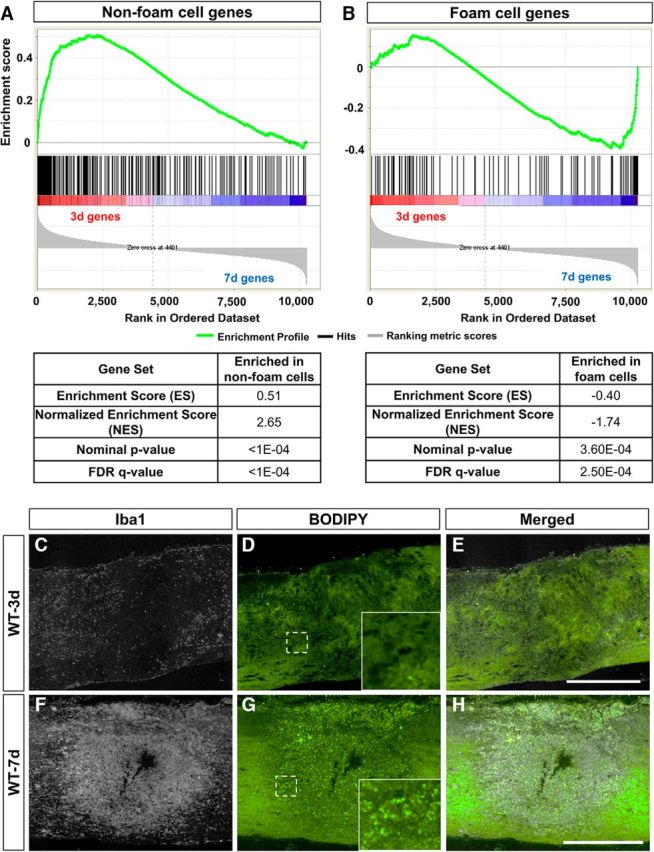
Foam cell genes are enriched in 7 d macrophages. GSEA comparing all genes in our data set to previously published data set on non-foam cells (614 genes) and foam cells (210 genes; Spann et al., 2012) is shown. A–H, Non–foam cell genes were overrepresented in our 3 d macrophages (A), while foam cell genes were overrepresented in our 7 d macrophages (B). This was consistent with the absence of macrophage (Iba1) lipid droplets (BODIPY; green) at 3 d (C–E; n = 7) and their presence at 7 d after SCI (F–H; n = 7). Each black vertical line in A and B represents a macrophage gene in our data set and shows a gene's relative location in the ranking list generated according to FPKM values. Statistical tests are shown in Table 1. Insets in D and G are magnified images of dotted regions. Bright green dots are lipid droplets stained by BODIPY. Scale bars: 500 μm. n indicates the number of biological replicates.
Figure 10.
ssGSEA analysis comparing 7 d macrophages to other macrophage treatment conditions. The 7 d macrophages are most enriched in foam cell genes compared to genes expressed under 18 other macrophage treatment conditions. The foam cell data set here is from Thomas et al. (2015), whereas the data set in Figure 9 is from Spann et al. (2012). 1Thomas et al. (2015); 2Haribhai et al. (2016); 3El Chartouni and Rehli (2010); 4Riquelme et al. (2013); 5Li et al. (2015); 6Goo et al. (2016); 7Robblee et al. (2016); 8Suzuki et al. (2010); 9MacKenzie et al. (2013).
Genetic deletion of CD36 reduces lipid droplets in macrophages and improves recovery
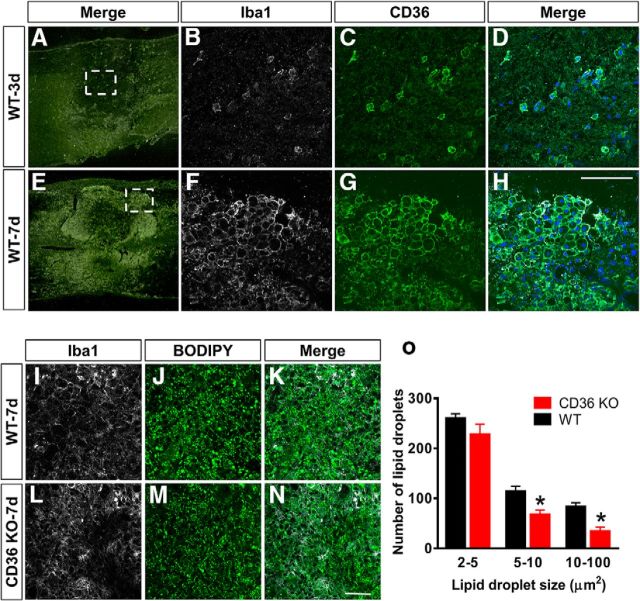
Upon identification of the lipoprotein receptor, CD36, as a network hub (Fig. 7), we sought to confirm its expression in macrophages using immunohistochemistry. At 3 d after SCI when macrophages start to infiltrate the injury site, there was barely detectable CD36 expression (Fig. 11A–D). However, at 7 d after SCI when macrophage infiltration has reached its peak, there was significantly greater CD36 expression that co-localized with macrophages (Fig. 11E–H). There was no detectable CD36 staining in CD36 knock-out mice, confirming the specificity of our CD36 antibody (data not shown). Notably, this increased expression of CD36-positive macrophages between 3 and 7 d corresponded to the increased presence of foam cells after SCI (Fig. 9C–H). Thus, our immunohistochemical data confirm the increased gene expression of the lipoprotein receptor CD36 in macrophages at 7 d after SCI.
Figure 11.
CD36 expression is increased in 7 d macrophages and regulates the amount of lipid droplets in macrophages after SCI. A–O, While there is very little CD36 expression at 3 d after SCI (A–D; n = 7), it is significantly increased in macrophages (Iba1) at 7 d (E–H; n = 7). Genetic deletion of CD36 (L–O; n = 5) resulted in less large lipid droplets (BODIPY) compared to WTs (I–K, O; n = 6). B–D represent dotted region in A, and F–H represent dotted region in E. *p < 0.05 compared to WT (two-way ANOVA with Bonferroni posttest). DAPI in blue in D, H. Scale bars: 50 μm. Error bars indicate SEM. n is the number of biological replicates.
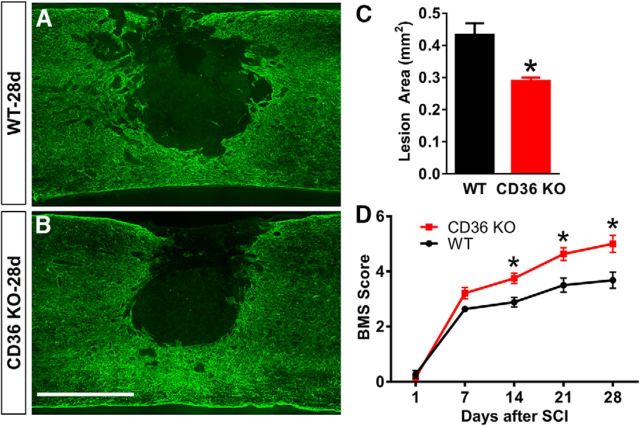
To investigate the contribution of CD36 to lipid catabolism, we assessed formation of lipid droplets, a hallmark of foam cells, after SCI in CD36 knock-out mice. At 3 d after SCI, neither wild-type nor CD36 knock-out mice had significant amount of lipid droplet accumulation as detected by BODIPY staining of the injury site (data now shown). However, at 7 d after SCI, the entire injury site was filled with lipid droplets present inside macrophages (Fig. 11I–K). CD36 KO mice displayed significantly decreased number of large lipid droplets in macrophages at the injury site (Fig. 11L–N,O), suggesting that the amount of lipid droplets in macrophages is mediated, at least in part, by the lipoprotein receptor, CD36, after SCI. This decrease in lipid droplets in CD36 KO mice was associated with smaller lesion area (defined as GFAP-negative area; Fig. 12A–C) as well as improved open field locomotion at 4 weeks after SCI (Fig. 12D). Thus, our data suggest that decreased lipid uptake through CD36 could be a novel therapeutic target after SCI.
Figure 12.
Genetic deletion of CD36 results in smaller lesion size and improved locomotion. A–C, At 4 weeks after SCI, CD36 KOs display significantly smaller lesion size (B, C, n = 10) compared to WT mice (A, C, n = 9). Lesion size was defined as GFAP-negative area (GFAP in green; A, B). D, CD36 KO mice (n = 10) also displayed better locomotor recovery compared to WT mice (n = 9) as assessed by the BMS score. Data are combined results from two independent experiments that each showed similar results. *p < 0.05 compared to WT (C, unpaired two-tailed Student's t test; D, two-way repeated measures ANOVA with Bonferroni posttest). Scale bar, 500 μm. Error bars indicate SEM. n is the number of biological replicates.
Discussion
Macrophages have multiple functions after CNS injury, but the temporal occurrence of these functions and the molecular pathways involved are not fully understood. While transcriptomic analysis could provide important new insights, a major hurdle in the field has been distinguishing macrophage-specific functions from overlapping functions in other cell types at the injury site. Therefore, in this study, we used the RiboTag method to obtain the first macrophage-specific transcriptional profile after SCI. Our data indicate that macrophages acutely after SCI (3 d) are enriched in genes associated with cell migration and cytokine signaling. However, at a later time point (7 d), the gene expression profile transitions to reflect lipid catabolism as their primary function through the LXR/RXR and PPAR/RXR canonical pathways, including CD36, which may be a potential lipid uptake mechanism that can be therapeutically targeted to improve function after SCI.
While a major advantage of using the RiboTag method is that it provides a snapshot of the macrophage gene expression profile while still in its native environment, a technical obstacle is minimizing contamination from other cell types. For example, since proliferating astrocytes compose such a large fraction of the cells at the injury site, gfap was a highly expressed gene in our raw data set even though we achieved about a 15-fold depletion of gfap through the RiboTag method (data not shown). Therefore, we combined the gene list from four publicly available macrophage transcriptome data sets to generate a “master” macrophage gene list and reasoned that any gene not on this list was most likely not expressed by macrophages (see Materials and Methods). This filtering process eliminated 3864 potentially contaminating genes such as gfap, olig1, mog, tubb3 (β-tubulin III), and snap25 (encodes the t-SNARE protein, synaptosomal-associated protein, 25 kDa). Surprisingly, even after the filtering process, some T-cell genes such as cd28 and cd4 were still present in our data set (Fig. 6E). However, the actual FPKM value of cd4 was very low (FPKM = 0.2 at 3 d and 1.6 at 7 d). The fact that cd3-related genes (cd3d, cd3e, and cd247) were not detected in our data set even before filtering indicates that contamination from T cell RNA in our sample is highly unlikely. In addition, since cd28 was found in two of the four data sets used as filters (Melo et al., 2013; Devaud et al., 2014), it is possible that cd28 is commonly expressed by macrophages, although the functional significance of this gene in macrophages is unclear. It should also be noted that the filtered genes in our data set might have been from ingestion of RNA during phagocytosis of other cell types at the injury site. However, we do not think this is likely because our RiboTag approach isolated translating mRNA bound to polyribosomes, and we do not typically detect genes such as gfap at the protein level in macrophages.
Another technical issue to consider is that the lysM-Cre mouse line labels cells of myeloid origin, which include monocytes, tissue macrophages (including microglia), dendritic cells, and neutrophils. Our use of bone marrow chimeras eliminated microglia from our profiled cell population, and previous study has indicated that dendritic cells are absent from the injury site until 56 d after SCI in mice (Sroga et al., 2003). Neutrophil infiltration reaches its peak at 1–2 d after injury, and then declines significantly over the next couple of days, and previous studies have shown that neutrophils are only a minor population of myeloid cells by 7 d after SCI (Donnelly and Popovich, 2008; Stirling and Yong, 2008; Saiwai et al., 2010). However, since 3 d represents the tail end of neutrophil infiltration and the beginning of macrophage infiltration, neutrophils may represent a significant percentage of myeloid cells at this earlier time point. Thus, although macrophages are the major myeloid cell population represented in our data set, we cannot rule out contributions from neutrophils. In addition, macrophages profiled in our study represent a spectrum of polarization states that ranges from proinflammatory to anti-inflammatory. Therefore, our data set is an average of gene expression from many different types of macrophages. Future studies on macrophage subpopulations or single-cell analysis would be extremely informative, and as the first macrophage-specific transcriptional profile after SCI, our data set will provide a contextual framework for these studies.
Unlike macrophage behavior at 3 d after SCI, there were no obvious biological processes, such as inflammation, phagocytosis, angiogenesis, wound healing, and matrix remodeling, among many others, that could have been considered as the major macrophage function at 7 d. This is partly because 7 d after SCI is a very dynamic and complex period characterized by a peak number of macrophages, fibroblasts, astrocytes, and NG2 cells remodeling the tissue cytoarchitecture to form the scar, which attains its mature state starting around 14 d after SCI (Donnelly and Popovich, 2008; Barnabé-Heider et al., 2010; Soderblom et al., 2013). In the context of SCI, most previous studies have focused on the contribution of macrophage to inflammation and cell death, scar formation, and/or axon regeneration. Thus, it was somewhat surprising to find lipid catabolic processes and their corresponding molecular pathways as the predominant macrophage function in 7 d macrophages. This was true whether we considered enriched genes (most differentially expressed) or actual gene expression levels using FPKM values, giving confidence to our interpretation. In addition, when we compared our data set to those from 19 other macrophage treatment conditions (Fig. 10) using ssGSEA analysis, we discovered that macrophages after SCI are most similar to foam cells than any other subtypes. Importantly, enrichment of foam cell genes in SCI macrophages was confirmed using foam cell data sets from two independent studies (Spann et al., 2012; Thomas et al., 2015).
Pathway analysis of lipid catabolism-related genes revealed several hubs, including TNF, CD36, LPL, PPARG, and ABCA1. A recent study reported that in a model of diabetic kidney disease, increased TNF levels can lead to reduced ABCA1 expression that results in reduced cholesterol efflux in podocytes (Pedigo et al., 2016). This suggests that our finding of increased ABCA1 expression may be causally related to decreased TNF expression (Fig. 7). In addition, these hubs have been long known to be important mediators of atherosclerosis, raising the possibility that druggable targets that have been identified in atherosclerosis and other lipid-related disorders may be applicable to SCI. For example, use of statins has been reported to have neuroprotective effects in several SCI studies (Pannu et al., 2007; Holmberg et al., 2008; Gao et al., 2016), and recent review articles highlight PPARs as potential therapeutic targets after SCI (Mandrekar-Colucci et al., 2013; Gensel and Zhang, 2015). In addition, treatment with cyclodextrin can promote axonal growth after SCI (Mar et al., 2016). Although most studies seem to support the use of lipid-targeting compounds after SCI, it is important to note that there have also been studies that did not find any beneficial effects (Lee et al., 2010; Mann et al., 2010; Almad et al., 2011), pointing to potential hurdles of using small compounds targeting lipid pathways in preclinical SCI studies.
Previous studies have shown that genetic deletion of CD36 is protective against atherosclerotic lesion development (Febbraio et al., 2000). Accordingly, our data also showed improved histopathology and locomotion after SCI in CD36 KO mice. The fact that these improvements were associated with decreased lipid droplets in macrophages at the injury site is consistent with the function of CD36 as lipoprotein receptors, but the precise mechanism requires further investigation since CD36 has multiple ligands such as collagen and thrombospondin and is expressed on several cell types including endothelial cells. In fact, previous study has reported that genetic deletion of CD36 can reduce endoplasmic reticulum stress response and apoptosis and lead to improved functional recovery after SCI (Myers et al., 2014), suggesting that the improved function in CD36 KO mice may be through several pathways. However, our study is the first to propose the beneficial effects of targeting CD36 in the context of lipid metabolism in macrophages after SCI.
Our study provides the first in vivo cell type–specific macrophage transcriptional profiling after SCI. Our data highlight lipid catabolic processes as the predominant macrophage function at 7 d after SCI and provide insight into the molecular mechanisms that regulate lipid catabolism as well as identify potential novel therapeutic targets in these pathways. What effect lipid catabolic processes have on macrophages' ability to regulate wound healing, scar formation, and/or axon regeneration remains to be addressed in the future.
Footnotes
This work was supported by NINDS Grants R01NS081040 and R21NS082835, U.S. Army Grant W81XWH131007715, the Miami Project to Cure Paralysis, the Buoniconti Fund, and the Walter G. Ross Foundation and NINDS Grant R01HD057632 (V.P.L. and D.M.). We thank Yadira Salgueiro and Shaffiat Karmally for technical assistance and animal care. We thank Michelle Trojanowsky for assistance with qRT-PCR.
The authors declare no competing financial interests.
References
- Abram CL, Roberge GL, Hu Y, Lowell CA (2014) Comparative analysis of the efficiency and specificity of myeloid-Cre deleting strains using ROSA-EYFP reporter mice. J Immunol Methods 408:89–100. 10.1016/j.jim.2014.05.009 [DOI] [PMC free article] [PubMed] [Google Scholar]
- Almad A, Lash AT, Wei P, Lovett-Racke AE, McTigue DM (2011) The PPAR alpha agonist gemfibrozil is an ineffective treatment for spinal cord injured mice. Exp Neurol 232:309–317. 10.1016/j.expneurol.2011.09.023 [DOI] [PMC free article] [PubMed] [Google Scholar]
- Amit I, Winter DR, Jung S (2016) The role of the local environment and epigenetics in shaping macrophage identity and their effect on tissue homeostasis. Nat Immunol 17:18–25. 10.1038/ni.3325 [DOI] [PubMed] [Google Scholar]
- Arenkiel BR, Hasegawa H, Yi JJ, Larsen RS, Wallace ML, Philpot BD, Wang F, Ehlers MD (2011) Activity-induced remodeling of olfactory bulb microcircuits revealed by monosynaptic tracing. PLoS One 6:e29423. 10.1371/journal.pone.0029423 [DOI] [PMC free article] [PubMed] [Google Scholar]
- Barbie DA, Tamayo P, Boehm JS, Kim SY, Moody SE, Dunn IF, Schinzel AC, Sandy P, Meylan E, Scholl C, Fröhling S, Chan EM, Sos ML, Michel K, Mermel C, Silver SJ, Weir BA, Reiling JH, Sheng Q, Gupta PB, et al. (2009) Systematic RNA interference reveals that oncogenic KRAS-driven cancers require TBK1. Nature 462:108–112. 10.1038/nature08460 [DOI] [PMC free article] [PubMed] [Google Scholar]
- Barnabé-Heider F, Göritz C, Sabelström H, Takebayashi H, Pfrieger FW, Meletis K, Frisén J (2010) Origin of new glial cells in intact and injured adult spinal cord. Cell Stem Cell 7:470–482. 10.1016/j.stem.2010.07.014 [DOI] [PubMed] [Google Scholar]
- Basso DM, Fisher LC, Anderson AJ, Jakeman LB, McTigue DM, Popovich PG (2006) Basso Mouse Scale for locomotion detects differences in recovery after spinal cord injury in five common mouse strains. J Neurotrauma 23:635–659. 10.1089/neu.2006.23.635 [DOI] [PubMed] [Google Scholar]
- Beck KD, Nguyen HX, Galvan MD, Salazar DL, Woodruff TM, Anderson AJ (2010) Quantitative analysis of cellular inflammation after traumatic spinal cord injury: evidence for a multiphasic inflammatory response in the acute to chronic environment. Brain 133:433–447. 10.1093/brain/awp322 [DOI] [PMC free article] [PubMed] [Google Scholar]
- Bogie JF, Jorissen W, Mailleux J, Nijland PG, Zelcer N, Vanmierlo T, Van Horssen J, Stinissen P, Hellings N, Hendriks JJ (2013) Myelin alters the inflammatory phenotype of macrophages by activating PPARs. Acta Neuropathol Commun 1:43. 10.1186/2051-5960-1-43 [DOI] [PMC free article] [PubMed] [Google Scholar]
- Clausen BE, Burkhardt C, Reith W, Renkawitz R, Forster I (1999) Conditional gene targeting in macrophages and granulocytes using LysMcre mice. Transgenet Res 8:265–277. 10.1023/A:1008942828960 [DOI] [PubMed] [Google Scholar]
- Devaud C, Yong CS, John LB, Westwood JA, Duong CP, House CM, Denoyer D, Li J, Darcy PK, Kershaw MH (2014) Foxp3 expression in macrophages associated with RENCA tumors in mice. PLoS One 9:e108670. 10.1371/journal.pone.0108670 [DOI] [PMC free article] [PubMed] [Google Scholar]
- Donnelly DJ, Popovich PG (2008) Inflammation and its role in neuroprotection, axonal regeneration and functional recovery after spinal cord injury. Exp Neurol 209:378–388. 10.1016/j.expneurol.2007.06.009 [DOI] [PMC free article] [PubMed] [Google Scholar]
- El Chartouni C, Rehli M (2010) Comprehensive analysis of TLR4-induced transcriptional responses in interleukin 4-primed mouse macrophages. Immunobiology 215:780–787. 10.1016/j.imbio.2010.05.032 [DOI] [PubMed] [Google Scholar]
- Evans TA, Barkauskas DS, Myers JT, Hare EG, You JQ, Ransohoff RM, Huang AY, Silver J (2014) High-resolution intravital imaging reveals that blood-derived macrophages but not resident microglia facilitate secondary axonal dieback in traumatic spinal cord injury. Exp Neurol 254:109–120. 10.1016/j.expneurol.2014.01.013 [DOI] [PMC free article] [PubMed] [Google Scholar]
- Febbraio M, Podrez EA, Smith JD, Hajjar DP, Hazen SL, Hoff HF, Sharma K, Silverstein RL (2000) Targeted disruption of the class B scavenger receptor CD36 protects against atherosclerotic lesion development in mice. J Clin Invest 105:1049–1056. 10.1172/JCI9259 [DOI] [PMC free article] [PubMed] [Google Scholar]
- Gao K, Shen Z, Yuan Y, Han D, Song C, Guo Y, Mei X (2016) Simvastatin inhibits neural cell apoptosis and promotes locomotor recovery via activation of Wnt/beta-catenin signaling pathway after spinal cord injury. J Neurochem 138:139–149. 10.1111/jnc.13382 [DOI] [PMC free article] [PubMed] [Google Scholar]
- Gensel JC, Zhang B (2015) Macrophage activation and its role in repair and pathology after spinal cord injury. Brain Res 1619:1–11. 10.1016/j.brainres.2014.12.045 [DOI] [PubMed] [Google Scholar]
- Gensel JC, Nakamura S, Guan Z, van Rooijen N, Ankeny DP, Popovich PG (2009) Macrophages promote axon regeneration with concurrent neurotoxicity. J Neurosci 29:3956–3968. 10.1523/JNEUROSCI.3992-08.2009 [DOI] [PMC free article] [PubMed] [Google Scholar]
- Goo YH, Yechoor VK, Paul A (2016) Transcriptional profiling of foam cells in response to hypercholesterolemia. Genom Data 9:37–39. 10.1016/j.gdata.2016.06.006 [DOI] [PMC free article] [PubMed] [Google Scholar]
- Greenhalgh AD, David S (2014) Differences in the phagocytic response of microglia and peripheral macrophages after spinal cord injury and its effects on cell death. J Neurosci 34:6316–6322. 10.1523/JNEUROSCI.4912-13.2014 [DOI] [PMC free article] [PubMed] [Google Scholar]
- Hänzelmann S, Castelo R, Guinney J (2013) GSVA: gene set variation analysis for microarray and RNA-seq data. BMC Bioinformatics 14:7. 10.1186/1471-2105-14-7 [DOI] [PMC free article] [PubMed] [Google Scholar]
- Haribhai D, Ziegelbauer J, Jia S, Upchurch K, Yan K, Schmitt EG, Salzman NH, Simpson P, Hessner MJ, Chatila TA, Williams CB (2016) Alternatively activated macrophages boost induced regulatory T and Th17 cell responses during immunotherapy for colitis. J Immunol 196:3305–3317. 10.4049/jimmunol.1501956 [DOI] [PMC free article] [PubMed] [Google Scholar]
- Heiman M, Schaefer A, Gong S, Peterson JD, Day M, Ramsey KE, Suárez-Fariñas M, Schwarz C, Stephan DA, Surmeier DJ, Greengard P, Heintz N (2008) A translational profiling approach for the molecular characterization of CNS cell types. Cell 135:738–748. 10.1016/j.cell.2008.10.028 [DOI] [PMC free article] [PubMed] [Google Scholar]
- Helft J, Manicassamy B, Guermonprez P, Hashimoto D, Silvin A, Agudo J, Brown BD, Schmolke M, Miller JC, Leboeuf M, Murphy KM, García-Sastre A, Merad M (2012) Cross-presenting CD103+ dendritic cells are protected from influenza virus infection. J Clin Invest 122:4037–4047. 10.1172/JCI60659 [DOI] [PMC free article] [PubMed] [Google Scholar]
- Hickman SE, Kingery ND, Ohsumi TK, Borowsky ML, Wang LC, Means TK, El Khoury J (2013) The microglial sensome revealed by direct RNA sequencing. Nat Neurosci 16:1896–1905. 10.1038/nn.3554 [DOI] [PMC free article] [PubMed] [Google Scholar]
- Holmberg E, Zhang SX, Sarmiere PD, Kluge BR, White JT, Doolen S (2008) Statins decrease chondroitin sulfate proteoglycan expression and acute astrocyte activation in central nervous system injury. Exp Neurol 214:78–86. 10.1016/j.expneurol.2008.07.020 [DOI] [PubMed] [Google Scholar]
- Huang da W, Sherman BT, Lempicki RA (2009) Systematic and integrative analysis of large gene lists using DAVID bioinformatics resources. Nat Protoc 4:44–57. [DOI] [PubMed] [Google Scholar]
- Kigerl KA, Gensel JC, Ankeny DP, Alexander JK, Donnelly DJ, Popovich PG (2009) Identification of two distinct macrophage subsets with divergent effects causing either neurotoxicity or regeneration in the injured mouse spinal cord. J Neurosci 29:13435–13444. 10.1523/JNEUROSCI.3257-09.2009 [DOI] [PMC free article] [PubMed] [Google Scholar]
- Kim D, Pertea G, Trapnell C, Pimentel H, Kelley R, Salzberg SL (2013) TopHat2: accurate alignment of transcriptomes in the presence of insertions, deletions and gene fusions. Genome Biol 14:R36. 10.1186/gb-2013-14-4-r36 [DOI] [PMC free article] [PubMed] [Google Scholar]
- Kroner A, Greenhalgh AD, Zarruk JG, Passos Dos Santos R, Gaestel M, David S (2014) TNF and increased intracellular iron alter macrophage polarization to a detrimental M1 phenotype in the injured spinal cord. Neuron 83:1098–1116. 10.1016/j.neuron.2014.07.027 [DOI] [PubMed] [Google Scholar]
- Kwon MJ, Shin HY, Cui Y, Kim H, Thi AH, Choi JY, Kim EY, Hwang DH, Kim BG (2015) CCL2 mediates neuron-macrophage interactions to drive proregenerative macrophage activation following preconditioning injury. J Neurosci 35:15934–15947. 10.1523/JNEUROSCI.1924-15.2015 [DOI] [PMC free article] [PubMed] [Google Scholar]
- Lee DH, Lee JK (2013) Animal models of axon regeneration after spinal cord injury. Neurosci Bull 29:436–444. 10.1007/s12264-013-1365-4 [DOI] [PMC free article] [PubMed] [Google Scholar]
- Lee JH, Tigchelaar S, Liu J, Stammers AM, Streijger F, Tetzlaff W, Kwon BK (2010) Lack of neuroprotective effects of simvastatin and minocycline in a model of cervical spinal cord injury. Exp Neurol 225:219–230. 10.1016/j.expneurol.2010.06.018 [DOI] [PubMed] [Google Scholar]
- Lerch JK, Kuo F, Motti D, Morris R, Bixby JL, Lemmon VP (2012) Isoform diversity and regulation in peripheral and central neurons revealed through RNA-Seq. PLoS One 7:e30417. 10.1371/journal.pone.0030417 [DOI] [PMC free article] [PubMed] [Google Scholar]
- Li B, Castano AP, Hudson TE, Nowlin BT, Lin SL, Bonventre JV, Swanson KD, Duffield JS (2010) The melanoma-associated transmembrane glycoprotein Gpnmb controls trafficking of cellular debris for degradation and is essential for tissue repair. FASEB J 24:4767–4781. 10.1096/fj.10-154757 [DOI] [PMC free article] [PubMed] [Google Scholar]
- Li L, Ng DS, Mah WC, Almeida FF, Rahmat SA, Rao VK, Leow SC, Laudisi F, Peh MT, Goh AM, Lim JS, Wright GD, Mortellaro A, Taneja R, Ginhoux F, Lee CG, Moore PK, Lane DP (2015) A unique role for p53 in the regulation of M2 macrophage polarization. Cell Death Differ 22:1081–1093. 10.1038/cdd.2014.212 [DOI] [PMC free article] [PubMed] [Google Scholar]
- Lööv C, Hillered L, Ebendal T, Erlandsson A (2012) Engulfing astrocytes protect neurons from contact-induced apoptosis following injury. PLoS One 7:e33090. 10.1371/journal.pone.0033090 [DOI] [PMC free article] [PubMed] [Google Scholar]
- MacKenzie KF, Clark K, Naqvi S, McGuire VA, Nöehren G, Kristariyanto Y, van den Bosch M, Mudaliar M, McCarthy PC, Pattison MJ, Pedrioli PG, Barton GJ, Toth R, Prescott A, Arthur JS (2013) PGE(2) induces macrophage IL-10 production and a regulatory-like phenotype via a protein kinase A-SIK-CRTC3 pathway. J Immunol 190:565–577. 10.4049/jimmunol.1202462 [DOI] [PMC free article] [PubMed] [Google Scholar]
- Mandrekar-Colucci S, Sauerbeck A, Popovich PG, McTigue DM (2013) PPAR agonists as therapeutics for CNS trauma and neurological diseases. ASN Neuro 5:e00129. [DOI] [PMC free article] [PubMed] [Google Scholar]
- Mann CM, Lee JH, Hillyer J, Stammers AM, Tetzlaff W, Kwon BK (2010) Lack of robust neurologic benefits with simvastatin or atorvastatin treatment after acute thoracic spinal cord contusion injury. Exp Neurol 221:285–295. 10.1016/j.expneurol.2009.11.006 [DOI] [PubMed] [Google Scholar]
- Mar FM, da Silva TF, Morgado MM, Rodrigues LG, Rodrigues D, Pereira MI, Marques A, Sousa VF, Coentro J, Sá-Miranda C, Sousa MM, Brites P (2016) Myelin lipids inhibit axon regeneration following spinal cord injury: a novel perspective for therapy. Mol Neurobiol 53:1052–1064. 10.1007/s12035-014-9072-3 [DOI] [PubMed] [Google Scholar]
- Melo MB, Nguyen QP, Cordeiro C, Hassan MA, Yang N, McKell R, Rosowski EE, Julien L, Butty V, Dardé ML, Ajzenberg D, Fitzgerald K, Young LH, Saeij JP (2013) Transcriptional analysis of murine macrophages infected with different Toxoplasma strains identifies novel regulation of host signaling pathways. PLoS Pathog 9:e1003779. 10.1371/journal.ppat.1003779 [DOI] [PMC free article] [PubMed] [Google Scholar]
- Miron VE, Boyd A, Zhao JW, Yuen TJ, Ruckh JM, Shadrach JL, van Wijngaarden P, Wagers AJ, Williams A, Franklin RJ, ffrench-Constant C (2013) M2 microglia and macrophages drive oligodendrocyte differentiation during CNS remyelination. Nat Neurosci 16:1211–1218. 10.1038/nn.3469 [DOI] [PMC free article] [PubMed] [Google Scholar]
- Myers SA, Andres KR, Hagg T, Whittemore SR (2014) CD36 deletion improves recovery from spinal cord injury. Exp Neurol 256:25–38. 10.1016/j.expneurol.2014.03.016 [DOI] [PMC free article] [PubMed] [Google Scholar]
- Nagy L, Szanto A, Szatmari I, Széles L (2012) Nuclear hormone receptors enable macrophages and dendritic cells to sense their lipid environment and shape their immune response. Physiol Rev 92:739–789. 10.1152/physrev.00004.2011 [DOI] [PubMed] [Google Scholar]
- Pannu R, Christie DK, Barbosa E, Singh I, Singh AK (2007) Post-trauma Lipitor treatment prevents endothelial dysfunction, facilitates neuroprotection, and promotes locomotor recovery following spinal cord injury. J Neurochem 101:182–200. [DOI] [PubMed] [Google Scholar]
- Pedigo CE, Ducasa GM, Leclercq F, Sloan A, Mitrofanova A, Hashmi T, Molina-David J, Ge M, Lassenius MI, Forsblom C, Lehto M, Groop PH, Kretzler M, Eddy S, Martini S, Reich H, Wahl P, Ghiggeri G, Faul C, Burke GW 3rd, et al. (2016) Local TNF causes NFATc1-dependent cholesterol-mediated podocyte injury. J Clin Invest 126:3336–3350. [DOI] [PMC free article] [PubMed] [Google Scholar]
- Popovich PG, Guan Z, Wei P, Huitinga I, van Rooijen N, Stokes BT (1999) Depletion of hematogenous macrophages promotes partial hindlimb recovery and neuroanatomical repair after experimental spinal cord injury. Exp Neurol 158:351–365. 10.1006/exnr.1999.7118 [DOI] [PubMed] [Google Scholar]
- Ripoll VM, Irvine KM, Ravasi T, Sweet MJ, Hume DA (2007) Gpnmb is induced in macrophages by IFN-gamma and lipopolysaccharide and acts as a feedback regulator of proinflammatory responses. J Immunol 178:6557–6566. 10.4049/jimmunol.178.10.6557 [DOI] [PubMed] [Google Scholar]
- Riquelme P, Tomiuk S, Kammler A, Fändrich F, Schlitt HJ, Geissler EK, Hutchinson JA (2013) IFN-gamma-induced iNOS expression in mouse regulatory macrophages prolongs allograft survival in fully immunocompetent recipients. Mol Ther 21:409–422. 10.1038/mt.2012.168 [DOI] [PMC free article] [PubMed] [Google Scholar]
- Robblee MM, Kim CC, Porter Abate J, Valdearcos M, Sandlund KL, Shenoy MK, Volmer R, Iwawaki T, Koliwad SK (2016) Saturated fatty acids engage an IRE1alpha-dependent pathway to activate the NLRP3 inflammasome in myeloid cells. Cell reports 14:2611–2623. 10.1016/j.celrep.2016.02.053 [DOI] [PMC free article] [PubMed] [Google Scholar]
- Saiwai H, Ohkawa Y, Yamada H, Kumamaru H, Harada A, Okano H, Yokomizo T, Iwamoto Y, Okada S (2010) The LTB4-BLT1 axis mediates neutrophil infiltration and secondary injury in experimental spinal cord injury. Am J Pathol 176:2352–2366. 10.2353/ajpath.2010.090839 [DOI] [PMC free article] [PubMed] [Google Scholar]
- Sanjurjo L, Amézaga N, Aran G, Naranjo-Gómez M, Arias L, Armengol C, Borràs FE, Sarrias MR (2015) The human CD5L/AIM-CD36 axis: A novel autophagy inducer in macrophages that modulates inflammatory responses. Autophagy 11:487–502. 10.1080/15548627.2015.1017183 [DOI] [PMC free article] [PubMed] [Google Scholar]
- Sanz E, Yang L, Su T, Morris DR, McKnight GS, Amieux PS (2009) Cell-type-specific isolation of ribosome-associated mRNA from complex tissues. Proc Natl Acad Sci U S A 106:13939–13944. 10.1073/pnas.0907143106 [DOI] [PMC free article] [PubMed] [Google Scholar]
- Schulz C, Massberg S (2014) Atherosclerosis–multiple pathways to lesional macrophages. Sci Transl Med 6:239ps2. [DOI] [PubMed] [Google Scholar]
- Smyth GK. (2005) Limma: linear models for microarray data. In: Bioinformatics and computational biology solutions using R and Bioconductor, pp 397–420. New York: Springer. [Google Scholar]
- Soderblom C, Luo X, Blumenthal E, Bray E, Lyapichev K, Ramos J, Krishnan V, Lai-Hsu C, Park KK, Tsoulfas P, Lee JK (2013) Perivascular fibroblasts form the fibrotic scar after contusive spinal cord injury. J Neurosci 33:13882–13887. 10.1523/JNEUROSCI.2524-13.2013 [DOI] [PMC free article] [PubMed] [Google Scholar]
- Sofroniew MV. (2015) Astrocyte barriers to neurotoxic inflammation. Nat Rev Neurosci 16:249–263. 10.1038/nrn3898 [DOI] [PMC free article] [PubMed] [Google Scholar]
- Spann NJ, Garmire LX, McDonald JG, Myers DS, Milne SB, Shibata N, Reichart D, Fox JN, Shaked I, Heudobler D, Raetz CR, Wang EW, Kelly SL, Sullards MC, Murphy RC, Merrill AH Jr, Brown HA, Dennis EA, Li AC, Ley K, et al. (2012) Regulated accumulation of desmosterol integrates macrophage lipid metabolism and inflammatory responses. Cell 151:138–152. 10.1016/j.cell.2012.06.054 [DOI] [PMC free article] [PubMed] [Google Scholar]
- Sroga JM, Jones TB, Kigerl KA, McGaughy VM, Popovich PG (2003) Rats and mice exhibit distinct inflammatory reactions after spinal cord injury. J Comp Neurol 462:223–240. 10.1002/cne.10736 [DOI] [PubMed] [Google Scholar]
- Stirling DP, Yong VW (2008) Dynamics of the inflammatory response after murine spinal cord injury revealed by flow cytometry. J Neurosci Res 86:1944–1958. 10.1002/jnr.21659 [DOI] [PubMed] [Google Scholar]
- Subramanian A, Tamayo P, Mootha VK, Mukherjee S, Ebert BL, Gillette MA, Paulovich A, Pomeroy SL, Golub TR, Lander ES, Mesirov JP (2005) Gene set enrichment analysis: a knowledge-based approach for interpreting genome-wide expression profiles. Proc Natl Acad Sci U S A 102:15545–15550. 10.1073/pnas.0506580102 [DOI] [PMC free article] [PubMed] [Google Scholar]
- Suzuki M, Pritchard DK, Becker L, Hoofnagle AN, Tanimura N, Bammler TK, Beyer RP, Bumgarner R, Vaisar T, de Beer MC, de Beer FC, Miyake K, Oram JF, Heinecke JW (2010) High-density lipoprotein suppresses the type I interferon response, a family of potent antiviral immunoregulators, in macrophages challenged with lipopolysaccharide. Circulation 122:1919–1927. 10.1161/CIRCULATIONAHA.110.961193 [DOI] [PMC free article] [PubMed] [Google Scholar]
- Thomas AC, Eijgelaar WJ, Daemen MJ, Newby AC (2015) Foam cell formation in vivo converts macrophages to a pro-fibrotic phenotype. PLoS One 10:e0128163. 10.1371/journal.pone.0128163 [DOI] [PMC free article] [PubMed] [Google Scholar]
- Trapnell C, Roberts A, Goff L, Pertea G, Kim D, Kelley DR, Pimentel H, Salzberg SL, Rinn JL, Pachter L (2012) Differential gene and transcript expression analysis of RNA-seq experiments with TopHat and Cufflinks. Nat Protoc 7:562–578. 10.1038/nprot.2012.016 [DOI] [PMC free article] [PubMed] [Google Scholar]
- Trapnell C, Hendrickson DG, Sauvageau M, Goff L, Rinn JL, Pachter L (2013) Differential analysis of gene regulation at transcript resolution with RNA-seq. Nat Biotech 31:46–53. [DOI] [PMC free article] [PubMed] [Google Scholar]
- Wang X, Cao K, Sun X, Chen Y, Duan Z, Sun L, Guo L, Bai P, Sun D, Fan J, He X, Young W, Ren Y (2015) Macrophages in spinal cord injury: phenotypic and functional change from exposure to myelin debris. Glia 63:635–651. 10.1002/glia.22774 [DOI] [PMC free article] [PubMed] [Google Scholar]
- Zhu Y, Soderblom C, Trojanowsky M, Lee DH, Lee JK (2015a) Fibronectin matrix assembly after spinal cord injury. J Neurotrauma 32:1158–1167. 10.1089/neu.2014.3703 [DOI] [PMC free article] [PubMed] [Google Scholar]
- Zhu Y, Soderblom C, Krishnan V, Ashbaugh J, Bethea JR, Lee JK (2015b) Hematogenous macrophage depletion reduces the fibrotic scar and increases axonal growth after spinal cord injury. Neurobiol Dis 74:114–125. 10.1016/j.nbd.2014.10.024 [DOI] [PMC free article] [PubMed] [Google Scholar]


