

Abstract
Cerebral blood flow (CBF) is controlled by arterial blood pressure, arterial CO2, arterial O2, and brain activity and is largely constant in the awake state. Although small changes in arterial CO2 are particularly potent to change CBF (1 mmHg variation in arterial CO2 changes CBF by 3%–4%), the coupling mechanism is incompletely understood. We tested the hypothesis that astrocytic prostaglandin E2 (PgE2) plays a key role for cerebrovascular CO2 reactivity, and that preserved synthesis of glutathione is essential for the full development of this response. We combined two-photon imaging microscopy in brain slices with in vivo work in rats and C57BL/6J mice to examine the hemodynamic responses to CO2 and somatosensory stimulation before and after inhibition of astrocytic glutathione and PgE2 synthesis. We demonstrate that hypercapnia (increased CO2) evokes an increase in astrocyte [Ca2+]i and stimulates COX-1 activity. The enzyme downstream of COX-1 that synthesizes PgE2 (microsomal prostaglandin E synthase-1) depends critically for its vasodilator activity on the level of glutathione in the brain. We show that, when glutathione levels are reduced, astrocyte calcium-evoked release of PgE2 is decreased and vasodilation triggered by increased astrocyte [Ca2+]i in vitro and by hypercapnia in vivo is inhibited. Astrocyte synthetic pathways, dependent on glutathione, are involved in cerebrovascular reactivity to CO2. Reductions in glutathione levels in aging, stroke, or schizophrenia could lead to dysfunctional regulation of CBF and subsequent neuronal damage.
SIGNIFICANCE STATEMENT Neuronal activity leads to the generation of CO2, which has previously been shown to evoke cerebral blood flow (CBF) increases via the release of the vasodilator PgE2. We demonstrate that hypercapnia (increased CO2) evokes increases in astrocyte calcium signaling, which in turn stimulates COX-1 activity and generates downstream PgE2 production. We demonstrate that astrocyte calcium-evoked production of the vasodilator PgE2 is critically dependent on brain levels of the antioxidant glutathione. These data suggest a novel role for astrocytes in the regulation of CO2-evoked CBF responses. Furthermore, these results suggest that depleted glutathione levels, which occur in aging and stroke, will give rise to dysfunctional CBF regulation and may result in subsequent neuronal damage.
Keywords: astrocyte, calcium, cerebral blood flow, glutathione, hypercapnia
Introduction
Astrocyte [Ca2+]i transients have been shown to directly alter diameters of cerebral arterioles in experiments using either direct astrocyte stimulation or calcium uncaging in astrocytes of juvenile (Zonta et al., 2003; Mulligan and MacVicar, 2004; Gordon et al., 2008), or adult animals (Takano et al., 2006). However, several laboratories have published contradictory evidence on whether, in adult animals, astrocyte [Ca2+]i signaling is evoked by synaptic activity leading to neurovascular coupling (Zonta et al., 2003; Petzold et al., 2008; Schulz et al., 2012; Lind et al., 2013; Otsu et al., 2015) or not (Nizar et al., 2013; Takata et al., 2013; Bonder and McCarthy, 2014). More recently, astrocyte [Ca2+]i was shown to modify basal arteriole tone in adult animals (Rosenegger et al., 2015). Therefore, it is still poorly understood when, how, and under what conditions, astrocyte [Ca2+]i signaling contributes to the regulation of cerebral blood flow (CBF).
In this work, we investigated the mechanisms underlying CBF responses to increased blood CO2 concentrations (hypercapnia) and the potential contribution of astrocytes to those CBF responses. Arterial CO2 has a potent effect on CBF, with a 1 mmHg variation eliciting a 3%–4% CBF change (Hauge et al., 1980). However, the mechanism coupling a change in CO2 to a change in CBF is incompletely understood. There are parallels between the vasoactive signals generated by astrocytes and those underlying hypercapnia-evoked CBF responses. Astrocytes have been shown to directly modify arteriole diameter when their intracellular [Ca2+]i increases, activating astrocytic phospholipase A2 (PLA2) (He et al., 2012) and thereby generating arachidonic acid (AA) and several vasoactive metabolites including PgE2, which causes vasodilation (Zonta et al., 2003; Takano et al., 2006; Gordon et al., 2008; Attwell et al., 2010). In addition to their roles in neurovascular coupling, both PgE2 (Wagerle and Mishra, 1988; Wagerle and Degiulio, 1994) and cyclooxygenase-1 (COX-1) activity (Niwa et al., 2001) are involved in increasing CBF during hypercapnia. We examined the potential link between astrocytes and increased CBF during hypercapnia because astrocytes express the enzymes that are involved in synthesizing PgE2 from AA during hypercapnia-induced CBF changes (Niwa et al., 2001). For example, mRNA for both COX-1 and microsomal prostaglandin E synthase-1 (mPgES-1) are reported in transcriptome studies to be highly expressed in astrocytes but not neurons (e.g., ptgs1, also known as COX-1, is 15-fold higher in astrocytes than in neurons) (Cahoy et al., 2008; Zhang et al., 2014). Astrocytes are immunoreactive for both the enzyme proteins COX-1 (Takano et al., 2006; Gordon et al., 2008) and mPgES-1 (see Fig. 3A and Tachikawa et al., 2012). mPgES-1, the form of prostaglandin E synthase expressed in astrocytes, requires the cofactor glutathione (GSH) (Jakobsson et al., 1999; Murakami et al., 2000) that is present in high levels in astrocytes (see Fig. 3B and Sun et al., 2006; Bragin et al., 2010; Robillard et al., 2011). We investigated whether hypercapnia can evoke an increase in astrocyte [Ca2+]i in vivo and, if so, whether this results in activation of a PgE2-mediated vasodilation. In doing so, we demonstrate a novel, GSH-dependent mechanism of CBF regulation, which involves astrocytes and the GSH-sensitive release of PgE2.
Figure 3.

Astrocytes express mPGES-1 and contain high levels of GSH. A, Immunohistochemistry showing astrocytic expression of GSH-dependent mPGES-1 in the CA3 of the hippocampus. Astrocyte marker, GFAP (red), mPGES-1 (green), and merge (yellow). Scale bar, 20 μm. B, MCB-loaded hippocampal-neocortical slices. Astrocytes (identified by SR101, red, white arrowheads) contain higher levels of GSH (as indicated by MCB staining, green) than neurons (white arrows). Merge (yellow). Scale bar, 20 μm.
Materials and Methods
Slice preparation
Four hundred μm hippocampal-neocortical slices were prepared from male and female juvenile (postnatal age 16–21 d) Sprague Dawley rats. Treatment of animals was approved by the University of British Columbia Animal Care and Use Committee. As previously described (Gordon et al., 2008), rats were anesthetized with halothane, decapitated, and the brains removed into ice-cold slicing solution containing the following (in mm): 2.5 KCl, 26 NaHCO3, 0.5 CaCl2, 10 MgSO4, 1.25 NaH2PO4, 10 glucose, 230 sucrose, saturated with 95% O2/5% CO2. The 400 μm transverse hemi-sections were incubated at 32°C-34°C in aCSF containing the following (in mm): 126 NaCl, 2.5 KCl, 26 NaHCO3, 2.0 CaCl2, 2.0 MgCl2, 1.25 NaH2PO4, 10 glucose, saturated with 95% O2/5% CO2 for 60 min. For experiments, slices were at 22°C-24°C, aCSF was saturated with 20% O2/5% CO2, balanced N2, and perfused at ∼2 ml/min. Healthy slices can be maintained in 20% O2, which provides a pO2 at the low end of the physiological range (Gordon et al., 2008). Astrocytes were loaded with the caged IP3 compound, NV-IP3/AM (5 μg/ml), and/or the Ca2+ indicator rhod-2/AM (10 μm, Invitrogen) as previously described (Mulligan and MacVicar, 2004; Gordon et al., 2008). Slices were loaded with monochlorobimane (MCB, Fluka) in the dark at room temperature for 30 min as previously described (Robillard et al., 2011).
Two-photon imaging and uncaging in acute brain slices
A two-photon laser-scanning microscope (Zeiss LSM510-Axioskop-2 fitted with a 40×-W/1.0 numerical aperture objective lens) coupled to a Chameleon ultra II Ti:sapphire laser (∼140 fs pulses 80 MHz, Coherent) provided excitation of rhod-2 and was used to uncage IP3. Images were acquired 50–100 μm below the slice surface. Rhod-2 fluorescence imaging and two-photon uncaging were performed using laser settings and emission filters as previously described (Gordon et al., 2008). MCB was excited at 780 nm and detected with a PMT at 512–562 nm as previously described (Robillard et al., 2011). Arterioles (defined as vessels with diameter >10 μm, surrounded by a visible layer of smooth muscle cells) were imaged by acquiring the transmitted laser light and using IR-DIC optics.
Glutathione and PgE2 measurements
Protocols in suppliers' instructions were followed for the PgE2 ELISA and glutathione assays. When measuring PgE2 release from acute brain slices, TTX (1 μm, Alamone Labs) was added to dampen neuronal activation. PgE2 release from acute brain slices was measured using a Specific Parameter PgE2 ELISA kit (R&D systems). Measurements of tissue glutathione levels were made using a specific total glutathione assay kit from either BioVision or Assay Designs.
Immunohistochemistry
Rats were anesthetized with halothane, given an intraperitoneal injection of urethane (0.5 ml of 30% urethane per 50 g body weight), and perfused with saline (0.9% NaCl in 0.1 m phosphate buffer) followed by 4% PFA (in 0.1 m PBS). The brain was extracted, postfixed (10% sucrose in 4% PFA) overnight, and cryoprotected (30% sucrose in PBS) overnight. Using a cryostat, 40 μm serial sections in the horizontal plane were collected throughout the brain. Free-floating sections were blocked with 10% normal goat serum (Jackson ImmunoResearch Laboratories) and 0.4% Triton X-100 in PBS for 1 h and incubated in PBS containing 0.1% Triton X-100 and primary antibodies against PgE2 synthase (anti-mPgES-1) (Olajide et al., 2014; Tuure et al., 2015) (Agrisera, catalog #AS03 031, 1:200) as well as an astrocyte phenotypic marker (anti-GFAP (Lathia et al., 2008) (Sigma, catalog #G3893, clone #G-A-5, 1:500) overnight at 4°C. Tissue was rinsed and incubated in AlexaFluor-488 goat anti-mouse and AlexaFluor-546 goat anti-rabbit secondary antibodies (Invitrogen: diluted 1:500 in PBS, 2.5% normal goat serum and 0.4% Triton X-100) for 1.5 h at room temperature. The tissue was rinsed, mounted onto slides, and coverslipped using Fluorsave mounting medium (Calbiochem). Images were acquired with an Olympus Fluoview FV1000 confocal microscope.
Drugs
trans-ACPD (tACPD), clonidine, norepinephrine (NE; Sigma), and PgE2 (Cayman Chemicals) were bath applied for 5–10 min. SC560 (Sigma) was preincubated for 30 min (Blanco et al., 2008) followed by bath application and buthionine sulfoximine (BSO; Sigma) was preincubated for 2.5 h (Sun et al., 2006) followed by bath application throughout the experiment. NV-IP3/AM was synthesized by G. Ellis-Davies.
Animals: in vivo blood flow measurements in rats
All procedures were approved by the University of Oxford Ethical Review Committee and complied with the requirements of the Animals (Scientific Procedures) Act, 1986, United Kingdom. Animals were housed in an animal housing facility in a 12 h alternating light:dark cycle with ad libitum access to food and water. Male Wistar rats were used (256–367 g).
Intracerebral injection
For surgical procedures, rats were anesthetized with 4% isoflurane and maintained at 1.5%–2% isoflurane in 30% O2 and 70% N2. Each rat was placed in a stereotaxic frame and the skull exposed. A burr hole was drilled at 1 mm caudal and 4.2 mm lateral to bregma, and the dura mater was finely dissected away to expose the cortex. Twenty μl of 80 mg/ml BSO (Pileblad and Magnusson, 1989) or 0.9% saline was infused by a microinfusion pump at a rate of 2 μl/min into the right whisker barrel cortex at a depth of 2.3 mm from the brain's surface. This dose of BSO has previously been shown to adequately reduce GSH within 24 h of administration (Pileblad and Magnusson, 1989), and we showed that BSO administered in this way could decrease GSH levels in the ipsilateral cortex by 45%, 24 h after injection (see Fig. 5C), and in the ipsilateral striatum by 31% (GSH measured in saline-treated: 0.61 ± 0.03 mM, BSO-treated: 0.42 ± 0.08 mM, p = 0.045, n = 7 per group, mean ± SEM). After the infusion, bone wax was placed over the burr hole and the wound was closed with 3–0 sutures. Animals recovered for 24 h before assessment of GSH levels (n = 7 per group) or evoked blood flow responses (n = 6–10 per group).
Figure 5.

CO2 evoked CBF responses in vivo are GSH dependent. A, Mean traces of local CBF response to hypercapnia, measured by laser speckle contrast imaging, in vehicle (DMSO)- (blue) and SC560- (red) injected animals. n = 7 rats for each group. Colored box represents time of CO2 application. Data shown as fractional change with baseline of 0 (baseline taken during 60 s prechallenge) and a pretreatment peak of 1 (black dotted line on graph). B, Mean AUC of CBF response to hypercapnia in the presence of vehicle (DMSO) or SC560 (normalized to pretreatment maxima for each animal). n = 7 rats for each group. C, Tissue GSH levels 24 h after injection of BSO or saline into the barrel cortex (n = 7 rats). D, Mean trace of local CBF response to hypercapnia, measured by laser Doppler flowmetry, in saline- (blue) and BSO- (red) injected rats. n = 6 rats in each group. E, Mean values of AUC of CBF response to hypercapnia. n = 6 rats in each group. F, G, Neural activity. Power in frequency bands. F, During baseline (Base) and in response to hypercapnia (HCN) for saline- (blue) and BSO- (red) treated animals. n = 3 rats. G, Hypercapnia (HCN)/baseline (Base). Treatment with BSO does not change the effect of hypercapnia on neural activity. n = 3 rats. Data are mean ± SEM. * p < 0.05.
Whisker pad stimulation and hypercapnia: in vivo blood flow measurements
At 24 h after BSO/saline treatment, animals had their left femoral artery cannulated for blood gas measurement and were tracheotomized and ventilated with 1.25% isoflurane in 30% O2 and 70% N2. A laser Doppler probe (Perimed) to monitor relative CBF was placed over the right whisker barrel cortex (where the intracerebral injection was made) and bipolar stimulating electrodes were placed in the left whisker pad. For some experiments, a local field potential (LFP) electrode for neuronal activity was also placed on the exposed cortex to monitor neuronal activity. All animals had a steady-state blood gas (Table 1) before beginning experiments.
Table 1.
Blood gases for BSO experiment (Nota Bene blood gases taken 24 h after drug but before hypercapnia and whisker stimulation experiments)a
| Treatment | pH | pCO2 (mmHg) | pO2 (mmHg) |
|---|---|---|---|
| Saline | 7.47 (0.01) | 34.5 (2.3) | 161 (4) |
| BSOb | 7.46 (0.01) | 35.8 (1.5) | 154 (7) |
aData are mean (SEM).
bAn inhibitor of γ-glutamylcysteine synthetase.
An electrical stimulus (10 Hz, 16 s duration, 1.6 mA, 0.3 ms pulsewidth, 60 s interstimulation interval) to evoke a blood flow response in the right whisker barrel cortex was performed for 10 trials per animal. Following this, animals were exposed to 10% CO2 for 30 s at 3 min intervals repeated 4 or 5 times to induce hypercapnic blood flow responses. Animals were killed and the cortex dissected for measurement of GSH levels.
For SC560 experiments, naive rats were anesthetized with isoflurane. Anesthesia was induced with 4% isoflurane and maintained during surgery with 2% isoflurane. During stimulation, anesthesia was maintained with 1.25% isoflurane. Isoflurane was carried in 30% O2 and 70% N2. Rats had their left femoral artery and vein cannulated, and were also tracheotomized and ventilated. A laser speckle camera (Moor Instruments) was used to monitor relative CBF over a thin skull window over the right whisker barrel cortex while an LFP electrode for neuronal activity was inserted through a burr hole. Bipolar stimulating electrodes were placed in the left whisker pad. Animals had a steady-state blood gas before and after drug administration (Table 2). An electrical stimulus (10 Hz, 16 s duration, 1.6 mA, 0.3 ms pulsewidth, 60 s interstimulation interval) to evoke a blood flow response in the right whisker barrel cortex was performed for 10 trials per animal. Following this, animals were exposed to 10% CO2 for 30 s at 3 min intervals repeated four times to induce a hypercapnic blood flow response. Animals were then administered 5 mg/kg SC560 or 10% DMSO (vehicle) intravenously. SC560 is a highly lipophilic COX-1 inhibitor and distributes widely into tissues (Teng et al., 2003), and this dose was chosen for maximal target efficiency (Zhang et al., 2003). After 20 min, the effect of COX-1 inhibition on the evoked CBF responses to whisker stimulation and hypercapnia was measured.
Table 2.
Blood gases for SC560 intravenous experiment (Nota Bene blood gases taken before and after drug administration)a
| Condition | Treatment | pH | pCO2 (mmHg) | pO2 (mmHg) |
|---|---|---|---|---|
| Predrug | DMSO | 7.47 (0.01) | 33.5 (1.5) | 164 (5) |
| SC560 | 7.45 (0.01) | 36.8 (1.2) | 140 (5) | |
| Postdrug | DMSO | 7.46 (0.01) | 34.1 (0.6) | 156 (6) |
| SC560 | 7.45 (0.03) | 37.1 (2.1) | 140 (5) |
aData are mean (SEM).
Animals: in vivo calcium imaging
For in vivo experiments, all procedures involving animals were approved by the Danish National Ethics Committee according to the guidelines set forth in the European Council's Convention for the Protection of Vertebrate Animals used for Experimental and Other Scientific Purposes. The 8- to 10-week-old male C57BL/6J mice were used.
In vivo calcium imaging
For experiments involving mice, anesthesia was induced with bolus injections of the α2-adrenergic receptor agonist xylazine (10 mg/kg i.p.) and the NMDA-receptor antagonist ketamine (60 mg/kg i.p.). Anesthesia was maintained during surgery with supplemental doses of ketamine (30 mg/kg/20 min i.p.). Upon completion of all surgical procedures, anesthesia was switched to continuous infusion with α-chloralose (50 mg/kg/h i.v.).
Calcium activity during hypercapnia was measured in vivo in eight C57BL/6J mice. A craniotomy over the somatosensory cortex was covered with agarose and partly sealed with a glass coverslip. Oregon Green Bapta-1/AM (OGB; Invitrogen) was dissolved in DMSO and Pluronic F-127 (10%, BASF Global) and diluted in aCSF to yield a final dye concentration of 0.8 mm. It was mixed with the astrocyte marker sulforhodamine 101 (SR101; Sigma-Aldrich, 100 μm) (Nimmerjahn et al., 2004) and was pressure injected (4–6 psi, 4 s) into the somatosensory cortex through a micropipette at a depth of 100–150 μm below the cortical surface. Ca2+ imaging was performed using a commercial two-photon microscope (SP5 multiphoton/confocal Laser Scanning Microscope; Leica), and a Mai Tai HP Ti:sapphire laser (Millennia Pro, Spectra Physics) with a 20× 1.0 NA-water-immersion objective (Leica). The excitation wavelength was 820 nm. The emitted light was filtered to retain both red and green light using a TRITC/FITC filter.
The hypercapnia challenge was presented as follows: Following 1 min baseline recording, 10% CO2 in air was applied for 30 s and imaging continued for subsequent 4 min. Five trials were performed with 3 min between trials. For each animal, a second field of view was selected and the hypercapnia challenge repeated. Blood gases were taken after each experiment, and all mice had pCO2 in the range 30–40 mmHg and pO2 in the range 95–130 mmHg.
Data collection, analysis, and statistics
In vitro data.
An image (512 × 512 pixels) was collected in 7.86–12.68 s, using 8-line averaging. Measurements of lumen diameter and Ca2+ changes were performed offline with Zeiss LSM (version 3.2) software and ImageJ (National Institutes of Health). As previously described (Gordon et al., 2008), fluorescence signals were defined as F/F0 (%) = [(F1 − B1)/(F0 − B0)]100, where F1 and F0 are fluorescence at a given time and the mean fluorescence during the control period, respectively. B1 and B0 are the corresponding background fluorescence signals, taken from the neuropil. Pseudo-color images show absolute changes in fluorescence (ImageJ, 16-color linear Lut). Experimental values are mean ± SEM; n is the number of experiments conducted or, for calcium changes, number of astrocytes analyzed. Either a two-tailed Student's t test or a one-way ANOVA with a Newman–Keuls post hoc test for comparison between multiple groups was used, and p < 0.05 was considered statistically significant. As these were novel experiments, the effect size was unknown before the experiment. Therefore, sample size estimates were based on our previous experience. Experiments were alternately performed under control or treatment conditions with slices chosen at random for each experiment. Data were excluded from analysis if any of the following occurred during imaging: unstable baseline vessel diameters or astrocyte calcium levels, or movement leading to significant focus changes during the experiment. To perform statistical analysis, data were assumed to be normally distributed.
In vivo data.
All laser Doppler and LFP data were collected in Spike 2 software, whereas laser speckle data were collected using Moor FLPI software. Quantification of CBF changes and electrophysiology were performed in MATLAB (The MathWorks, version 7.12). To obtain the region of interest (ROI) for calculation of CBF changes using laser speckle imaging, a principal components analysis was used to identify the focal point of the change in response to stimulation. The same region of interest was used within each animal's data. Experimental values are the mean ± SEM, and n is the number of animals. To perform statistical analysis, data were assumed to be normally distributed. An F test was used to compare variances of groups being statistically compared. For CBF data, a one-tailed t test with Welch's correction (as groups had significantly different variances) was used to compare means between groups. A two-tailed t test was used to compare means of groups for both GSH analysis (see Fig. 5C) and electrophysiology data in response to whisker pad stimulation (Welch-corrected for SC560 experiment, see Fig. 6C). For electrophysiology data collected during hypercapnia challenge experiments, a two-way ANOVA with Bonferroni correction for multiple comparisons was used to compare means between groups. p < 0.05 was considered statistically significant. For experiments involving rats, due to effect sizes being unknown before experiment, sample size estimates were based on previously published sample sizes (e.g., Niwa et al., 2001). Assignment of animals was alternated between treatment and control groups, and neither experiments nor analysis were blinded. Three animals were excluded from all data analysis (1 for SC560 and 2 for BSO) due to technical problems with experimental equipment.
Figure 6.

CBF responses to whisker pad stimulation in vivo are independent of GSH. A, Mean time course of local CBF response to whisker pad stimulation, measured by laser speckle contrast imaging, in vehicle (DMSO)- (blue) and SC560- (red) injected rats. Colored box represents time of stimulation. Dotted black line indicates pretreatment peak of 1. B, Mean AUC of the CBF response to whisker pad stimulation. n = 7 rats for each group. C, Mean neural response (LFP) magnitude to whisker pad stimulus (summed over total 16 s length of stimulus). Responses are normalized to the first pulse response for each rat. n = 4 DMSO-treated rats; n = 3 SC560-treated rats. D, Mean AUC of the whisker pad stimulation-evoked CBF response in saline- (blue) and BSO- (red) injected rats. n = 10 rats for each group. E, Mean neural response (LFP) magnitude to whisker pad stimulation (summed over total 16 s length of stimulus). Responses are normalized to the first pulse response for each rat. n = 3 rats in each group. Data are mean ± SEM.
For in vivo calcium imaging, frame size was 256 × 256 pixels (189–207 ms/frame) during recordings. The Ca2+ changes were evaluated as the average change in fluorescence relative to baseline levels in ROIs. The ROIs were placed based on morphology over neuronal or astrocytic soma, or neuropil. Because of movement of astrocytes during hypercapnia, within or out of focus, ROIs were evaluated based on the level of SR101 loading in the red channel. If a significant change occurred, the ROI was disregarded in all following assessments. An increase in fluorescence within an ROI was classified as a calcium response if the mean fluorescence value within the period of hypercapnia was >2 SDs of baseline activity. The delay of the Ca2+ response was found by subtracting the signal onset time from the time hypercapnia was introduced to the animal. To estimate response start and termination time, a fit was made to the data and the first- and second-order derivatives were calculated. The response onset time was found by taking the maximum peak of the second order derivative of the fitted data. The duration of the Ca2+ response was then found by subtracting the response onset time from the response termination time. The response termination time was defined as the time point when the fitted data went below mean baseline Ca2+ levels or the recording ended. Experimental values are expressed as mean ± SEM. A paired t test was used for the calcium imaging data, each animal served as its own control. p < 0.05 was accepted as statistically significant. For experiments involving mice, as there have been no previous studies reporting astroglial calcium changes during hypercapnia, it was impossible to estimate an expected value for change in fluorescence or its SD. Hence, no sample size calculation could be performed. However, we expected similar calcium changes to those we observe for low-frequency whisker stimulation, and so sample sizes were based on our previous experiments (6–8 mice). Calcium signals obtained during hypercapnia exceeded an SNR of 4:1, and hypercapnia-induced calcium responses were recorded in every animal tested. As all mice were subjected to hypercapnia, there was no randomization method used. Control measurements of calcium activity (i.e., activity without application of hypercapnia) were taken at random time points during the experiment. Analysis of calcium changes was not blinded, assessment of these changes was based on a MATLAB program, which analyzes the image sequences in an unbiased manner, rather than by visual inspection.
Results
Increased CO2 evokes [Ca2+]i responses in astrocytes in vivo
Elevation of tissue CO2 concentration, which can be caused by neuronal metabolism, is known to dilate cerebral blood vessels in a process dependent on PgE2 (Wagerle and Mishra, 1988; Wagerle and Degiulio, 1994) formation via COX-1 activity (Niwa et al., 2001). However, the cells that both are responsible for sensing CO2 and that also express the enzymes for synthesizing PgE2 (COX-1 and PgES) have not been resolved. Astrocytes can produce PgE2, but it is unknown whether astrocytes generate [Ca2+]i signals in response to CO2. Therefore, we tested whether an increase in inspired CO2 (hypercapnia) in vivo evokes astrocyte [Ca2+]i when it also triggers CBF increases.
Two-photon laser scanning microscopy (2PLSM) in vivo was used to examine the simultaneous responses of both neurons and astrocytes to hypercapnia in the intact brain as a first step to investigate which cell type might be the primary sensor of CO2 (Fig. 1). Remarkably, we found consistent and significant increases in [Ca2+]i in the soma and endfeet of astrocytes in cortical layers II/III of mouse (Fig. 1) during the period of hypercapnia. The dramatic increases that we observed in astrocytes were of significantly higher amplitude (Fig. 1A–C; p < 0.01) than increases in [Ca2+]i observed in neuronal soma during the period of hypercapnia. The number of astrocytes with [Ca2+]i responses was also much greater in hypercapnia compared with the number showing spontaneous calcium activity (control time period: Fig. 1D; p < 0.01). Although neurons could display increased [Ca2+]i during hypercapnia, with onset times within seconds (Fig. 1B,C,E), there was no significant difference in the number of neurons with [Ca2+]i responses during hypercapnia compared with the number showing spontaneous calcium activity (control time period: Fig. 1D). Measurements taken in the neuropil where there were no defined cell bodies, and it is difficult to separate signals in fine astrocyte processes from neuronal processes did not show correlated changes in [Ca2+]i signals during hypercapnia (Fig. 1D). The astrocyte [Ca2+]i responses (Fig. 1B,E,F) appear to occur within a similar timescale as the increased CBF evoked by hypercapnia (as measured by laser speckle contrast imaging and laser Doppler flowmetry in rat; see Fig. 5A, D, respectively). During hypercapnia, an increased number of astrocyte soma (Fig. 1D) displayed increased [Ca2+]i with onsets within seconds (Fig. 1B,E) and variable durations of tens of seconds (Fig. 1B,F). While there were no differences between the three groups (astrocyte soma, neuronal soma, and neuropil) with regards to the delay of the hypercapnia-induced Ca2+ responses (average Ca2+ response delay [Fig. 1E]: neuron soma = 12.14 ± 1.19 s (n = 33), neuropil = 12.83 ± 4.18 s (n = 3), and astrocyte soma = 14.57 ± 1.55 s (n = 47)), the average Ca2+ response duration (Fig. 1F) was found to be significantly longer in astrocytes than in neurons: neuron soma = 119.41 ± 8.82 s (n = 33), astrocyte soma = 155.47 ± 8.32 s (n = 47) (p < 0.05, ANOVA).
Figure 1.
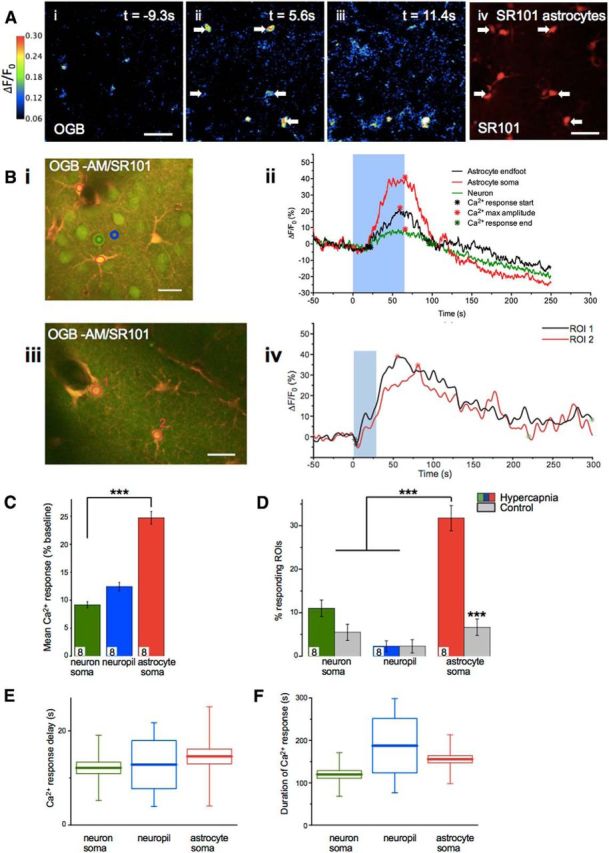
Astrocyte [Ca2+]i transients are evoked by CO2 in vivo. A, Example still images of mouse cortical layer II/III from 2PLSM. OGB is used as a calcium indicator (Ai–Aiii) and sulforhodamine 101 (SR101, Aiv, average image for whole recording) is used to stain astrocytes. Color scale refers to images Ai–Aiii. White arrows indicate astrocytes that show a Ca2+ response to CO2 of at least twice its baseline Ca2+ fluctuation. In this case, CO2 stimulus begins at t = 0 s and is applied for 36 s. Aiii, Recovery of immediate CO2 induced Ca2+ transient. Scale bars, 40 μm. Bi, Biii, Further example images of mouse cortical layer II/III from 2PLSM showing example ROI placement. Merge images showing OGB and SR101 (Bi, Biii). Red ROI1 indicates astrocyte endfoot. Red RO12 indicates astrocyte soma (layer II: n = 181, 8 mice). Green ROI indicates neuron soma (layer II: n = 153, 8 mice). Blue ROI indicates neuropil (layer II: n = 104, 8 mice). Scale bar, 20 μm. Example time series (Bii, Biv) of [Ca2+]i response in astrocyte and neuron soma ROIs (as indicated in Bi, Biii). Blue box represents time during which expired CO2 level is increased. C, Mean Ca2+ response in ROIs. Colors represent ROIs located as shown in Bi. D, Percentage of ROIs for each cell type that showed a Ca2+ response with and without a hypercapnia stimulus. For no hypercapnia (control), n = 170 astrocyte somas, n = 148 neuronal soma, and n = 96 neuropil ROIs, n = 8 mice. Colors represent description in B. E, Delay from hypercapnia start time to start of Ca2+ response in ROI. F, Duration of Ca2+ response in each ROI in response to CO2 stimulus. E, F, Box plots represent the mean (small square). Edges of the box represent 25% and 75% of data. End lines indicate maximum and minimum values. Data are mean ± SEM. **p < 0.01. ***p < 0.001.
Astrocytic [Ca2+]i signals evoke subsequent GSH-dependent PgE2 release
Having demonstrated in vivo that hypercapnia evokes an increase in astrocyte [Ca2+]i, we then used a combination of 2PLSM and PgE2 measurements using ELISA in acute brain slices to determine the mechanistic links between astrocyte [Ca2+]i responses and CBF regulation. Using a biochemical model, we investigated the role of GSH in the generation of PgE2.
Unlike in the in vivo situation, it is difficult to reliably evoke astrocyte [Ca2+]i signals and vasodilations by applying CO2 to acute brain slices. Thus, we needed an alternative method of elevating astrocyte [Ca2+]i in acute brain slices. Although the adult mouse (Sun et al., 2013) and rat (Duffy and MacVicar, 1995) have been shown to not express functional mGluR5, bath application of the mGluR agonist tACPD is known to increase astrocyte [Ca2+]i in younger animals (Mulligan and MacVicar, 2004). Therefore, tACPD was used to evoke reliable, reproducible astrocyte [Ca2+]i elevations in acute brain slices from juvenile rats. To evoke widespread increases in astrocyte [Ca2+]i, hippocampal-neocortical slices were perfused with tACPD, an mGluR agonist. Application of tACPD (100 μm) to brain slices (from juvenile rats) caused a generalized increase in astrocyte [Ca2+]i, observed using 2PLSM (Fig. 2A–C), that provided us with the ability to measure subsequent synthesis of PgE2. Applying tACPD resulted in the formation and efflux of PgE2, as measured by ELISA (Fig. 2D). The first step in the conversion of AA to PgE2 in astrocytes is via COX-1 (Fig. 7) (Takano et al., 2006; Gordon et al., 2008; Font-Nieves et al., 2012). Neurons, in contrast, express COX-2 but not COX-1 (Nogawa et al., 1997). In support of a central role for COX-1, we found that, although the tACPD-evoked increase in astrocyte [Ca2+]i was unaltered (Fig. 2C) in the presence of the COX-1 inhibitor SC560 (Smith et al., 1998; 100 nm: Blanco et al., 2008), the resulting formation and efflux of PgE2, as measured by ELISA, was abolished (p < 0.001; Fig. 2D). Thus, astrocyte COX-1 activity is required for the subsequent PgE2 release in acute brain slices, which is triggered by astrocyte [Ca2+]i signals.
Figure 2.

Astrocyte [Ca2+]i signals evoke COX-1- and GSH-dependent vasodilations in vitro. A, 2PLSM imaging: example Ca2+ and arteriole diameter changes in response to tACPD with and without BSO. Images represent overlay of pseudo-colored Ca2+ changes and transmitted light images. Dotted line indicates initial vessel diameter. Scale bar, 10 μm. B, Mean time course of increase in astrocyte [Ca2+]i in response to tACPD. Colored box represents time of tACPD application. Control, n = 56 from 26 rats; BSO, n = 39 from 18 rats. C, Mean tACPD-evoked increase in astrocyte [Ca2+]i. tACPD, n = 56 from 26 rats; tACPD + SC560, n = 12 from 7 rats; tACPD + BSO, n = 39 from 18 rats. D, Mean tACPD-evoked PgE2 release, measured by ELISA. Within a group, each experiment (n) uses tissue from a different rat (i.e., control, n = 8 from 8 rats). E, Mean tissue GSH concentration; data from 4 rats for each group. F, Mean time course of tACPD-evoked change in lumen diameter. Colored box represents time of tACPD application. Control, n = 31 slices from 26 rats; BSO, n = 21 slices from 18 rats. G, Mean changes in lumen diameter evoked by tACPD and clonidine. tACPD, n = 31 slices from 26 rats; SC560 + tACPD, n = 7 slices from 7 rats; BSO + tACPD, n = 21 slices from 18 rats; clonidine, n = 8 slices from 8 rats; BSO + clonidine, n = 8 slices from 7 rats. H, Mean changes in lumen diameter evoked by PgE2 and NE. PgE2, n = 5 slices from 4 rats; BSO + PgE2, n = 3 slices from 3 rats; NE, n = 14 slices from 11 rats; BSO + NE, n = 8 slices from 7 rats. Data are mean ± SEM. **p < 0.01. ***p < 0.001. n, number of experiments conducted or, for calcium measurements, number of astrocyte ROIs analyzed.
Figure 7.

Increases in astrocytic [Ca2+]i may lead to GSH-dependent, PgE2-mediated vasodilation. Schematic diagram depicting how CO2-evoked increases in astrocytic [Ca2+]i may lead to PgE2-mediated vasodilation. As a result of elevated [Ca2+]i, PLA2 is activated. PLA2 generates AA from the plasma membrane. AA can be processed locally by COX enzymes to produce AA derivatives, such as prostaglandin H2 (PgH2). PgE2 is produced from PgH2 by the enzyme PGEs, which requires GSH as a cofactor (Jakobsson et al., 1999; Murakami et al., 2000; Tanioka et al., 2000). PgE2 is released from astrocyte endfeet, which are apposed to the smooth muscle layer surrounding arterioles, resulting in activation of K+ channels, a decrease in Ca2+ entry into the smooth muscle cell and vasodilation.
Downstream of COX-1 the synthesis of PgE2 involves the enzyme mPgES-1 (Tachikawa et al., 2012), a form of prostaglandin E synthase expressed in astrocytes (Fig. 3A) (Tachikawa et al., 2012) that requires the cofactor GSH (Jakobsson et al., 1999; Murakami et al., 2000). It is known that GSH is present in high levels in astrocytes (Sun et al., 2006; Bragin et al., 2010; Robillard et al., 2011), as detected by staining of brain tissue with MCB, a GSH-sensitive dye (Fig. 3B). Therefore, we investigated whether PgE2 formation was reduced when GSH levels were depressed. We examined whether there is a reduction in astrocyte [Ca2+]i-evoked PgE2 release in hippocampal slices after treatment with BSO (an inhibitor of γ-glutamylcysteine synthetase) for 2.5 h (Sun et al., 2006), which reduced the tissue GSH concentration by 27% (p = 0.009; Fig. 2E). When GSH levels were decreased, although there was no change in basal PgE2 efflux (Fig. 2D) or in the amplitude of tACPD-evoked astrocyte [Ca2+]i signals (Fig. 2A–C), strikingly the tACPD-evoked PgE2 efflux was reduced by 64% (p < 0.001; Fig. 2D).
Astrocyte [Ca2+]i signals evoke COX-1 and GSH-dependent vasodilations in brain slices
As COX-1 activity (Niwa et al., 2001) and PgE2 release (Wagerle and Mishra, 1988; Wagerle and Degiulio, 1994) have been shown to lead to increased CBF in response to hypercapnia, we examined whether COX-1-dependent PgE2 release evoked by astrocyte [Ca2+]i signals triggered by either tACPD application or IP3 uncaging resulted in vasodilations.
Bath perfusion of tACPD induced arteriolar dilation in acute brain slices (Fig. 2A,F,G), which was abolished in the presence of SC560 (p < 0.01; Fig. 2G), whereas the amplitude of evoked astrocyte [Ca2+]i signals was unchanged (p > 0.05; Fig. 2C). Thus, combined with the results discussed above, these data confirm that astrocyte COX-1 activity and subsequent PgE2 release are required for vasodilations in acute brain slices that are triggered by astrocyte [Ca2+]i signals.
As previously discussed, downstream of COX-1, the synthesis of PgE2 involves the astrocyte-expressed, GSH-dependent, enzyme mPgES-1 (Tachikawa et al., 2012). Therefore, a role for astrocytes in the regulation of arteriole diameter would be supported if [Ca2+]i-evoked vasodilations were attenuated when GSH levels were depressed. We examined whether there is a reduction in subsequent vasodilations in hippocampal slices after treatment with BSO. When GSH levels were decreased, tACPD-evoked astrocyte [Ca2+]i signals were unaltered (Fig. 2A–C). However, the vasodilations triggered by these [Ca2+]i signals were abolished (Fig. 2A,F,G; p < 0.01). Vasoconstrictions evoked by NE (100 μm) or the α2 agonist clonidine (10 μm), which act directly on arteriole smooth muscle cells (Busija and Leffler, 1987), were unchanged in the presence of BSO (Fig. 2A,G,H), indicating that arterioles were not damaged by the BSO treatment. Furthermore, BSO treatment did not alter the vasodilation evoked by either 1 μm PgE2 (Fig. 2H) or high [K+] (10 mm), which causes vasodilation by hyperpolarizing arteriole smooth muscle cells (Filosa et al., 2006) (K+: 8.6 ± 2.3%, n = 5 slices from 5 rats; BSO + K+: 6.5 ± 0.8%, n = 6 slices from 3 rats, p = 0.37).
Astrocyte [Ca2+]i increases can be triggered by two-photon uncaging of IP3 within the cell body of an astrocyte. Using this technique, we directly examined the effect of decreasing GSH levels on astrocyte [Ca2+]i-evoked arteriole dilations. Astrocytes in hippocampal slices from juvenile rats were bulk-loaded with the caged IP3 compound, NV-IP3/AM. Two-photon photolysis was used to uncage IP3 within an astrocyte soma specifically, generating a [Ca2+]i increase within the soma, processes, and endfeet. This local increase in [Ca2+]i could evoke an increase in [Ca2+]i in nearby astrocytes (Fig. 4A,B represents local and propagated responses) and elicited vasodilation of the neighboring arteriole (Fig. 4C). Although astrocyte [Ca2+]i signals were unaltered following BSO treatment to reduce GSH levels (p = 0.1; Fig. 4A,B), dilations were not observed and vasoconstrictions were now evoked (p = 0.008; Fig. 4C). Thus, when GSH levels are reduced, astrocyte [Ca2+]i signals can no longer evoke vasodilations normally triggered by the release of PgE2.
Figure 4.

Astrocyte [Ca2+]i transient-evoked vasodilations are GSH dependent in vitro. A, Mean IP3-evoked increases in astrocyte [Ca2+]i. Control, n = 21 from 6 rats; +BSO, n = 11 from 4 rats. B, Mean time course of increase in astrocyte [Ca2+]i. Dotted line indicates time of photolysis of caged IP3. n as described in A. C, Mean lumen diameter change in response to uncaging of IP3. Uncage IP3, n = 11 slices from 6 rats; +BSO, n = 6 slices from 4 rats. Data are mean ± SEM. **p < 0.01. n, number of experiments conducted or, for calcium measurements, number of astrocyte ROIs analyzed.
In vivo hypercapnia-evoked CBF responses are GSH dependent
Having determined in acute brain slices the vasodilatory molecules underlying astrocyte [Ca2+]i-evoked vasodilations, we examined whether these same enzymes and molecules were involved in the CBF response, which occurs downstream of CO2-evoked astrocyte [Ca2+]i responses in vivo. Hypercapnia in vivo evoked a CBF increase in the barrel cortex of adult rat (Fig. 5A,B,D,E), whereas neural activity was unchanged (Fig. 5F). The calculated area under the curve (AUC) of the CBF response was significantly attenuated by SC560 (p = 0.032; Fig. 5A,B), confirming that COX-1 plays a critical role in hypercapnia-evoked CBF increases in vivo (Niwa et al., 2001).
We examined the impact of decreased tissue GSH levels on CO2-evoked CBF increases in vivo. To lower GSH levels in vivo, BSO was injected into rat barrel cortex. After 24 h, tissue GSH levels in the ipsilateral cortex were reduced by 45% (Fig. 5C; p = 0.018). Treatment with BSO reduced the hypercapnia-evoked CBF response (Fig. 5D,E; AUC reduced by 65%, p = 0.048). Neural activity was no different in BSO-treated rats compared with saline-treated rats (Fig. 5G). Combining all the data described so far suggests that hypercapnia-evoked, astrocyte [Ca2+]i-related, CBF increases require PgE2 release and, thus, are compromised when brain GSH levels are reduced.
This finding was specific to hypercapnia-evoked CBF increases. We examined the impact of decreased tissue GSH levels in vivo on functional hyperemia in the somatosensory cortex. Whisker pad stimulation (10 Hz) evoked a blood flow increase in the barrel cortex (Fig. 6A). In agreement with previous findings (Niwa et al., 2000), inhibiting COX-1 with SC560 had no effect on either the CBF response to whisker pad stimulation (Fig. 6A,B; p = 0.10) or evoked neural activity (LFP) (Fig. 6C; p = 0.91). Furthermore, the AUC of the stimulation-evoked CBF response was not significantly different in BSO-treated animals (Fig. 6D; p = 0.14) compared with saline-treated animals, demonstrating that the CBF response is not GSH-sensitive. The magnitude of the neural response to whisker pad stimulation was unaffected by BSO (Fig. 6E; p = 0.68). These results indicate that, under these experimental conditions, COX-1 and GSH play little, if any, role in the CBF response to somatosensory stimulation. These findings confirm that several different pathways exist that account for CBF regulation under differing conditions and in response to different stimuli.
Discussion
We demonstrate a novel mechanism of CBF regulation involving astrocytes, which is GSH dependent. Previously, Niwa et al. (2001) demonstrated that hypercapnia-evoked CBF increases are principally COX-1 dependent. In this study, we examined the mechanism of such CBF regulation, both upstream and downstream of hypercapnia-evoked increases in COX-1 activity (Fig. 7). We demonstrate in vivo that, upstream of evoked COX-1 activity, CO2 increases [Ca2+]i in astrocytes. These data demonstrate a new signal (hypercapnia) that activates astrocyte calcium and specifically identify the involvement of astrocytes in the regulation of CBF in response to changes in arterial CO2.
In vitro, using brain slices from juvenile animals in which it is possible to examine calcium signals by bulk loading a calcium indicator dye, we confirm that increased astrocyte [Ca2+]i results in the subsequent release of PgE2 and vasodilation which are COX-1 activity-dependent (Fig. 7). Our assumption that the evoked response in juvenile rat slices is the same as in adult rat with respect to COX-1 dependence is supported by the fact that the same COX-1 dependence has been shown in adult mice (Takano et al., 2006). We demonstrate that these findings hold in vivo, confirming previous findings in adult mice (Niwa et al., 2001). Astrocytic endfeet, which are apposed to cerebral vascular smooth muscle, express all the machinery necessary for PgE2 synthesis (COX-1) (Takano et al., 2006; Gordon et al., 2008), mPgES-1 (Fig. 3A) (Tachikawa et al., 2012), and GSH: (Fig. 3B) (Sun et al., 2006; Bragin et al., 2010; Robillard et al., 2011), providing further evidence for the involvement of astrocytes in the regulation of CBF responses to hypercapnia. mPgES, an enzyme selectively expressed in astrocytes compared with neurons (Tachikawa et al., 2012), is the enzyme responsible for producing PgE2 downstream of COX-1 activity. Intriguingly, the formation of PgE2 is regulated by the availability of GSH in astrocytes, as PgES requires GSH as a cofactor (Jakobsson et al., 1999; Murakami et al., 2000). In vitro, we demonstrate that astrocyte [Ca2+]i-evoked vasodilations are attenuated when GSH levels are depleted, whereas in vivo, we demonstrate that CO2-evoked CBF increases occur via a GSH-dependent mechanism. As astrocytes contain high levels of GSH (Fig. 3B) (Sun et al., 2006; Bragin et al., 2010; Robillard et al., 2011), the dependence of the CO2-evoked CBF response on GSH is further evidence of astrocytic involvement. Together, our findings suggest a novel mechanism of astrocyte-evoked CBF regulation, which is GSH dependent. We propose that increased CO2 levels evoke [Ca2+]i responses in astrocytes, subsequently activating a signaling pathway, involving COX-1 and the GSH-dependent PgES, which results in the release of the vasodilator PgE2. Thus, an increase in CO2 results in an astrocyte-driven, GSH-dependent vasodilation (Fig. 7).
This GSH-dependent mechanism of CBF regulation exists alongside other COX-1 and GSH-insensitive mechanisms. For example, we found no effect of blocking COX-1 activity or of lowering GSH levels on CBF responses following 10 Hz whisker pad stimulation. Although it is possible that an astrocyte calcium response (and, thus, a GSH-sensitive mechanism of CBF regulation) may be evoked by an intense sensory stimulus (Schulz et al., 2012; Sekiguchi et al., 2016), our results are in agreement with previous work suggesting that COX-1 is involved in CBF responses to hypercapnia (Niwa et al., 2001) but not sensory stimulation (Niwa et al., 2000). Although we saw no evidence that this pathway was important for functional (neuronal activity-evoked) increases in CBF under our experimental conditions, astrocytes appear to be an important intermediary for physiological (hypercapnia-evoked) increases in CBF. Our findings suggest that CBF regulation may involve astrocytes, and their [Ca2+]i signals, under certain conditions and not under others.
Previous studies have provided evidence for several mechanisms linking astrocyte [Ca2+]i, increases and changes in CO2 concentration. For example, within the respiratory center, increased astrocyte [Ca2+]i, and astrocytic release of ATP can be triggered by CO2-evoked decreases in pH (Gourine et al., 2010). This [Ca2+]i, increase may be the result of increased Na+/HCO3− cotransport and reversal of Na+/Ca2+ transport (Turovsky et al., 2016). It is unknown whether this mechanism also occurs within the cortex. Alternatively, increased CO2 can evoke hemichannel-mediated release of ATP (Huckstepp et al., 2010), which may act on astrocytic purinergic receptors to elicit an increase in [Ca2+]i (Pelligrino et al., 2011). Depending on the mechanism linking increases in CO2 to astrocyte [Ca2+]i responses, therefore, astrocytes could act as either a pH or CO2 sensor. Although it is beyond the scope of this paper to determine the link between an increase in CO2 and the increase in astrocyte [Ca2+]i, we have demonstrated that the depletion of GSH levels leads to a reduction in the ability of astrocytes to release PgE2 following such a rise in [Ca2+]i, and so reduces their ability to evoke vasodilation in response to hypercapnia. This occurs because astrocytes express GSH-dependent mPgES-1.
Our finding that CBF responses to increased CO2 are GSH-sensitive suggests that global CBF regulation, which is sensitive to the partial pressure of arterial CO2 (Ainslie and Duffin, 2009), will be affected in conditions where GSH levels are depleted. Alterations in the redox status of brain tissue that are ultimately linked to cellular GSH levels have been observed in numerous neurological and psychiatric disorders (Slivka and Cohen, 1993; Tohgi et al., 1995, 1999; Ansari and Scheff, 2010; Zhang et al., 2012; Kulak et al., 2013). Therefore, the impact of changes in GSH levels on the sensitivity of astrocyte regulation of vasodilation could contribute to several CNS pathologies. Thus, it is critical to understand the signaling pathways underlying changes in CBF, both in health and disease.
It has previously been shown that, in addition to astrocytic production of PgE2 via COX-1/mPgES activity, neurons (which express COX-2 but not COX-1) (Nogawa et al., 1997; Lecrux et al., 2011), are capable of producing COX-2-derived PgE2 (which contributes to neurovascular coupling) (Lecrux et al., 2011; Lacroix et al., 2015). In this study, we used a pharmacological approach to increase astrocyte [Ca2+]i and to inhibit either the de novo synthesis of glutathione or the activity of COX-1, specifically, to demonstrate that, downstream of an increase in astrocyte [Ca2+]i, COX-1 activity and glutathione are required for vasodilation to occur. However, as this pharmacological approach lacks cellular specificity, a contribution of neuronally produced PgE2 to the hypercapnia-evoked CBF response cannot be completely excluded. Nevertheless, our conclusion that astrocyte COX-1-derived PgE2, rather than neuronal COX-2-derived PgE2, is involved in the CBF response to hypercapnia is in agreement with previous findings (Niwa et al., 2001). Future studies could use an astrocyte-specific genetic strategy (such as cell-specific knock-out) (Casper et al., 2007) to confirm that hypercapnia-evoked vasodilations, occurring downstream of astrocyte [Ca2+]i responses, are dependent on astrocyte glutathione levels and COX-1 activity.
In conclusion, we demonstrate a novel mechanism by which astrocytes detect hypercapnia and, via [Ca2+]i signals, increase CBF in response to CO2. Astrocytes are therefore poised to detect the metabolic activity of neurons and to modify vascular tone appropriately to deliver glucose and O2. This important pathway may be impaired in conditions in which oxidative stress reduces GSH levels in astrocytes, leading to impaired CBF responses and altered vascular readouts of neural activity.
Footnotes
This work was supported by a Sir Henry Wellcome Post-Doctoral Fellowship to C.H., a Government of Canada Post-Doctoral Research Fellowship to C.H., a Michael Smith Foundation for Health Research Post-Doctoral Fellowship to C.H., a Natural Sciences and Engineering Research Council Post-Doctoral Fellowship to J.M.P.P., a Canadian Institutes of Health Research Doctoral Studentship to R.K., a Canada Research Chair in Neuroscience to B.A.M., Canadian Institutes of Health Research Operating Grants 148397, 8545, 115121, and TCE-117869 in the framework of the ERA-NET NEURON to B.A.M., Fondation Leducq to B.A.M., A.M.B., and M.L., Human Frontiers Science Program to B.A.M. and G.E.-D., National Institutes of Health Grants GM053395 and NS069720 to G.E.-D., Heart and Stroke Foundation to B.A.M. and H.B.C., the Wellcome Trust to C.M., Royal Society University Research Fellowship to C.M., Cancer Research United Kingdom C5255/A12678 to N.R.S., the Henry Smith Charity to A.M.B., NORDEA Foundation for the Center for Healthy Aging to M.L., the Lundbeck Foundation to M.L., the NOVO-Nordisk Foundation to M.L., and the Danish Medical Research Council to M.L. We thank David Attwell for discussions regarding this work.
The authors declare no competing financial interests.
References
- Ainslie PN, Duffin J (2009) Integration of cerebrovascular CO2 reactivity and chemoreflex control of breathing: mechanisms of regulation, measurement, and interpretation. Am J Physiol Regul Integr Comp Physiol 296:R1473–R1495. 10.1152/ajpregu.91008.2008 [DOI] [PubMed] [Google Scholar]
- Ansari MA, Scheff SW (2010) Oxidative stress in the progression of Alzheimer disease in the frontal cortex. J Neuropathol Exp Neurol 69:155–167. 10.1097/NEN.0b013e3181cb5af4 [DOI] [PMC free article] [PubMed] [Google Scholar]
- Attwell D, Buchan AM, Charpak S, Lauritzen M, Macvicar BA, Newman EA (2010) Glial and neuronal control of brain blood flow. Nature 468:232–243. 10.1038/nature09613 [DOI] [PMC free article] [PubMed] [Google Scholar]
- Blanco VM, Stern JE, Filosa JA (2008) Tone-dependent vascular responses to astrocyte-derived signals. Am J Physiol 294:H2855–H2863. 10.1152/ajpheart.91451.2007 [DOI] [PMC free article] [PubMed] [Google Scholar]
- Bonder DE, McCarthy KD (2014) Astrocytic Gq-GPCR-linked IP3R-dependent Ca2+ signaling does not mediate neurovascular coupling in mouse visual cortex in vivo. J Neurosci 34:13139–13150. 10.1523/JNEUROSCI.2591-14.2014 [DOI] [PMC free article] [PubMed] [Google Scholar]
- Bragin DE, Zhou B, Ramamoorthy P, Müller WS, Connor JA, Shi H (2010) Differential changes of glutathione levels in astrocytes and neurons in ischemic brains by two-photon imaging. J Cereb Blood Flow Metab 30:734–738. 10.1038/jcbfm.2010.9 [DOI] [PMC free article] [PubMed] [Google Scholar]
- Busija DW, Leffler CW (1987) Exogenous norepinephrine constricts cerebral arterioles via alpha 2-adrenoceptors in newborn pigs. J Cereb Blood Flow Metab 7:184–188. 10.1038/jcbfm.1987.42 [DOI] [PubMed] [Google Scholar]
- Cahoy JD, Emery B, Kaushal A, Foo LC, Zamanian JL, Christopherson KS, Xing Y, Lubischer JL, Krieg PA, Krupenko SA, Thompson WJ, Barres BA (2008) A transcriptome database for astrocytes, neurons, and oligodendrocytes: a new resource for understanding brain development and function. J Neurosci 28:264–278. 10.1523/JNEUROSCI.4178-07.2008 [DOI] [PMC free article] [PubMed] [Google Scholar]
- Casper KB, Jones K, McCarthy KD (2007) Characterization of astrocyte-specific conditional knockouts. Genesis 45:292–299. 10.1002/dvg.20287 [DOI] [PubMed] [Google Scholar]
- Duffy S, MacVicar BA (1995) Adrenergic calcium signaling in astrocyte networks within the hippocampal slice. J Neurosci 15:5535–5550. [DOI] [PMC free article] [PubMed] [Google Scholar]
- Filosa JA, Bonev AD, Straub SV, Meredith AL, Wilkerson MK, Aldrich RW, Nelson MT (2006) Local potassium signaling couples neuronal activity to vasodilation in the brain. Nat Neurosci 9:1397–1403. 10.1038/nn1779 [DOI] [PubMed] [Google Scholar]
- Font-Nieves M, Sans-Fons MG, Gorina R, Bonfill-Teixidor E, Salas-Pérdomo A, Márquez-Kisinousky L, Santalucia T, Planas AM (2012) Induction of COX-2 enzyme and down-regulation of COX-1 expression by lipopolysaccharide (LPS) control prostaglandin E2 production in astrocytes. J Biol Chem 287:6454–6468. 10.1074/jbc.M111.327874 [DOI] [PMC free article] [PubMed] [Google Scholar]
- Gordon GR, Choi HB, Rungta RL, Ellis-Davies GC, MacVicar BA (2008) Brain metabolism dictates the polarity of astrocyte control over arterioles. Nature 456:745–749. 10.1038/nature07525 [DOI] [PMC free article] [PubMed] [Google Scholar]
- Gourine AV, Kasymov V, Marina N, Tang F, Figueiredo MF, Lane S, Teschemacher AG, Spyer KM, Deisseroth K, Kasparov S (2010) Astrocytes control breathing through pH-dependent release of ATP. Science 329:571–575. 10.1126/science.1190721 [DOI] [PMC free article] [PubMed] [Google Scholar]
- Hauge A, Thoresen M, Walløe L (1980) Changes in cerebral blood flow during hyperventilation and CO2-breathing measured transcutaneously in humans by a bidirectional, pulsed, ultrasound Doppler blood velocitymeter. Acta Physiol Scand 110:167–173. 10.1111/j.1748-1716.1980.tb06647.x [DOI] [PubMed] [Google Scholar]
- He L, Linden DJ, Sapirstein A (2012) Astrocyte inositol triphosphate receptor type 2 and cytosolic phospholipase A2 alpha regulate arteriole responses in mouse neocortical brain slices. PLoS One 7:e42194. 10.1371/journal.pone.0042194 [DOI] [PMC free article] [PubMed] [Google Scholar]
- Huckstepp RT, id Bihi R, Eason R, Spyer KM, Dicke N, Willecke K, Marina N, Gourine AV, Dale N (2010) Connexin hemichannel-mediated CO2-dependent release of ATP in the medulla oblongata contributes to central respiratory chemosensitivity. J Physiol 588:3901–3920. 10.1113/jphysiol.2010.192088 [DOI] [PMC free article] [PubMed] [Google Scholar]
- Jakobsson PJ, Thorén S, Morgenstern R, Samuelsson B (1999) Identification of human prostaglandin E synthase: a microsomal, glutathione-dependent, inducible enzyme, constituting a potential novel drug target. Proc Natl Acad Sci U S A 96:7220–7225. 10.1073/pnas.96.13.7220 [DOI] [PMC free article] [PubMed] [Google Scholar]
- Kulak A, Steullet P, Cabungcal JH, Werge T, Ingason A, Cuenod M, Do KQ (2013) Redox dysregulation in the pathophysiology of schizophrenia and bipolar disorder: insights from animal models. Antioxid Redox Signal 18:1428–1443. 10.1089/ars.2012.4858 [DOI] [PubMed] [Google Scholar]
- Lacroix A, Toussay X, Anenberg E, Lecrux C, Ferreirós N, Karagiannis A, Plaisier F, Chausson P, Jarlier F, Burgess SA, Hillman EM, Tegeder I, Murphy TH, Hamel E, Cauli B (2015) COX-2-derived prostaglandin E2 produced by pyramidal neurons contributes to neurovascular coupling in the rodent cerebral cortex. J Neurosci 35:11791–11810. 10.1523/JNEUROSCI.0651-15.2015 [DOI] [PMC free article] [PubMed] [Google Scholar]
- Lathia JD, Okun E, Tang SC, Griffioen K, Cheng A, Mughal MR, Laryea G, Selvaraj PK, ffrench-Constant C, Magnus T, Arumugam TV, Mattson MP (2008) Toll-like receptor 3 is a negative regulator of embryonic neural progenitor cell proliferation. J Neurosci 28:13978–13984. 10.1523/JNEUROSCI.2140-08.2008 [DOI] [PMC free article] [PubMed] [Google Scholar]
- Lecrux C, Toussay X, Kocharyan A, Fernandes P, Neupane S, Lévesque M, Plaisier F, Shmuel A, Cauli B, Hamel E (2011) Pyramidal neurons are “neurogenic hubs” in the neurovascular coupling response to whisker stimulation. J Neurosci 31:9836–9847. 10.1523/JNEUROSCI.4943-10.2011 [DOI] [PMC free article] [PubMed] [Google Scholar]
- Lind BL, Brazhe AR, Jessen SB, Tan FC, Lauritzen MJ (2013) Rapid stimulus-evoked astrocyte Ca2+ elevations and hemodynamic responses in mouse somatosensory cortex in vivo. Proc Natl Acad Sci U S A 110:E4678–E4687. 10.1073/pnas.1310065110 [DOI] [PMC free article] [PubMed] [Google Scholar]
- Mulligan SJ, MacVicar BA (2004) Calcium transients in astrocyte endfeet cause cerebrovascular constrictions. Nature 431:195–199. 10.1038/nature02827 [DOI] [PubMed] [Google Scholar]
- Murakami M, Naraba H, Tanioka T, Semmyo N, Nakatani Y, Kojima F, Ikeda T, Fueki M, Ueno A, Oh S, Kudo I (2000) Regulation of prostaglandin E2 biosynthesis by inducible membrane-associated prostaglandin E2 synthase that acts in concert with cyclooxygenase-2. J Biol Chem 275:32783–32792. 10.1074/jbc.M003505200 [DOI] [PubMed] [Google Scholar]
- Nimmerjahn A, Kirchhoff F, Kerr JN, Helmchen F (2004) Sulforhodamine 101 as a specific marker of astroglia in the neocortex in vivo. Nat Methods 1:31–37. 10.1038/nmeth706 [DOI] [PubMed] [Google Scholar]
- Niwa K, Araki E, Morham SG, Ross ME, Iadecola C (2000) Cyclooxygenase-2 contributes to functional hyperemia in whisker-barrel cortex. J Neurosci 20:763–770. [DOI] [PMC free article] [PubMed] [Google Scholar]
- Niwa K, Haensel C, Ross ME, Iadecola C (2001) Cyclooxygenase-1 participates in selected vasodilator responses of the cerebral circulation. Circ Res 88:600–608. 10.1161/01.RES.88.6.600 [DOI] [PubMed] [Google Scholar]
- Nizar K, Uhlirova H, Tian P, Saisan PA, Cheng Q, Reznichenko L, Weldy KL, Steed TC, Sridhar VB, MacDonald CL, Cui J, Gratiy SL, Sakadzić S, Boas DA, Beka TI, Einevoll GT, Chen J, Masliah E, Dale AM, Silva GA, et al. (2013) In vivo stimulus-induced vasodilation occurs without IP3 receptor activation and may precede astrocytic calcium increase. J Neurosci 33:8411–8422. 10.1523/JNEUROSCI.3285-12.2013 [DOI] [PMC free article] [PubMed] [Google Scholar]
- Nogawa S, Zhang F, Ross ME, Iadecola C (1997) Cyclo-oxygenase-2 gene expression in neurons contributes to ischemic brain damage. J Neurosci 17:2746–2755. [DOI] [PMC free article] [PubMed] [Google Scholar]
- Olajide OA, Velagapudi R, Okorji UP, Sarker SD, Fiebich BL (2014) Picralima nitida seeds suppress PGE2 production by interfering with multiple signalling pathways in IL-1beta-stimulated SK-N-SH neuronal cells. J Ethnopharmacol 152:377–383. 10.1016/j.jep.2014.01.027 [DOI] [PubMed] [Google Scholar]
- Otsu Y, Couchman K, Lyons DG, Collot M, Agarwal A, Mallet JM, Pfrieger FW, Bergles DE, Charpak S (2015) Calcium dynamics in astrocyte processes during neurovascular coupling. Nat Neurosci 18:210–218. 10.1038/nn.3906 [DOI] [PMC free article] [PubMed] [Google Scholar]
- Pelligrino DA, Vetri F, Xu HL (2011) Purinergic mechanisms in gliovascular coupling. Semin Cell Dev Biol 22:229–236. 10.1016/j.semcdb.2011.02.010 [DOI] [PMC free article] [PubMed] [Google Scholar]
- Petzold GC, Albeanu DF, Sato TF, Murthy VN (2008) Coupling of neural activity to blood flow in olfactory glomeruli is mediated by astrocytic pathways. Neuron 58:897–910. 10.1016/j.neuron.2008.04.029 [DOI] [PMC free article] [PubMed] [Google Scholar]
- Pileblad E, Magnusson T (1989) Intracerebroventricular administration of l-buthionine sulfoximine: a method for depleting brain glutathione. J Neurochem 53:1878–1882. 10.1111/j.1471-4159.1989.tb09256.x [DOI] [PubMed] [Google Scholar]
- Robillard JM, Gordon GR, Choi HB, Christie BR, MacVicar BA (2011) Glutathione restores the mechanism of synaptic plasticity in aged mice to that of the adult. PLoS One 6:e20676. 10.1371/journal.pone.0020676 [DOI] [PMC free article] [PubMed] [Google Scholar]
- Rosenegger DG, Tran CH, Wamsteeker Cusulin JI, Gordon GR (2015) Tonic local brain blood flow control by astrocytes independent of phasic neurovascular coupling. J Neurosci 35:13463–13474. 10.1523/JNEUROSCI.1780-15.2015 [DOI] [PMC free article] [PubMed] [Google Scholar]
- Schulz K, Sydekum E, Krueppel R, Engelbrecht CJ, Schlegel F, Schröter A, Rudin M, Helmchen F (2012) Simultaneous BOLD fMRI and fiber-optic calcium recording in rat neocortex. Nat Methods 9:597–602. 10.1038/nmeth.2013 [DOI] [PubMed] [Google Scholar]
- Sekiguchi KJ, Shekhtmeyster P, Merten K, Arena A, Cook D, Hoffman E, Ngo A, Nimmerjahn A (2016) Imaging large-scale cellular activity in spinal cord of freely behaving mice. Nat Commun 7:11450. 10.1038/ncomms11450 [DOI] [PMC free article] [PubMed] [Google Scholar]
- Slivka A, Cohen G (1993) Brain ischemia markedly elevates levels of the neurotoxic amino acid, cysteine. Brain Res 608:33–37. 10.1016/0006-8993(93)90770-N [DOI] [PubMed] [Google Scholar]
- Smith CJ, Zhang Y, Koboldt CM, Muhammad J, Zweifel BS, Shaffer A, Talley JJ, Masferrer JL, Seibert K, Isakson PC (1998) Pharmacological analysis of cyclooxygenase-1 in inflammation. Proc Natl Acad Sci U S A 95:13313–13318. 10.1073/pnas.95.22.13313 [DOI] [PMC free article] [PubMed] [Google Scholar]
- Sun W, McConnell E, Pare JF, Xu Q, Chen M, Peng W, Lovatt D, Han X, Smith Y, Nedergaard M (2013) Glutamate-dependent neuroglial calcium signaling differs between young and adult brain. Science 339:197–200. 10.1126/science.1226740 [DOI] [PMC free article] [PubMed] [Google Scholar]
- Sun X, Shih AY, Johannssen HC, Erb H, Li P, Murphy TH (2006) Two-photon imaging of glutathione levels in intact brain indicates enhanced redox buffering in developing neurons and cells at the cerebrospinal fluid and blood-brain interface. J Biol Chem 281:17420–17431. 10.1074/jbc.M601567200 [DOI] [PubMed] [Google Scholar]
- Tachikawa M, Ozeki G, Higuchi T, Akanuma S, Tsuji K, Hosoya K (2012) Role of the blood-cerebrospinal fluid barrier transporter as a cerebral clearance system for prostaglandin E(2) produced in the brain. J Neurochem 123:750–760. 10.1111/jnc.12018 [DOI] [PubMed] [Google Scholar]
- Takano T, Tian GF, Peng W, Lou N, Libionka W, Han X, Nedergaard M (2006) Astrocyte-mediated control of cerebral blood flow. Nat Neurosci 9:260–267. 10.1038/nn1623 [DOI] [PubMed] [Google Scholar]
- Takata N, Nagai T, Ozawa K, Oe Y, Mikoshiba K, Hirase H (2013) Cerebral blood flow modulation by basal forebrain or whisker stimulation can occur independently of large cytosolic Ca2+ signaling in astrocytes. PLoS One 8:e66525. 10.1371/journal.pone.0066525 [DOI] [PMC free article] [PubMed] [Google Scholar]
- Tanioka T, Nakatani Y, Semmyo N, Murakami M, Kudo I (2000) Molecular identification of cytosolic prostaglandin E2 synthase that is functionally coupled with cyclooxygenase-1 in immediate prostaglandin E2 biosynthesis. J Biol Chem 275:32775–32782. 10.1074/jbc.M003504200 [DOI] [PubMed] [Google Scholar]
- Teng XW, Abu-Mellal AK, Davies NM (2003) Formulation dependent pharmacokinetics, bioavailability and renal toxicity of a selective cyclooxygenase-1 inhibitor SC-560 in the rat. J Pharm Pharmacol Sci 6:205–210. [PubMed] [Google Scholar]
- Tohgi H, Abe T, Saheki M, Hamato F, Sasaki K, Takahashi S (1995) Reduced and oxidized forms of glutathione and alpha-tocopherol in the cerebrospinal fluid of parkinsonian patients: comparison between before and after l-dopa treatment. Neurosci Lett 184:21–24. 10.1016/0304-3940(94)11158-F [DOI] [PubMed] [Google Scholar]
- Tohgi H, Abe T, Yamazaki K, Murata T, Ishizaki E, Isobe C (1999) Increase in oxidized NO products and reduction in oxidized glutathione in cerebrospinal fluid from patients with sporadic form of amyotrophic lateral sclerosis. Neurosci Lett 260:204–206. 10.1016/S0304-3940(98)00986-0 [DOI] [PubMed] [Google Scholar]
- Turovsky E, Theparambil SM, Kasymov V, Deitmer JW, Del Arroyo AG, Ackland GL, Corneveaux JJ, Allen AN, Huentelman MJ, Kasparov S, Marina N, Gourine AV (2016) Mechanisms of CO2/H+ sensitivity of astrocytes. J Neurosci 36:10750–10758. 10.1523/JNEUROSCI.1281-16.2016 [DOI] [PMC free article] [PubMed] [Google Scholar]
- Tuure L, Hämäläinen M, Moilanen T, Moilanen E (2015) Aurothiomalate inhibits the expression of mPGES-1 in primary human chondrocytes. Scand J Rheumatol 44:74–79. 10.3109/03009742.2014.927917 [DOI] [PubMed] [Google Scholar]
- Wagerle LC, Degiulio PA (1994) Indomethacin-sensitive CO2 reactivity of cerebral arterioles is restored by vasodilator prostaglandin. J Physiol 266:H1332–H1338. [DOI] [PubMed] [Google Scholar]
- Wagerle LC, Mishra OP (1988) Mechanism of CO2 response in cerebral arteries of the newborn pig: role of phospholipase, cyclooxygenase, and lipoxygenase pathways. Circ Res 62:1019–1026. 10.1161/01.RES.62.5.1019 [DOI] [PubMed] [Google Scholar]
- Zhang C, Rodriguez C, Spaulding J, Aw TY, Feng J (2012) Age-dependent and tissue-related glutathione redox status in a mouse model of Alzheimer's disease. J Alzheimers Dis 28:655–666. 10.3233/JAD-2011-111244 [DOI] [PMC free article] [PubMed] [Google Scholar]
- Zhang YH, Lu J, Elmquist JK, Saper CB (2003) Specific roles of cyclooxygenase-1 and cyclooxygenase-2 in lipopolysaccharide-induced fever and Fos expression in rat brain. J Comp Neurol 463:3–12. 10.1002/cne.10743 [DOI] [PubMed] [Google Scholar]
- Zhang Y, Chen K, Sloan SA, Bennett ML, Scholze AR, O'Keeffe S, Phatnani HP, Guarnieri P, Caneda C, Ruderisch N, Deng S, Liddelow SA, Zhang C, Daneman R, Maniatis T, Barres BA, Wu JQ (2014) An RNA-sequencing transcriptome and splicing database of glia, neurons, and vascular cells of the cerebral cortex. J Neurosci 34:11929–11947. 10.1523/JNEUROSCI.1860-14.2014 [DOI] [PMC free article] [PubMed] [Google Scholar]
- Zonta M, Angulo MC, Gobbo S, Rosengarten B, Hossmann KA, Pozzan T, Carmignoto G (2003) Neuron-to-astrocyte signaling is central to the dynamic control of brain microcirculation. Nat Neurosci 6:43–50. 10.1038/nn980 [DOI] [PubMed] [Google Scholar]