Abstract
Graphene-based material (GBM) samples acquired from commercial sources are investigated using X-ray diffraction (XRD). Of the 18 GBM samples investigated here, seven samples show XRD patterns with features characteristic of the graphite structure. The XRD patterns of the seven samples are analyzed showing the presence of both the ABA (2H) structure and the ABCA (3R) structure. After de-convoluting the (101) lines of the 2H and 3R structures, the areas under the peaks are used to determine the relative concentrations of the 2H and 3R phases present, typically yielding the ratio 60/40 for 2H/3R. The presence of the 3R structure is important since the 3R structure is a semiconductor with tunable band gap and it is less stable than the 2H structure. The number of layers determined from the analysis of the XRD data varies between 65 and 109 for different samples yielding thickness of the graphite sheets varying between 22 nm and 37 nm. Scanning electron microscopy and transmission electron microscopy of three representative samples confirms the sheet-like morphology and stacking of the graphene layers in the samples. Relevance of these results in connection with their potential applications and toxicology is briefly discussed.
1. Introduction
Since the first emergence of graphene as a material of great scientific and technological interest in 2004 [1,2], publications on graphene-based materials (GBM) continue to fill the pages of journals and books. A number of reviews [3–5] and books [6–9] on the GBM properties are now available. A single layer of graphene has closed-packed structure of graphite with sp2 in-plane bonding between the carbon atoms. In multilayer graphene-materials, it is expected that the adjacent graphene layers are bound by the weaker van der Waals forces as in graphite.
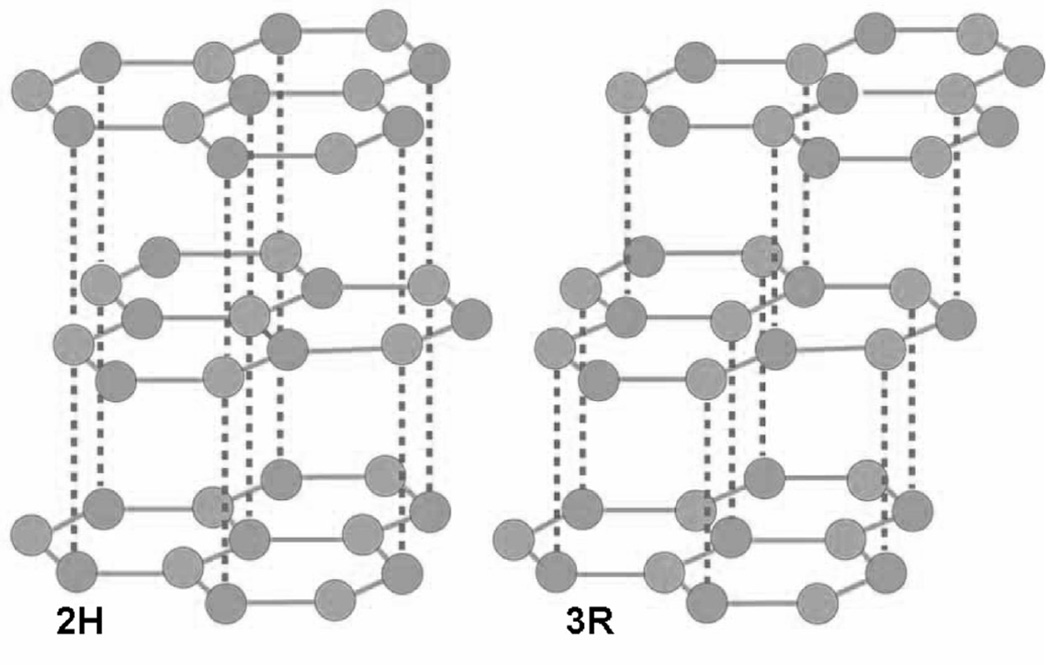
With the increase in interest in the GBM technical applications employing their unique electrical, optical, thermal and mechanical properties [3–9], concern has arisen on the related issue of GBM toxicology [10–13]. With the availability of GBM from a number of commercial sources these days, it is important to determine the structural properties of these materials. In this connection, we acquired 18 commercially available GBM samples generically labeled either as graphene nanoplates, graphene oxide, graphene nanopowder, or carboxyl graphene and investigated their structural properties using X-ray diffraction (XRD) supplemented by scanning electron microscopy (SEM) and transmission electron microscopy (TEM). A major conclusion from our investigations is that out of the 18 samples, seven (7) samples are multilayer graphene which contain not only the conventional Bernal ABAB … structure (2H) but also the ABCA (3R) structure with rhombohedral unit cell (Fig. 1). In addition, it is shown here that the relative concentrations of the 2H and 3R phases in these seven samples can be determined from XRD by using the intensities (areas under the peaks) of the appropriate lines in the XRD patterns after deconvolution of these lines. To the best of our knowledge, such quantification of the 2H and 3R phases in graphene-based materials has not been reported before. The importance of the 3R stacking for applications has become apparent from recent reports in which the 3R phase has been shown to be a semiconductor with a band gap of 6 meV whereas graphene layers with 2H stacking remain semimetal with no gap [14–16]. The presence of a tunable band-gap is essential for many applications of these materials. Using the width of the appropriate XRD lines, we have also determined the apparent crystallite size Lc (La) along the c(a) directions and from these, the number of graphene layers present in these commercial GBM samples. SEM and TEM of three representative samples among the seven samples shows the layered structures with many graphene layers stacked upon each other. Finally, classification of the seven commercial samples is discussed according to the nomenclature schemes proposed recently [17,18]. An interesting aspect of this work is that the names given to the samples by the commercial suppliers in most cases differ from the names assigned here to the samples using the classification scheme recently proposed in Carbon [17].
Fig. 1.
Arrangements of the hexagonal layers in the 2H and 3R graphite structures.
2. Basis for classification and analysis
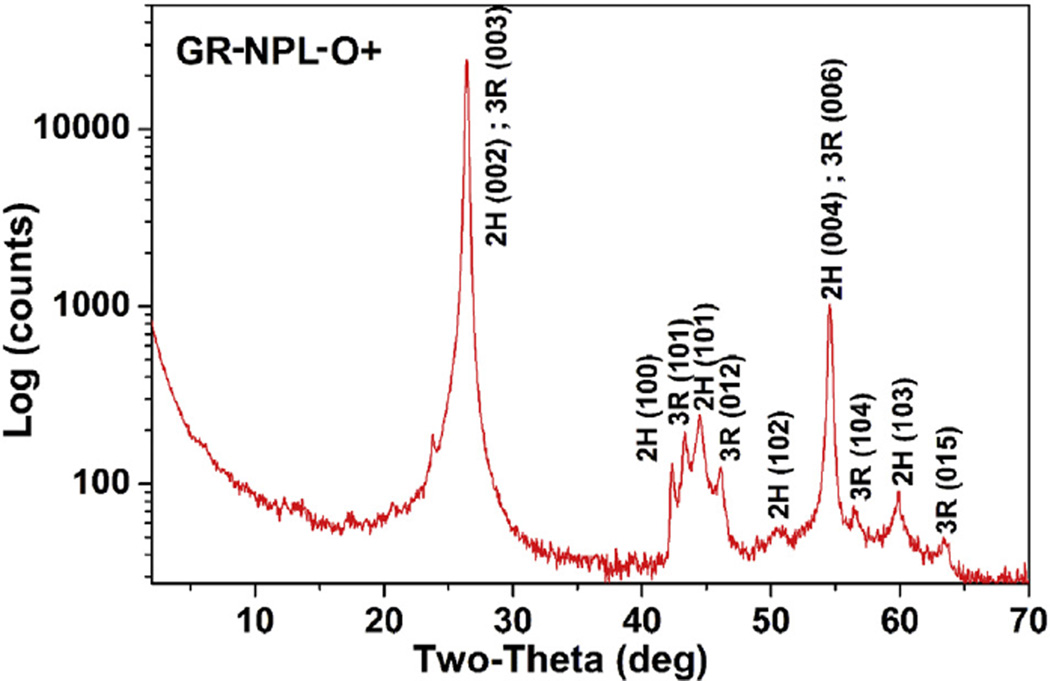
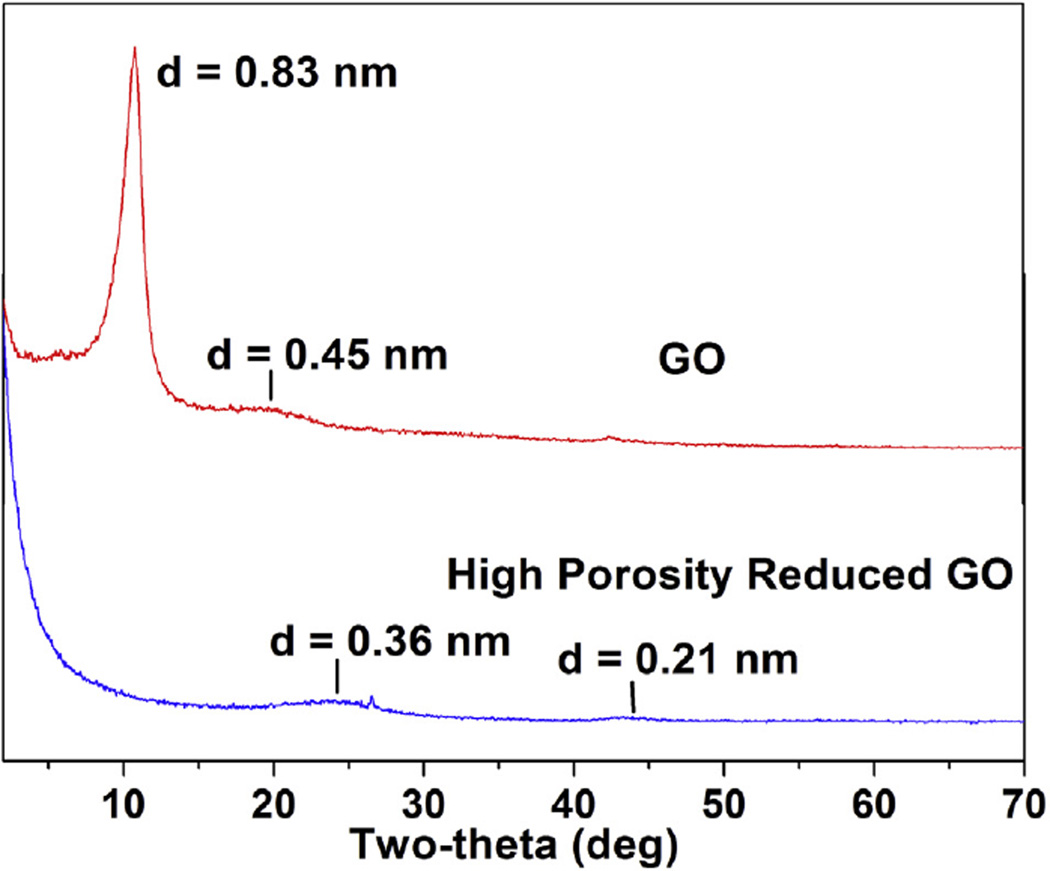
The analysis of the XRD patterns is based on the well-known Bragg law: 2d sinθ = n λ where n is the order of diffraction, d is the spacing between the (hkl) planes, θ is the Bragg angle and λ= 0.154185 nm is the CuKα wavelength of the X-rays used in our experiments (Rigaku D-Max diffractometer). Based on the XRD spectra, the eighteen (18) commercial samples of graphene-based materials tested in this work are grouped into three categories: (i) seven (7) samples of Table 1 with XRD spectra of multilayered graphene with the typical XRD pattern of one sample shown in Fig. 2; (ii) eight (8) samples with XRD spectra characteristic of graphene oxide (GO) shown in Fig. 3, and (iii) three (3) samples whose XRD spectra show lack of the layered structure such as the spectra of reduced GO shown in Fig. 3. For samples of GO in category (ii), the representative XRD pattern of one sample shows a line with d-spacing >0.8 nm, the larger d-spacing compared to d = 0.335 nm for graphite resulting from the intercalated hydroxyl and epoxy groups on both sides of graphene sheets. The samples in category (iii) yield spectra different from the above two cases, as for example shown for a commercial sample of reduced GO in Fig. 3. Since our focus in this paper is on determining the concentrations of 2H and 3R phases in these samples, and the XRD patterns of samples in categories (ii) and (iii) lack the features characteristic of the 2H and 3R graphite, no further discussion on these samples is included here. Analysis of the results on the samples in categories (ii) and (iii) will be presented in a separate publication in due course of time.
Table 1.
Experimental parameters of the seven (7) commercial samples of graphene-based nano-materials determined from the observed 2H and 3R structures in XRD. The top (bottom) numbers for La and Na for each sample in the last two columns are for the 2H (3R) phase with the numbers in () representing estimated uncertainties.
| Sample name | Commercial name | Commercial source | 2H/3R (%) |
Lc (nm) | Nc | La (nm) | Na |
|---|---|---|---|---|---|---|---|
| GR-NPL | Graphene nanoplates (thickness 2–10 nm) |
ACS materials | 70/30 | 29.3 | 87 | 17(3) 26(2) |
69(12) 103(8) |
| GR-NP-12nm | Graphene nanopowder 12 nm flakes:A03 |
Graphene supermarket | 62/38 | 28.1 | 83 | 24(2) 20(1) |
97(8) 79(4) |
| GR-NP-8nm | Graphene nanopowder 8 nmflakes: A02 |
Graphene supermarket | 63/37 | 22.0 | 65 | 19(1) 23(2) |
77(4) 91(8) |
| GR-NP-ML-FL | Graphene nanopowder, multilayer flakes: A04 | Graphene supermarket | 58/42 | 21.8 | 65 | 18(2) 18(1) |
73(8) 71(4) |
| GR-NPL-COOH | Graphene nanoplates Grade 4, 99% COOH rich |
Cheaptubes | 60/40 | 36.7 | 109 | 22(1) 24(2) |
89(4) 95(8) |
| GR-NPL-N2 | Graphene nanoplates grade 4, 99% N2 rich | Cheaptubes | 58/42 | 29.8 | 88 | 20(1) 24(2) |
81(4) 95(8) |
| GR-NPL-O+ | Graphene nanoplates grade 4, 99% 0+ rich | Cheaptubes | 64/36 | 27.2 | 81 | 19(1) 26(1) |
77(4) 103(4) |
Fig. 2.
X-ray diffraction pattern of one of the samples of Table 1. The Miller indices of the observed lines for the 2H and 3R phases are respectively based on ICDD-PDF #-041-1487 and # 026-1079. (A colour version of this figure can be viewed online.)
Fig. 3.
X-ray diffraction patterns of sample of graphene oxide (GO) obtained from ACS Materials LLC and sample of high porosity reduced GO obtained from Graphene Supermarket. The d-spacing (in nm) of the observed peaks are listed on the peaks. (A colour version of this figure can be viewed online.)
The seven samples in category (i) whose XRD spectra are analyzed in detail here are listed in Table 1. The method of synthesis of these samples as provided by the manufacturers are described next although the exact details of these processes are not known since they are considered proprietary by the manufacturers. The sample of the graphene nanoplates (2–10 nm) from ACS materials was made by exfoliation of GO followed by reduction to remove oxygen. The graphene nanopowder (12 nm flakes) from Graphene Supermarket was made by thermal splitting of graphite whereas the graphene nanopowder (8 nm) and graphene nanopowder multilayer flakes were made from graphite using a “top-down” process. The three samples from Cheaptubes in Table 1 were prepared from exfoliation of Sri Lankan crystalline graphite.
The quantities listed in Table 1 include the apparent crystallite size Lc (La) along the c (a) directions which are determined from the relations [19,20]:
| (1) |
Here β is the instrument-corrected full-width at half maximum (FWHM) of the (002) line near 2θ ≈ 26° for determining Lc whereas β for the (101) line is used similarly for determining La (Fig. 2). The number of layers Nc along the c-axis is given by Nc = Lc/d(002) whereas Na = La/a gives the number of unit cells along the a-axis. For samples of Table 1, the calculated value of d(002) = 0.338 nm is obtained using the line near 2θ ≈ 26° and the calculated value of a = 0.247 nm (0.253 nm) for the 2H (3R) phase is obtained using the (101) lines. These magnitudes are used in the calculation of Nc and Na listed in Table 1. For comparison, d(002) = 0.335 nm and a = 0.24614 nm for graphite [19,20].
3. 2H and 3R phases in commercial graphene-based materials
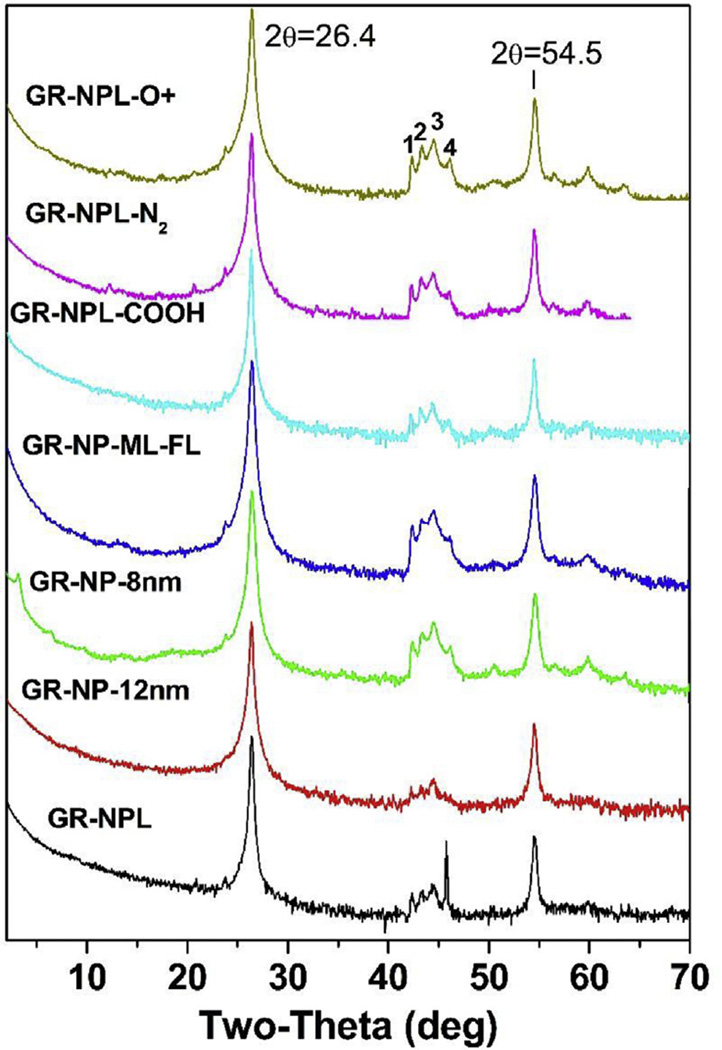
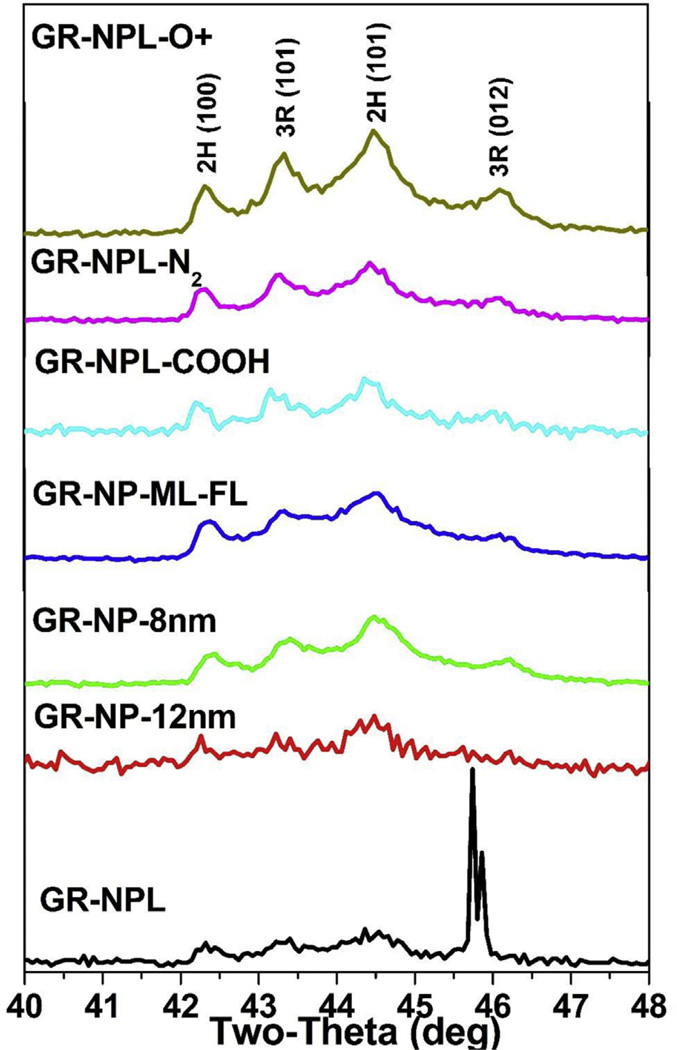
Listed in Table 1 are the seven (7) samples whose XRD patterns are similar to that shown in Fig. 2 for one of the samples as a representative. The lines are indexed according to the 2H and 3R structures of graphite (see Fig. 1.) A log scale for the photon intensity is used in Fig. 2 to highlight the weaker lines. The XRD patterns of all seven samples are compared in Fig. 4, again using the log scale for intensity. The presence of both the 2H and 3R phases in these samples can be ascertained from the four line pattern observed between 2θ = 42° and 47° (Fig. 4). A similar four-line pattern is evident in a published paper on graphene [21]. However, the identification and quantification of the 3R phase relative to the 2H phase in multilayered graphene presented below has not been reported before to the best of our knowledge, although the presence of the 3R phase in some graphite samples has been reported before [22]. The presence and quantification of the 3R phase is important since the 3R phase is less stable than the 2H phase and it transforms to the 2H phase at temperatures above about 1000 °C [22,23]. As a result, the breaking and rearrangement of bonds is easier in the 3R structure than in the 2H structure. The importance of the 3R phase for device applications has already been noted in the Introduction. More recent developments in this connection include reports of surface superconductivity in the 3R phase [24] and proximity induced room temperature ferromagnetism in a commercial multilayered graphene sample when in contact with magnetite particles [25].
Fig. 4.
XRD patterns of the seven samples of Table 1 are compared with the name of a sample listed on each plot. The plots are stacked vertically for comparison and log scale is used for counts as in Fig. 2. The region of the lines marked 1,2,3,4 is expanded in Fig. 5. (A colour version of this figure can be viewed online.)
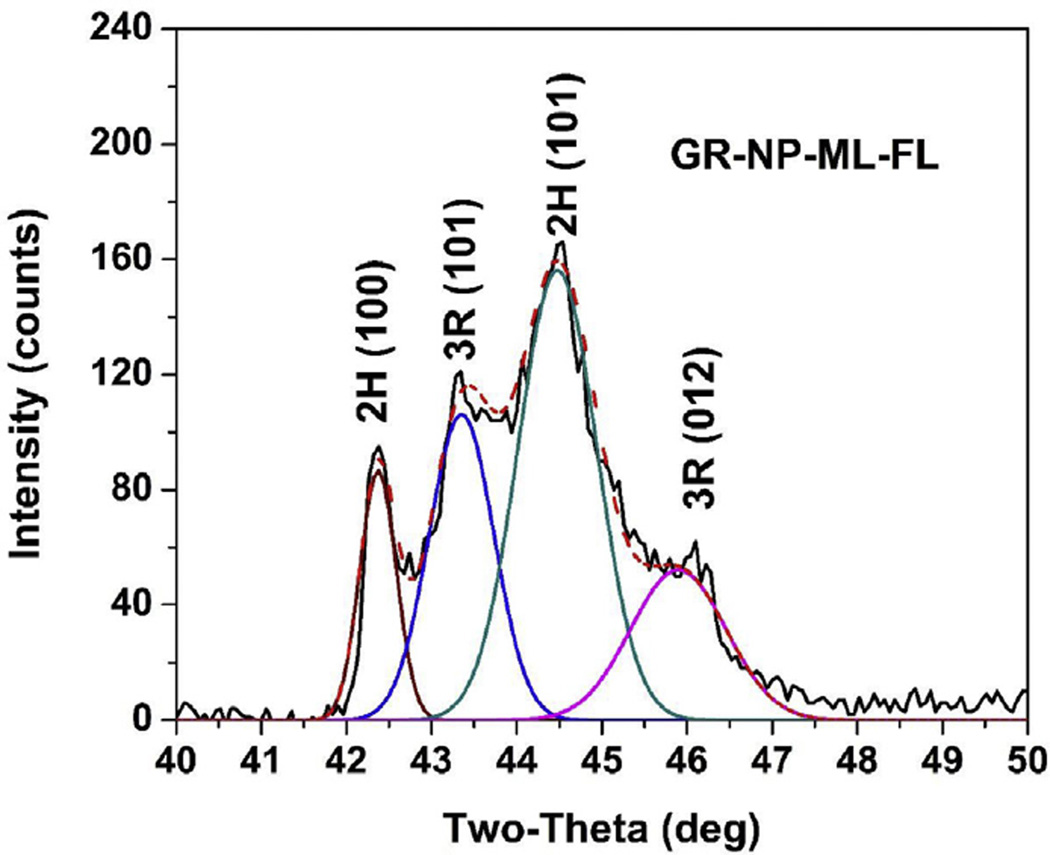
To distinguish between the 2H and 3R phases, the line near 2θ~26° cannot be used since the (002) line from the 2H phase at 2θ = 26.38° cannot be easily resolved from the nearby (003) line from the 3R phases at 2θ = 26.60°. However, as evident from Fig. 5 for all the seven samples, the (101) lines from the 2H and 3R phases near 2θ = 45° are distinguishable. To resolve the lines and determine the areas under the curves as a measure of their intensity, we used the internet-accessed software ‘Magic Plot 2.5.1’ and Gaussian line-shape and the results are shown in Fig. 6 for one representative sample viz. graphene nanopowder multilayer flakes: A04 (GR-NP-ML-FL). Similar analysis was carried out for all the samples using ‘Magic Plot 2.5.1’ as well as the software ‘OriginPro 8’ SR3. The middle two lines are the (101) lines for the 3R and 2H phases respectively as shown in Fig. 5 and in Fig. 6. The ratio of the areas under these two lines are used as relative percentages of the 2H and 3R phases respectively with the magnitudes of these values given in Table 1. These ratios of the 2H/3R intensities vary between 70/30 to 58/42 for the seven samples. Since the 2H (3R) structure repeats after two (three) graphene layers as shown in Fig. 1, it follows that for the ratio 2H/3R = 60/40, the number of carbon atoms in the sample from the 2H phase and 3R phase will be exactly equal. This leads to the conclusion that in these commercially prepared samples of multilayered graphene, the 2H and 3R phases take up essentially equal number of carbon atoms. This quantification of the 2H and 3R phases in these samples is an important contribution of this work.
Fig. 5.
Expanded view of the XRD lines for the seven samples in the region of 2θ = 40° to 48° with the Miller indices of the lines listed at the top. (A colour version of this figure can be viewed online.)
Fig. 6.
Illustration of the deconvolution of the lines of one sample in the region of 2θ = 40° to 48°. Areas under the peaks marked 2H (101) and 3R (101) are used to determine the relative % of 2H and 3R phases listed in Table 1. (A colour version of this figure can be viewed online.)
As noted earlier, the number of layers Nc = Lc/d(002) where Lc was determined from using Eq. (1) with d(002) = 0.338 nm determined from the position of the strong line near 2θ ~ 26°. Since this line is a composite of the 2H (002) line and 3R (003) line, the magnitudes of Nc and Lc listed in Table 1 may have some errors which are difficult to determine accurately. Nevertheless, it is certain that the samples of Table 1 contain several dozen layers of graphene and they contain both the 2H and 3R phases. The magnitudes of La was determined similarly using Eq. (1) with β (FWHM) used for the corresponding (101) lines at 2θ = 44.5° for the 2H and 2θ = 43.5° for the 3R phase. The top (bottom) numbers for La and Na for each sample in Table 1 are for the 2H (3R) phase. The numbers in Table 1 are the averages of the two determinations using ‘Magic Plot 2.5.1’ and ‘OriginPro 8 SR3’ soft-wares with the estimated uncertainties given in parenthesis. In most cases, the numbers Nc and Na are about the same, varying between 65 and 109. The thickness of these nanoplates given by Lc in Table 1 varies between 22 nm and 37 nm which is several times larger than the magnitude of about 10 nm listed by the commercial suppliers.
4. Scanning electron microscopy (SEM) and transmission electron microscopy (TEM)
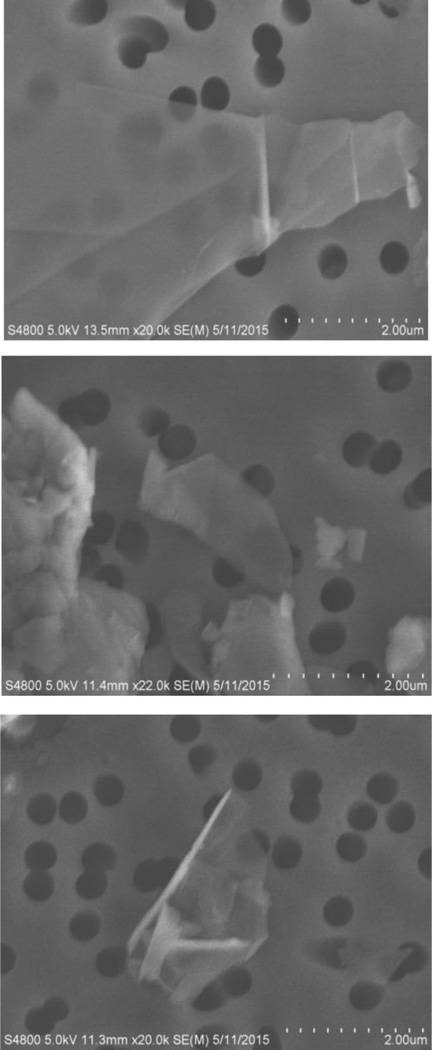
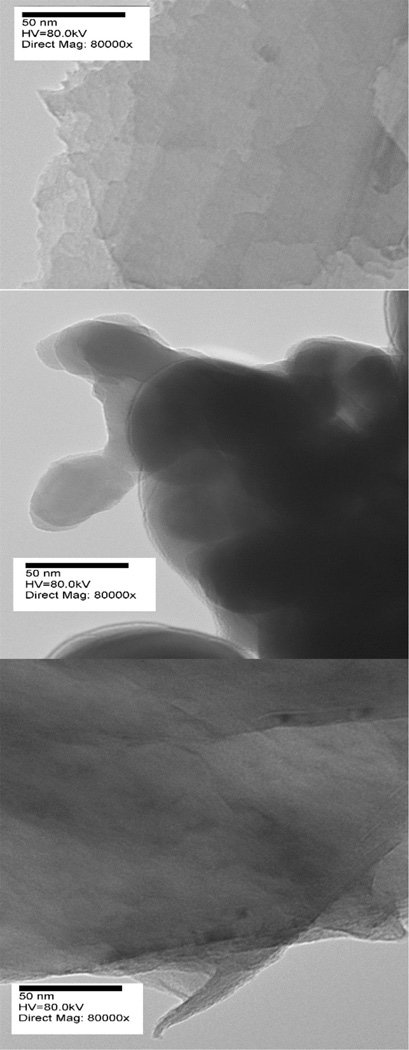
Morphologies of three representative samples of Table 1 were evaluated by electron microscopy. For this purpose, suspensions of the samples were prepared by adding powders to an aqueous solution of 2% pluronics F-68 (Gibco, Grand Island, NY) in calcium and magnesium free phosphate buffered saline (Gibco). Suspensions were sonicated on ice for 10 min (delivered energy input = 3000 J) to disperse the samples. For SEM, a drop of suspension was filtered through a 0.4 µm pore size track-etched polycarbonate membrane (Sterlitech, Kent, WA) under light vacuum, air dried, and mounted on an aluminum stub. For TEM, dry powders were adhered to 3-mm copper grids with lacey carbon support (Ted Pella Inc., Redding, CA). Prepared samples were analyzed using a field emission SEM (S-4800, Hitachi, Tokyo, Japan) or TEM (JEM-1220, JEOL, Tokyo, Japan). The SEM images of the three samples are shown in Fig. 7 and the TEM images of the same three samples are shown in Fig. 8. These images show the plate-like morphologies of the samples. However, it is difficult to accurately determine the thickness of these plates for comparison with the results determined from XRD since edge-on micrographs are needed for that purpose. Because of the layered structures of the samples, they tend to lie flat making it difficult to determine their thickness. However, near the edges of the TEM images, it is evident that samples consist of many layers of graphene stacked on top of each other. In some cases, the curling of the layers near the edges is also evident. These results are consistent with the more quantitative information provided here by analysis of the XRD patterns on the thickness of the layers.
Fig. 7.
Scanning electron micrographs of three samples of Table 1; Top: GR-NPL (Graphene nanoplatelets, thickness 2–10 nm, ACS Materials); Middle: GR-NPL-O+ (Graphene Nanoplatelets grade 4, 99% O+ rich, Cheaptubes); Bottom: GR-NP-ML-FL (Graphene nanopowder, multilayer flakes: A04, Graphene Supermarket). The distance between two divisions in the scale is 200 nm.
Fig. 8.
Transmission electron micrographs of the same three samples as in Fig. 7. Stacking of the layers and some curling near the edges are evident. The length of the scale bars is 50 nm.
5. Classification of the commercial graphene-based materials
For the seven samples listed in Table 1, the XRD patterns shown in Figs. 4 and 5 are qualitatively similar. Even the number of graphene layers determined from analysis of the XRD patterns and listed in Table 1 are not significantly different, varying from a low of about 65 for the nano-powder flakes to 109 for a sample listed as “Graphene nano-plates, Grade 4, 99% COOH rich”. Based on the definitions given in the editorial in the journal Carbon [17], these samples should be categorized as graphite nano-plates or graphite nano-sheets (or nano-flakes). If the number of layers were less than ten, then according to the suggested nomenclature in Ref. 17, it would have been proper to label these samples as multilayer graphene. Studies have not yet been done to determine whether differences in 2H and 3R structures are important for toxicity. Nonetheless, the potential for misclassification relative to the labels assigned by the manufacturers has important implications because layer thickness influences rigidity as well as surface area per unit volume, both of which may influence interactions with cells and biological molecules [10].
6. Conclusions
X-ray diffraction on seven (7) commercially available GBM samples has been used to show that these samples contain both the 2H and 3R phases of graphite approximately in the ratio of 60/40. In addition, it is shown that these samples contain several dozen layers of graphene with lateral structural order of about 20 nm. Based on these observations and the new proposed nomenclature, these samples are best characterized as graphite nanoplates or nanosheets rather than graphene nanosheets. The observation and quantification of both the 2H and 3R phases in these samples is an important result of this work. Morphologies of three representative samples determined by SEM and TEM confirms the sheet-like features of these materials with many graphene sheets stacked on top of each other.
Acknowledgments
MSS thanks Dr. V. Narang for technical assistance. The research at West Virginia University was supported in part under contract #212-2013-M-54915 from NIOSH/CDC. The research at NIOSH/CDC was funded by the U.S. National Toxicology Program under Inter-Agency Agreement #11-NS11-04-M01. The findings and conclusions in this report are those of the authors and do not necessarily represent the views of the National Institute for Occupational Safety and Health.
References
- 1.Novoselov KS, Geim AK, Morozov SV, Jiang D, Zhang Y, Dubonos SV, et al. Electric field effect in atomically thin carbon films. Science. 2004;306:666–669. doi: 10.1126/science.1102896. [DOI] [PubMed] [Google Scholar]
- 2.Novoselov KS, Geim AK, Morozov SV, Jiang D, Katsnelson MI, Grigorieva IV, et al. Two-dimensional gas of massless Dirac fermions in graphene. Nature. 2005;438:197–200. doi: 10.1038/nature04233. [DOI] [PubMed] [Google Scholar]
- 3.Huang X, Yin Z, Wu S, Qi X, He Q, Zhang Q, et al. Graphene-based materials: synthesis, characterization, properties, and applications. Small. 2012;7:1876–1902. doi: 10.1002/smll.201002009. [DOI] [PubMed] [Google Scholar]
- 4.Craciun MF, Khrapach I, Barnes MD, Russo S. Properties and applications of chemically functionalized graphene. J. Phys. Condens. Matter. 2013;25:423201. doi: 10.1088/0953-8984/25/42/423201. (22pp) [DOI] [PubMed] [Google Scholar]
- 5.Pesin D, MacDonald AH. Spintronics and pseudo-spintronics in graphene and topological insulators. Nat. Mater. 2012;11:409–416. doi: 10.1038/nmat3305. [DOI] [PubMed] [Google Scholar]
- 6.Rao CNR, Sood AK, editors. Graphene: Synthesis, Properties and Phenomena. Weinhelm, Germany: Wiley-VCH Verlag & Co; 2013. [Google Scholar]
- 7.Warner JH, Schaffel F, Rummeli MH, Bachmatiuk A. Graphene: Fundamentals and Emergent Applications. Newnes. 2012 [Google Scholar]
- 8.Ray S. Applications of Graphene and Graphene Oxide Based Nanomaterials. William Andrew Publisher; 2015. [Google Scholar]
- 9.Wolf EL. Graphene: a New Paradigm in Condensed Matter and Device Physics. Oxford University Press; 2013. [Google Scholar]
- 10.Sanchez VC, Jachak A, Hurt RH, Kane AB. Biological interactions of graphene-family nanomaterials: an interdisciplinary review. Chem. Res. Toxicol. 2012;25:15–34. doi: 10.1021/tx200339h. [DOI] [PMC free article] [PubMed] [Google Scholar]
- 11.Duch MC, Scott Budinger GR, Liang YT, Soberanes S, Urich D, Chiarella SE, et al. Minimizing oxidation and stable nanoscale dispersion improves the biocompatibility of graphene in the lung. Nano Lett. 2011;11:5201–5207. doi: 10.1021/nl202515a. [DOI] [PMC free article] [PubMed] [Google Scholar]
- 12.Xu C, Wang J, Xu Y, Shang G, Wang R, Lin Y. Review of and perspective on the toxicology of graphene-based materials. Curr. Drug Metab. 2013;14:863–871. doi: 10.2174/138920021131400108. [DOI] [PubMed] [Google Scholar]
- 13.Shin JH, Han SG, Kim JK, Kim BW, Hwang JH, Lee JS, et al. 5-day repeated inhalation and 28-day post-exposure study of graphene. Nanotoxicology. 2014 doi: 10.3109/17435390.2014.998306. http://dx.doi.org/10.3109/17435390.2014.998306. [DOI] [PubMed] [Google Scholar]
- 14.Craciun MF, Russo S, Yamamoto M, Oostinga JB, Morpurgo AF, Tarucha S. Trilayer graphene is a semimetal with a gate-tunable band overlap. Nat. Nanotechnol. 2009;4:383–388. doi: 10.1038/nnano.2009.89. [DOI] [PubMed] [Google Scholar]
- 15.Khodkov T, Khrapach I, Craciun MF, Russo S. Direct observation of a gate tunable bandgap in electrical transport in ABC-trilayer graphene. Nano Lett. 2015;15:4429–4433. doi: 10.1021/acs.nanolett.5b00772. [DOI] [PubMed] [Google Scholar]
- 16.Liu CH, Li Z, Mak KF, Cappelluti E, Heinz TF. Observation of an electrically tunable band gap in trilayer graphene. Nat. Phys. 2011;7:944–947. [Google Scholar]
- 17.Bianco A, Cheng H-W, Enoki T, Gogotsi Y, Hurt RH, Koratkar N, et al. All in the graphene-family: a recommended nomenclature for two-dimensional carbon materials. Carbon. 2013;65:1–6. [Google Scholar]
- 18.Wick P, Louw-Gaume AE, Kucki M, Krug HF, Kostarelos K, Hadeel B, et al. Classification framework for graphene-based materials. Agnew. Chem. Int. Ed. 2014;53:7714–7718. doi: 10.1002/anie.201403335. [DOI] [PubMed] [Google Scholar]
- 19.Seehra MS, Pavlovic AS. X-ray diffraction, thermal expansion, electrical conductivity and optical microscopy studies of coal-based graphites. Carbon. 1993;31:557–564. [Google Scholar]
- 20.Suresh Babu V, Seehra MS. Modeling of disorder and X-ray diffraction in coal-based graphitic carbons. Carbon. 1996;34:1259–1265. [Google Scholar]
- 21.Subrahmanyam RS, Vivekchand SRC, Govindaraj A, Rao CNR. A study of graphenes prepared by different methods: characterization, properties and solubilization. J. Mater. Chem. 2008;18:1517–1523. [Google Scholar]
- 22.Shi H, Barker J, Saidi MY, Koksbang R, Morris L. Graphite structures and lithium intercalation. J. Power Sources. 1997;68:291–295. [Google Scholar]
- 23.Matuyama E. Rate of transformation of rhombohedral graphite at high temperatures. Nature. 1956;178:140503/1–140503/4. [Google Scholar]
- 24.Kopnin NB, Ijas M, Harju A, Heikkila TT. High temperature surface superconductivity in rhombohedral graphite. Phys. Rev. B. 2013;87:140503/1–140503/4. [Google Scholar]
- 25.Seifu D, Neupane S, Giri L, Karna SP, Hong H, Seehra MS. Multilayered graphene acquires ferromagnetism in proximity with magnetite particles. Appl. Phys. Lett. 2015;106:212401/1–212401/5. [Google Scholar]


