

Abstract
Phosphatidic acid (PA) is the simplest phospholipid naturally existing in living organisms, but it constitutes only a minor fraction of total cell lipids. PA has attracted considerable attention because it is a phospholipid precursor, a lipid second messenger, and a modulator of membrane shape, and it has thus been proposed to play key cellular functions. The dynamics of PA in cells and in subcellular compartments, however, remains an open question. The recent generation of fluorescent probes for PA, by fusing GFP to PA-binding domains, has provided direct evidence for PA dynamics in different intracellular compartments. Here, three PA sensors were characterized in vitro, and their preferences for different PA species in particular lipidic environments were compared. In addition, the localization of PA in macrophages during frustrated phagocytosis was examined using these PA sensors and was combined with a lipidomic analysis of PA in intracellular compartments. The results indicate that the PA sensors display some preferences for specific PA species, depending on the lipid environment, and the localization study in macrophages revealed the complexity of intracellular PA dynamics.
Keywords: biosensor, fatty acid, lipid signaling, phagocytosis, phosphatidic acid, Phospholipase D
Introduction
Phosphatidic acid (PA)2 has emerged as a new class of lipid mediators involved in diverse cellular functions through either structural or signaling modes of action. Structural PA is a precursor of glycerophospholipids (1). In mammals, structural PA is synthesized through two successive acylation reactions and can then be converted by phosphatidic acid phosphohydrolase to diacyglycerol (DAG), which is an important source for the biosynthesis of triacylglycerols and phospholipids (2). Three alternative biosynthetic pathways produce signaling PA (2). The first involves phospholipase D (PLD), which catalyzes the hydrolysis of the distal phosphodiester bond in phosphatidylcholine to form PA and choline. Phosphorylation of diacylglycerol by DAG kinase (DGK) constitutes the second pathway to produce PA, and acylation of lyso-PA by lyso-PA-acyltransferases (LPAAT) constitutes the third. The complexity and diversity of the PLD, DGK, and LPAAT families suggest that they are involved in specific cellular functions that are probably not redundant. Signaling PA generated by these three enzymes has been implicated in cytoskeletal organization, cell survival and proliferation, and membrane and vesicle trafficking (3). Yet, because PA is implicated, either directly or indirectly, in the biosynthesis of most phospholipids and triacylglycerols, its potential signaling functions may not be mutually exclusive from its intermediate biosynthetic role.
At the molecular level, PA has been found to interact with or regulate at least 50 different partners present in all organisms from yeasts and plants to mammals (4). These include GTPases, kinases, phosphatases, nucleotide-binding proteins, and phospholipases (4). PA is a negatively charged phospholipid with a very small headgroup, which imposes a cone-shaped structure that can potentially affect membrane curvature (5, 6). Thus, the search for a PA-binding motif among PA effectors is hampered by the fact that it is not always clear whether a given protein has specific affinity for PA or just an overall affinity for a negatively charged membrane topology. Hence, analyses of PA-binding polypeptide fragments have led to the idea that the only feature related to PA binding is a short stretch of positively charged residues (4). The actual view is that PA effectors do not contain a well defined PA-recognition structural motif, but use either positively charged or surface-exposed hydrophobic residues, or a combination of both for binding to PA.
In analogy with other lipid-signaling reactions, the interaction of proteins with PA often triggers their translocation from the cytosol to a specific membrane sub-compartment. However, PA can also directly regulate the activity of enzymes and trans-membrane proteins (7). For example, reconstitution studies have shown that PA inhibits the activity of the sarcoplasmic reticulum ATPase (8) and modulates the gating kinetics of potassium channels (9, 10). PA can also regulate small GTPases by modulating their regulatory proteins, guanine nucleotide exchange factors, and GTPase-activating proteins (11). In terms of localization as well as function, PA effectors are found in almost all cellular compartments and are associated with a variety of cellular functions, although many of them regulate actin dynamics and membrane trafficking (3, 4, 7).
To date, the number of PA-specific probes that can be employed to gain insight into the localization and function of PA-binding proteins and/or image dynamics of PA pools in living cells is rather limited. Probes derived from the PA-binding domains (PABD) of the yeast protein Spo20p and Raf1 have been the most widely used. When expressed in cells, PABDs often localize to different subcellular compartments. For instance, the PABD of Spo20p (Spo20p-PABD) has been mostly described in the nucleus and plasma membrane in mammalian cells (6, 12), whereas the PABD of the yeast protein Opi1p (Opi1p-PABD) is reported to shuttle between the endoplasmic reticulum (ER) and the nucleus (13), and the PABD of the mammalian protein PDE4A1 (PDE4A1-PABD) is often found associated with the Golgi apparatus (14). Although it cannot be excluded that these different localizations result from cell-specific expression, it may also suggest that PA probes are able to sense different pools of PA in a specific environment (15). To probe this idea, we performed an in vitro characterization and comparison of the Spo20p, Opi1p, and PDE4A1 PA sensors using a novel semi-quantitative assay. Using macrophages as a cell model, we then investigated the intracellular distribution of the three PABDs and quantified the corresponding PA levels by mass spectrometry analysis. Macrophages internalize and eliminate pathogens and cellular debris using a membrane trafficking process known as phagocytosis. A number of intracellular organelles, including endosomes (16), lysosomes (17), ER (18, 19), and Golgi (20) have been reported to contribute to the formation of the phagosome membrane during particle engulfment. At the molecular level, PLD has been described to be necessary for the formation and maturation of phagosomes along with efficient Fcγ receptor-mediated phagocytosis and has been identified on phagocytic pseudopods that engulf particles (21–24). A comparison of unstimulated macrophages with those undergoing frustrated phagocytosis revealed that the three PABDs are useful tools to localize and distinguish variations in PA levels and species in subcellular compartments.
Results
PABDs of Spo20p, Opi1p, and PDE4A1 Preferentially Bind to PA
In the attempt to characterize and compare biosensors for PA, we prepared GST fusion proteins composed of the PABD of Spo20p (fragment 50–91), Opi1p (fragment 103–191), and PDE4A1 (fragment 1–40). These PABDs were expressed in Escherichia coli as GST fusion proteins and purified, and their interaction with PA was probed using a phospholipid overlay assay. The three PABDs displayed a strong preference for PA over other anionic lipids, at least in a non-membranous environment (Fig. 1A). As well, experiments performed with phospholipids inserted in a membrane using liposome flotation confirmed that the three sensors retained their preference for PA over PI(4,5)P2 (Fig. 1B) and PS, another anionic phospholipid (data not shown).
FIGURE 1.
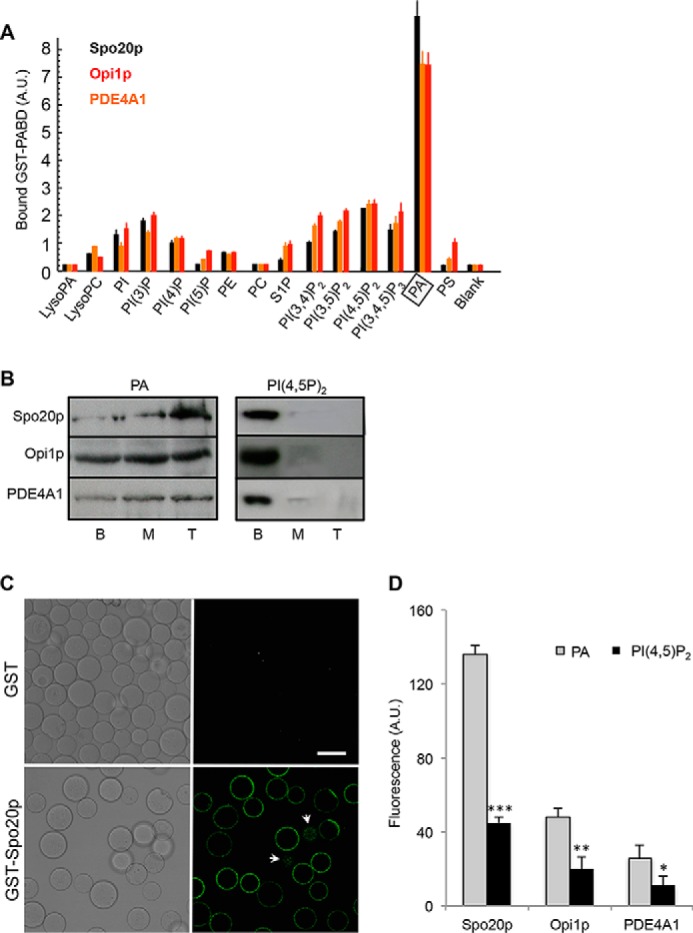
Spo20p-PABD, Opi1p-PABD, and PDE4A1-PABD preferentially bind to PA. A, quantification of Spo20p-PABD, Opi1p-PABD, and PDE4A1-PABD binding to phospholipids on nitrocellulose membrane strips (means ± S.E., n = 4 independent experiments). The binding to GST alone was less than 0.1 A.U., and this background was subtracted from samples. A preference for PA (boxed) was observed for all of these probes. B, liposome flotation assay. To further validate PA specificity for Spo20p-PABD, Opi1p-PABD, and PDE4A1-PABD, each GST probe was incubated with LBB buffer containing fluorescent liposomes (5% PE-NBD, 85% DOPC, and 10% PA, or PI(4,5)P2) and separated on a sucrose density gradient by ultracentrifugation. Equal volumes of the top (T), middle (M), and bottom (B) layers were run on SDS-PAGE and immunoblotted with an anti-GST antibody. More than 95% of the fluorescence was recovered in layers M and T indicating the presence of liposomes in these fractions (n = 3 independent experiments). C, confocal images of GST and GST-Spo20p-PABD coupled to GSH-Sepharose beads after incubation with liposomes (5% PE-NBD, 85% DOPC, and 10% PA). Fluorescent liposomes accumulated on the surface of GST-Spo20p-PABD beads. Arrows indicate dots of fluorescence on the bottom or top of beads. Bar, 50 μm. D, semi-quantitative fluorescent liposome assays with GST-PABD beads and liposomes (5% PE-NBD, 85% DOPC, and 10% PA or PI(4,5)P2). A 10-fold molar excess of PA or PI(4,5)P2 relative to that of GST-PABD was used. Binding of liposomes to GST-PABD beads was estimated by measuring the total fluorescence and subtracting the background (see under “Materials and Methods”). Fluorescence measured when liposomes were incubated with GST alone was around 3 A.U. and was subtracted. Results are presented as means ± S.D. (triplicate measurements pooled from three experiments, *, p > 0.05; **, p > 0.01; and ***, p > 0.001).
To monitor PA binding of the three GST-PABDs in a lipid environment, we developed a semi-quantitative in vitro assay using NBD-labeled liposomes. As shown by confocal microscopy analysis (Fig. 1C), PA-containing fluorescent liposomes specifically bound to GST-Spo20p-PABD linked to GSH-Sepharose beads but not to control GST linked to GSH-Sepharose beads. Based on this observation, the binding of fluorescent liposomes (5% PE-NBD, 85% PC, 10% PA, or PI(4,5)P2) to GST-PABDs linked to GSH-Sepharose beads was monitored by fluorimetry. Although significant binding of PI(4,5)P2 containing liposomes to the three PABDs was detected, our observations clearly indicated a preferential binding of the PA liposomes over the PI(4,5)P2 liposomes in all cases (Fig. 1D). When comparing PA binding to the three PABDs, it appears that Spo20p-PABD is by far the most potent PA sensor (Fig. 1D). The binding of the PA-containing liposomes to the PABDs was greatly reduced by specific point mutations in the PABD affecting either the α-helical conformation (Spo20p-PABD) or the positive charge clusters (Opi1p-PABD and PDE4A1-PABD) (Fig. 2A), indicating that the interaction depended partially on electrostatic interaction but also on the structural conformation of the PABD.
FIGURE 2.

Effect of lipid packing defects on Spo20p-PABD, Opi1p-PABD, and PDE4A1-PABD binding to PA. A, semi-quantitative fluorescent liposome assays with wild-type GST-PABD beads or mutated Spo20p-PABD-(PL67P) beads, Opi1p-PABD-(K126M/R127G) beads, PDE4A1-PABD-(K25A/R26A) beads, and liposomes (5% PE-NBD, 85% DOPC, 10% PA). Results are presented as means ± S.D. (of triplicate measurements pooled from three experiments, *, p > 0.05; **, p > 0.01; and ***, p > 0.001). B, semi-quantitative fluorescent liposome assays with GST-PABD beads and liposomes with variable packing defects. GST-PABD beads (330 pmol) bound to GSH beads were incubated with liposomes containing 5% PE-NBD and 85% DOPC or POPC, in addition to 10% PA (16:0/22:06). Results are presented as means ± S.D. (of triplicate measurements from a representative experiment, n = 3; **, p > 0.01).
PABDs of Spo20p, Opi1p, and PDE4A1 Are Sensitive to the Local Lipid Environment and to PA Species
In a second series of experiments, the influence of the lipid composition was examined using fluorescent liposomes composed of PC with variable degrees of saturation and a polyunsaturated form of PA (16:0/22:6). Two types of liposomes were used as follows: liposomes made with unsaturated PC (dioleoyl-PC, DOPC), and liposomes made with PC having one saturated fatty acyl chain (palmitoyl-oleolyl-PC, POPC). As shown in Fig. 2B, the two types of liposomes bound preferentially to Spo20p-PABD compared with Opi1p-PABD and PDE4A1-PABD. However, binding to Opi1p-PABD-and PDE4A1-PABD was sensitive to the PC composition of the liposomes. POPC/PA and DOPC/PA liposomes bound equally well to Spo20p-PABD, but POPC liposomes were much less effective than DOPC liposomes in binding to Opi1p-PABD and PDE4A1-PABD (Fig. 2B), suggesting that PA binding capacity of Opi1p-PABD and PDE4A1-PABD was sensitive to the PC nature present in liposomes. Unsaturated fatty acyl chains have a conical shape that creates lipid-packing defects in membranes (25). Together these observations suggest that Spo20p-PABD displays a higher affinity for PA compared with Opi1p-PABD and PDE4A1-PABD. However, Opi1p-PABD and PDE4A1-PABD are able to sense PA and changes in its lipid environment in the membrane, which is less the case for Spo20p.
We then examined the PA-binding specificity of the PABDs using liposomes containing PA species with different fatty acid chains varying in length and saturation. All three PABDs showed an overall preference for long and unsaturated fatty acid chains, with Spo20p-PABD displaying in general a higher affinity (Fig. 3). However, differences in the relative PA preferences were noted. Mono- and bis-unsaturated PAs in the sn-2 position appeared to bind preferentially to the Spo20p-PABD and PDE4A1-PABD, but no such preference could be seen for Opi1p-PABD (Fig. 3). Of note, in contrast to Opi1p-PABD, Spo20p-PABD and PDE4A1-PABD displayed reduced binding of polyunsaturated PA (Fig. 3). Increasing the sn-1 chain length from 16 to 18 carbons increased the binding to Spo20p-PABD, whereas it reduced the binding to Opi1p-PABD and PDE4A1-PABD. PA(18:0/18:1) displayed the most potent binding to Spo20p-PABD, whereas PA(16:0/18:1) was preferred by PDE4A1-PABD (Fig. 3). The influence of the acyl chain length on PA binding was tested using bi-saturated PA because of limited commercial availability of these PA species (Fig. 3D). The shortest PA tested, PA(8:0/8:0), bound equally well to all three probes, but as the length of the acyl chain increased, Opi1p-PABD and PDE4A1-PABD bound less, whereas Spo20p-PABD bound more (Fig. 3D), suggesting that the probes differed in specificity regarding the acyl chain length of PA. Altogether, these observations suggest that the three PA sensors display a specific PA preference profile in terms of length and saturation of the acyl chains and may be useful for sensing distinct PA species within membranes.
FIGURE 3.

Effect of PA fatty acyl chain composition on PA binding of Spo20p-PABD, Opi1p-PABD, and PDE4A1-PABD. A–C, GST and GST-PABD beads were incubated with liposomes containing 5% NBD-PE, 85% of DOPC, and 10% of the indicated PA. PA species presenting the highest binding to the PABDs are encircled, and significant differences in binding are indicated (n = 3 independent experiments, *, p > 0.05; **, p > 0.01; and ***, p > 0.001). Data are presented as means ± S.D. (of triplicate measurements from a representative experiment, n = 3). D, effect of increasing fatty acid chain lengths on saturated PA on binding to GST-PABD beads. Background fluorescence measured when liposomes were incubated with GST beads alone was subtracted. Data are presented as means ± S.D. (of triplicate measurements from a representative experiment, n = 3). Significant differences from PA(8:0/8:0)-containing liposomes are indicated (n = 3 independent experiments; *, p > 0.05, and **, p > 0.01).
Effect of Membrane Topology and Environment on the PA Binding Capacity of the PABDs of Spo20p, Opi1p, and PDE4A1
Differences in membrane curvature may also modulate the availability of PA molecules for interacting with target proteins, and this can be reproduced by varying the size of liposomes. Among the different PA species, we decided to probe the effect of membrane curvature using liposomes containing mono-unsaturated PA (PA 18:0/18:1, Fig. 4A) or bis/polyunsaturated PA (PA 18:2/18:2 or PA 16:0/22:6, data not shown). As illustrated in Fig. 4A, increasing the liposome radius from 50 nm to 1 μm slightly reduced binding to the three PA probes. However, the effect of membrane curvature was not significantly different among liposomes composed of different PA species (data not shown). This observation is in contrast to the high sensitivity to curvature of the amphipathic lipid packing sensor (ALPS) motif of a Golgi tether that displays almost no charge but a well developed hydrophobic face (26).
FIGURE 4.

Effect of membrane curvature, cholesterol, surface charge, and calcium on PA binding of Spo20p-PABD, Opi1p-PABD, and PDE4A1-PABD. A, GST-PABD beads were incubated with liposomes of different sizes (50 and 200 nm and 1 μm) containing 5% of PE-NBD, 85% of DOPC, and 10% of PA (18:0/18:1). Results are presented as means ± S.D. Significant differences to 200 nm liposomes are indicated (n = 3 independent experiments; *, p > 0.05). B, GST and GST-PABD beads were incubated with liposomes containing 5% of PE-NBD, 85% of DOPC, and 10% of PA (18:0/18:1). The % cholesterol represents the % that replaces DOPC in liposomes. Data are presented as means ± S.D. Significant differences were observed between 0 and 30% cholesterol for each condition as indicated (n = 3 independent experiments; *, p > 0.05; **, p > 0.01). C, GST-PABD beads were incubated with liposomes containing 5% of PE-NBD, 85% of DOPC, and 10% of PA (18:1/18:1) with the indicated % of PS (at the expense of DOPC). Liposomes with PS were compared with liposomes containing just DOPC for each PABD. Data are presented as means ± S.D. (of triplicate measurements from a representative experiment, n = 3). Significant differences are indicated (n = 3 independent experiments; *, p > 0.05, and **, p > 0.01). D, GST-PABD beads were incubated with liposomes containing 5% PE-NBD, 85% of DOPC, and 10% of PA in the presence (dark columns) or the absence (open columns) of 20 μm calcium. Data are presented as means ± S.D. (of triplicate measurements from a representative experiment, n = 3). For each PABD, significant differences in binding in the presence and absence of calcium are indicated (n = 3 independent experiments; **, p > 0.01, and ***, p > 0.001).
As cholesterol has a critical influence on lipid packing, the effect of increasing the cholesterol concentration in PA-containing liposomes was investigated. Cholesterol was found to increase the binding of liposomes to Spo20p-PABD and to a lesser extent to PDE4A1-PABD, but it reduced the binding to Opi1p-PABD (Fig. 4B). Similar results were obtained with DOPC and POPC liposomes (data not shown). Thus, the three PA probes are sensitive to the presence of cholesterol in the PA lipid environment.
In liposome reconstitution assays, the effect of electrostatics can be very pronounced. When binding occurs through a cryptic polybasic region, which like Velcro binds firmly above a threshold of negative charges, additional charges provided by other lipids may contribute to the binding. To probe the effect of the net charge on the binding capacity of the PABDs, increasing amounts of phosphatidylserine (PS) were added to the liposomes. As the charge was increased, PA-containing liposome binding to Spo20p-PABD and PDE4A1-PABD was gradually enhanced, but there was no modification in the binding to Opi1p-PABD (Fig. 4C). Finally, we examined the effect of calcium, which can electrostatically interact with the two dissociable protons of the PA phosphate moiety and thereby modulate the number of charges available for interaction (27, 28). In the presence of 20 μm calcium, PA-liposome binding to Spo20p-PABD and PDE4A1-PABD was increased, whereas binding to Opi1p-PABD appeared insensitive to this calcium concentration (Fig. 4D), again arguing for calcium sensitivity differences among the PA sensors.
PABDs of Spo20p, Opi1p, and PDE4A1 Display Specific Intracellular Localizations in Macrophages
To promote particle engulfment, phagocytic cells remodel their plasma membrane and increase their surface area by incorporating intracellular vesicles, and this process appears to require PLD-generated PA (18, 19). To investigate the intracellular sites of PA synthesis in the course of phagocytosis, we expressed the PABD probes fused to GFP (GFP-PABDs) in RAW 264.7 macrophages. In non-stimulated cells, GFP-Spo20p-PABD was largely concentrated in the nucleus, although to some extent it also underlined the plasma membrane, as indicated by partial co-localization with the isolectin IB4 (Fig. 5A), in agreement with the peripheral distribution observed previously (15). Like GFP-Spo20p-PABD, GFP-Opi1p-PABD was present in the nucleus, but also in the cytoplasm where it appeared associated with faint reticular structures, which partially co-localized with the ER marker calnexin (Fig. 5A), arguing that Opi1p-PABD may bind PA in ER membranes of macrophages. In contrast, the distribution of GFP-PDE4A1-PABD was markedly different as it accumulated mostly in the perinuclear region and co-localized with giantin, a membrane protein of the Golgi apparatus (Fig. 5A). Of note, the three GFP-PABD proteins, in which PA binding was abolished by point mutations, were essentially distributed throughout the cytoplasm or the nucleus and apparently were no longer membrane-bound (Fig. 5B). Thus, when expressed in macrophages, the three PA probes are also able to distinguish between PA pools present in different subcellular compartments, suggesting that they most likely sense either different PA species and/or PAs in specific lipid or charge environments.
FIGURE 5.
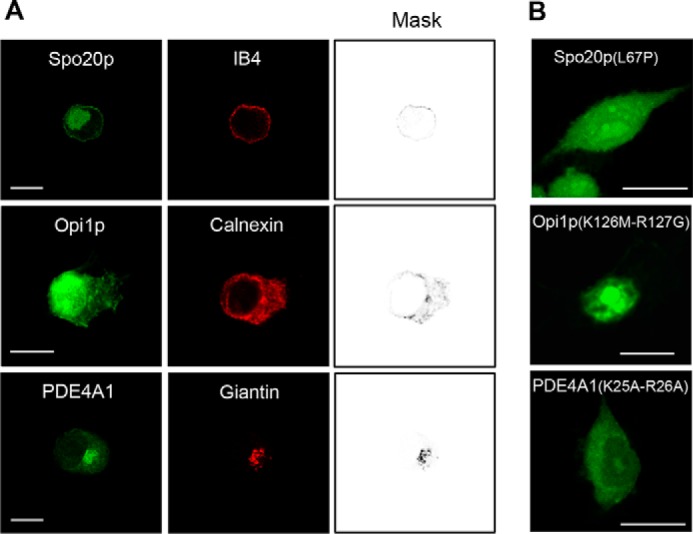
Subcellular distribution of GFP-Spo20p-PABD, GFP-Opi1p-PABD, and GFP-PDE4A1-PABD in RAW 264.7 macrophages. A, confocal images of macrophages expressing different GFP-PABDs and stained with the plasma membrane marker IB4, the ER marker calnexin, or the Golgi marker giantin, respectively. The images shown are representative of at least 100 cells obtained with at least five different cell preparations. Bar, 10 μm. Mask images highlight co-localization with the respective markers. B, macrophages expressing mutated GFP-PABDs. Similar observations were obtained with at least three different cell preparations. Bar, 10 μm.
To examine the distribution of the GFP-PABDs during phagocytosis, we used the well characterized frustrated phagocytosis assay. Particle phagocytosis can be mimicked in macrophages plated on BSA-anti-BSA IgG-coated dishes and stimulated by a temperature shift from 4 to 37 °C, as shown in the images obtained by scanning electron microscopy (Fig. 6A). GFP-PABD distribution in macrophages plated on BSA-anti-BSA IgG-coated dishes at 4 °C was similar to that of macrophages grown on glass coverslips (data not shown). In macrophages expressing GFP-Spo20p-PABD, frustrated phagocytosis resulted in a massive recruitment of the probe at the plasma membrane, especially on vesicular podosome-like structures, which were evident in basal sections of cells, concomitant with a net reduction of the nuclear localization of the probe (Fig. 6, B and C). These results are in line with our previous observation using another PA probe GFP-Raf-PABD, which is also recruited to phagosomes during the phagocytosis of IgG-coated particles by RAW 264.7 macrophages (19). Interestingly, in phagocytosing macrophages, GFP-Opi1p-PABD was also observed at the cell periphery and reduced in the ER (Fig. 6, B, arrows, and C). In contrast, frustrated phagocytosis did not alter the localization of GFP-PDE4A1-PABD on giantin-positive perinuclear structures (Fig. 6B). Altogether, these data reveal major changes in PA levels and/or composition in the plasma membrane but also in the ER of macrophages undergoing phagocytosis.
FIGURE 6.
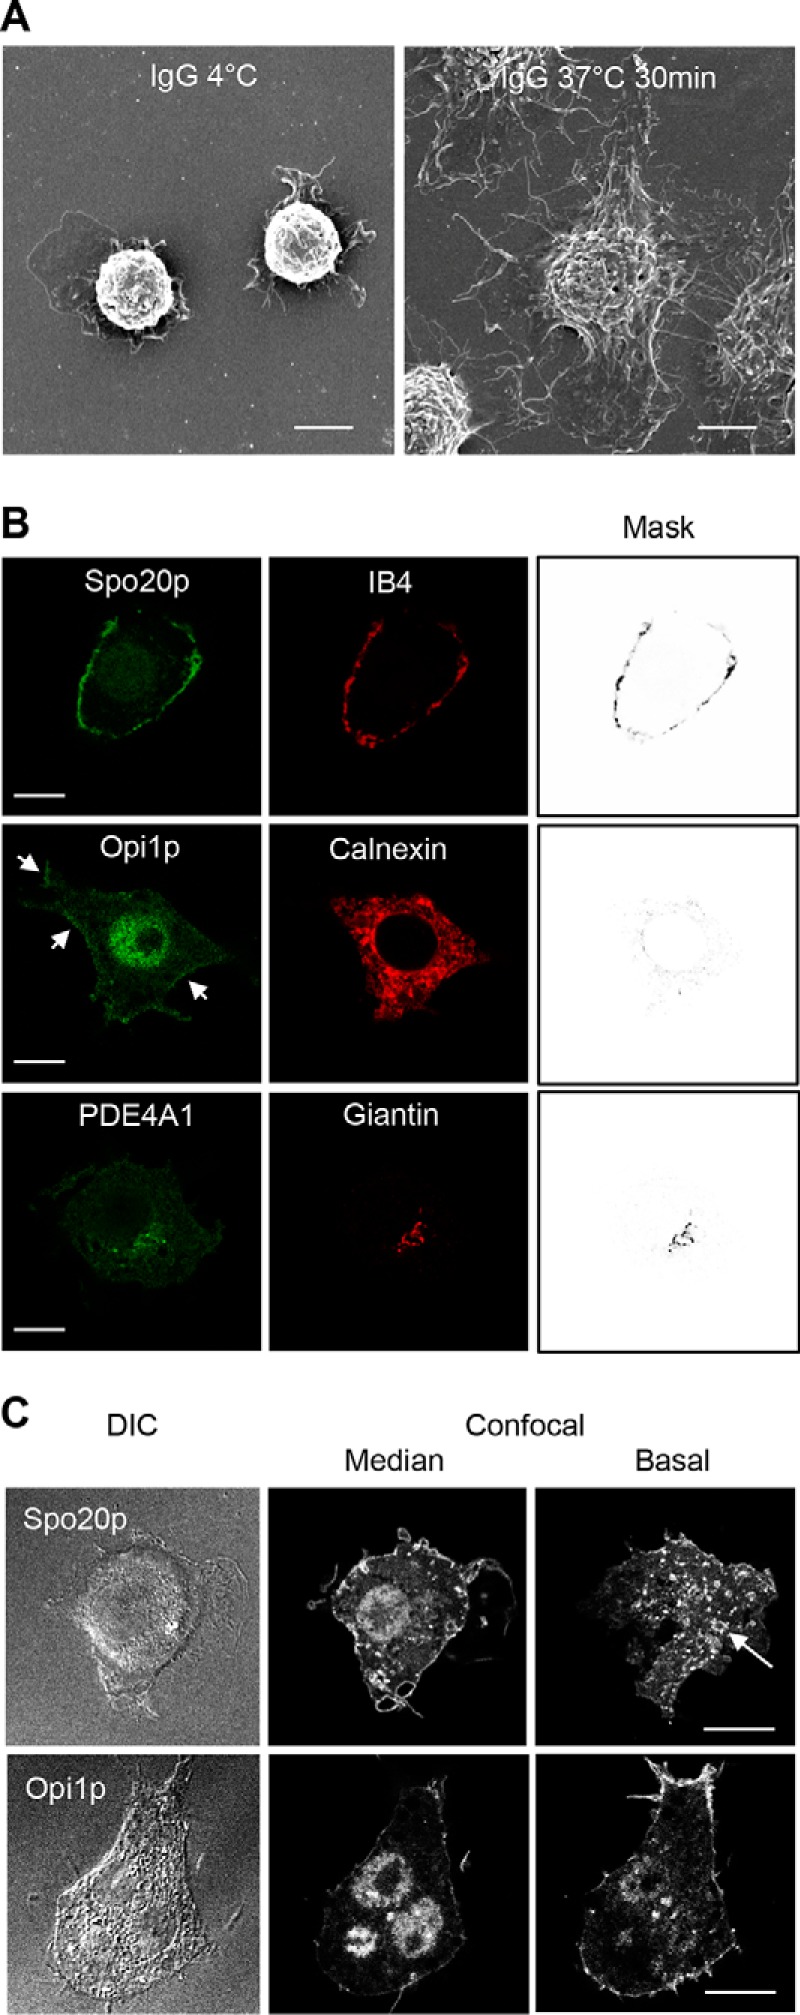
Subcellular distribution of GFP Spo20p-PABD, GFP-Opi1p-PABD, and GFP-PDE4A1-PABD during frustrated phagocytosis in RAW 264.7 macrophages. A, scanning electron microscopy images of macrophages spreading after inducing frustrated phagocytosis by shifting from 4 to 37 °C for 30 min. B, confocal images of macrophages expressing the different GFP-PABDs, fixed after 30 min of frustrated phagocytosis, and stained for subcellular markers as described in Fig. 5A. Note that GFP-Spo20p-PABD and GFP-Opi1p-PABD (arrows) have been recruited to the plasma membrane, but GFP-PDE4A1-PABD localization is unchanged and remains concentrated in the Golgi apparatus. C, differential interference contrast (DIC) image and corresponding confocal images (median and basal sections) of macrophage expressing GFP-Spo20p-PABD and GFP-Opi1p-PABD after 30 min of frustrated phagocytosis. GFP-Spo20p-PABD-labeled podosome-like structures at the base of the cell (arrow). The images shown are representative of at least 100 cells obtained with three to five different cell preparations. Bar, 10 μm.
Lipidomic Analysis Confirms Subcellular Changes in PA Levels Detected by the PABD Probes during Frustrated Phagocytosis
To confirm the data obtained using the PA sensors, cellular and subcellular PA levels in macrophages before and after induction of frustrated phagocytosis were analyzed by mass spectrometry. Fractions enriched in cellular organelles from non-stimulated and stimulated macrophages were obtained by differential centrifugation of cell lysates (Fig. 7A). In cell lysates, the total PA corresponded to ∼2000 pmol/mg protein, which is in line with a previous lipidomic profiling of this cell line (29). After 30 min of phagocytosis, the total cellular level of PA increased by 39.6 ± 4.3% (Fig. 7C). Although no significant changes were observed in the cytosol, mitochondria, and nuclear fractions, strong differences in PA levels were detected in the ER and plasma membrane-containing fractions (Fig. 7C). PA levels doubled in the plasma membrane fraction and, inversely, decreased by 50% in the ER fraction. These data are in line with the changes in localization observed with the PA sensors, GFP-Opi1p-PABD and GFP-Spo20p-PABD. In macrophages, phagocytosis is accompanied by a strong increase in PA at the plasma membrane, in line with the presence of PLD at the cell periphery (18, 19), and a concomitant reduction in PA levels in the ER, an observation that may support the possible and up to now largely debated contribution of the ER to phagocytosis (15). A detailed MS analysis of the ER membrane fractions allowed us to detect significant levels of 44 different PA species (data not shown). Intriguingly, with the exception of four polyunsaturated ω-3 forms of PA, for which levels were moderately reduced after frustrated phagocytosis, the levels of each species was very similarly reduced by nearly 55% (data not shown).
FIGURE 7.
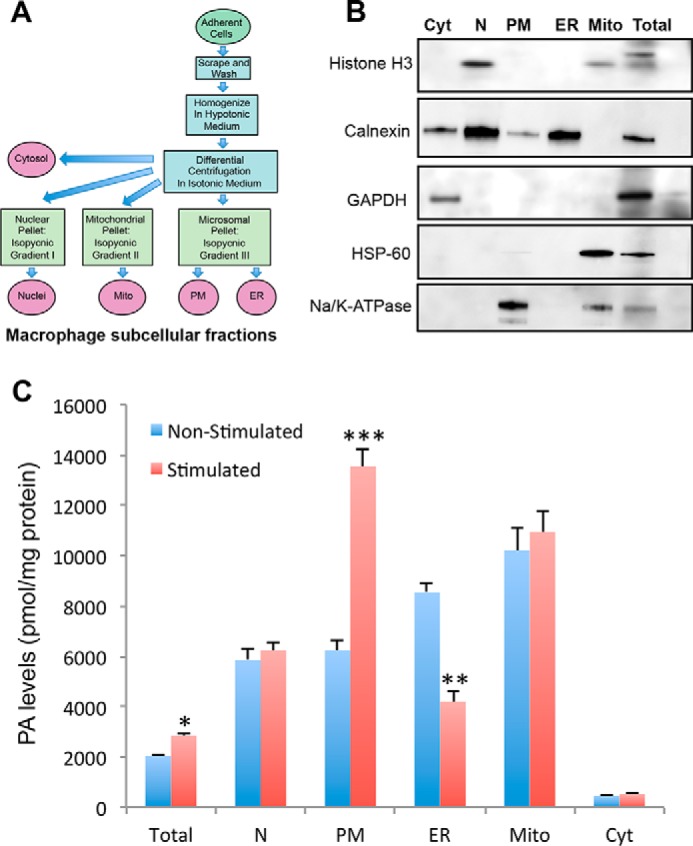
PA levels in subcellular membrane fractions from RAW 264.7 macrophages undergoing frustrated phagocytosis. A, schematic representation of the different steps from subcellular fractionation to lipidomic analysis. B, verification of subcellular fractionation by immunoblotting 30 μg of protein of different fractions (cytosol (Cyt), nucleus (N), plasma membrane (PM), endoplasmic reticulum (ER), mitochondria (Mito) and crude extract (Total). The following markers were used: nuclear marker histone H3; ER marker calnexin; cytosol marker GAPDH; mitochondrial marker HSP-60; and the plasma membrane marker Na+/K+-ATPase. C, PA levels were measured by duplicate UPLC/MS/MS analysis of two samples (each containing 200 μg of protein) from each fraction either from cells kept at 4 °C (non-stimulated) or shifted to 37 °C for 30 min (stimulated). Results are presented as the means ± S.E. (n = 3) obtained from independent experiments. Significant differences between non-stimulated and stimulated conditions for each fraction are indicated (*, p > 0.05; **, p > 0.01; and ***, p > 0.001).
PABD Probe Binding Does Not Depend on Proteins Present in Membrane Compartments
The binding of GST-Spo20p-PABD and GST-Opi1p-PABD to plasma or ER-enriched membrane fractions (see Fig. 7B for purity estimation) was estimated by measuring unsaturated fatty acid phospholipid levels associated with GST-PABDs linked to GSH-Sepharose beads. No significant lipid binding was found when plasma or ER-enriched membranes were incubated with control GST linked to GSH-Sepharose beads (Fig. 8A). GST-Spo20p-PABD preferentially bound to plasma membranes compared with ER membranes, whereas GST-Opi1p-PABD preferentially bound ER membranes (Fig. 8A). This finding is in line with the intracellular distribution of GFP-Spo20p-PABD and GFP-Opi1p-PABD observed in macrophages (Fig. 5). To probe whether the binding preferences of the PABD probes might involve interactions with membrane-associated proteins, plasma and ER membrane fractions were treated with either trypsin or proteinase K to hydrolyze associated proteins (Fig. 8, inset) and incubated with GST-Spo20p-PABD or GST-Opi1p-PABD. Both protease treatments did not significantly change the amount of membrane bound to the PA sensor beads (Fig. 8, B and C), indicating that membrane-associated proteins do not contribute to the binding capacity and selectivity of the PA sensors. In other words, the PABD probes most likely sense the PA species and their lipid environment within membranes.
FIGURE 8.

Binding of Spo20p-PABD and Opi1p-PABD to plasma and ER membranes obtained by subcellular fractionation. A, GST or GST-PABDs beads were incubated with plasma (PM) or ER membranes (containing ∼400 μg of unsaturated lipids) for 30 min, and the amount of lipid bound to the beads was estimated using a colorimetric quantification kit for unsaturated lipids. B and C, similar experiments were performed with plasma (PM) and ER membranes previously incubated at 37 °C for 2 h with trypsin or proteinase K, respectively. Proteases were heat-inactivated for 1 h at 75 °C before incubating samples with GST-PABD bound to GSH beads. Results are presented as the means ± S.E. (n = 3) obtained from independent experiments. Significant differences for lipid binding between GST-Spo20p-PABD and GST-Opi1p-PABD are indicated (**, p > 0.01, and ***, p > 0.001). In each condition a background signal measured from GST and GST-PABDs beads alone was subtracted. Inset reveals the absence of the plasma and ER membrane markers (CD64 and calnexin, respectively) as revealed by immunoblotting plasma and ER membranes after trypsin (Try) or proteinase K (PK) treatment as compared with control membranes (50 μg) incubated without protease (Ctrl).
Discussion
Relatively limited information is available to model the interaction between PA and PA-binding proteins. In the original study describing the ability of Spo20p to bind specifically PA, the PA-binding domain was predicted to form an amphipathic helix with both positively charged and hydrophobic amino acid residues contributing to PA binding (12). In agreement with these secondary structure predictions, we recently found that the PA-binding region of Spo20p is largely formed by an amphipathic helix spanning from Gly-56 to Leu-78 followed by a smaller helix on the C-terminal part (Phe-84 to Lys-89) (30). Using molecular dynamic simulation, the Spo20p PA-binding polypeptide was predicted to adopt an interfacial orientation with most of the hydrophobic residues embedded in the membrane, whereas positively charged residues coordinate several PA headgroups (30). Bioinformatics predict that the three PA sensors tested here adopt amphipathic helix conformations with four to six charged residues sequestered on one side of the helix, whereas the other side of the helix is enriched (five to seven) in hydrophobic residues (Fig. 9A). Most likely, PA binding by these short polypeptides does not involve a core-structured motif, but hydrophobic residue insertion into lipid bilayers and direct ionic interaction between basic residues and several molecules of PA. Spo20p-PABD is clearly the probe that binds the most efficiently to PA. This may reflect a structure that is more optimal for PA binding in Spo20p-PABD and could involve a higher density of hydrophobic and charged residues on each side of the α-helix (Fig. 9A). Spo20p-PABD also contains a unique histidine-rich polar face that may contribute to some of its specific characteristics for binding to PA in membranes. By changing the liposome amounts in the binding assay, we were able to calculate the concentration of liposomes required for half-maximal binding. From these values, the apparent Kd value for PA(18:0–18:1) binding by GST-Spo20p-PABD, GST-PDE4A1-PABD, and GST-Opi1p-PABD was 2.2, 6.8, and 4.5 μm, respectively. The low micromolar range for each PABD is reflecting as expected a low affinity interaction. These apparent Kd values are, however, rather crude estimations of the affinity because both the liposomes and the PABD should be considered as soft matter. Indeed, it is likely that the PABDs adopt an unstructured conformation in solution and progressively organize in α-helical structures as they associate with liposome membranes. Furthermore, it should be noted that it is likely that the different PABDs bind to more than one PA molecule.
FIGURE 9.

PA binding profile of Spo20p-PABD, Opi1p-PABD, and PDE4A1-PABD and subcellular localization in macrophages. A, amphipathic α-helix projections of the core 18–20 amino acids of the PABD of Spo20p, Opi1p, and PDE4A1 obtained with Heliquest software. Arrows indicate hydrophobic moments. B, table summarizing the data from Figs. 2 to 4. The arrows reveal absence, positive, or negative effects of the indicated liposome parameter on binding of the GST-PABDs to PA-containing liposomes. C, comparison of the subcellular distribution of the GFP-PABD of Spo20p, Opi1p, and PDE4A1 in non-stimulated RAW 264.7 macrophages and during frustrated phagocytosis. The preferential subcellular compartment of each probe is noted first.
The present in vitro observations indicate that the three PA sensors tested here require a specific membrane environment for optimal PA binding (summarized in Fig. 9B). Our findings are in agreement with the observations showing that different PA-binding proteins display differential binding as a function of membrane curvature stress and chemical properties (31). Although it is impossible to completely rule out that additional factors, such as trans-membrane proteins, contribute to the distinct subcellular distribution found in macrophages, the in vitro data suggest that the probes are able to distinguish not only the level but also the species of PA in a particular lipid environment. In agreement, the binding preference of GST-Spo20p-PABD and GST-Opi1p-PABD toward either plasma or ER membranes remains unchanged even after effective proteolysis (Fig. 8). Importantly, preferential binding for a particular PA was observed only when PAs were included in a lipid environment. When the GST-PABD probes bound to GSH-Sepharose beads were incubated with a mixture of egg or soybean PA of known composition, mass spectrometry analysis showed that the proportion of each of the PA species bound to the sensors was strictly similar to the original PA mixtures (data not shown). This clearly indicates that the PABD-PA interaction involves parameters occurring in a membrane context. Thus, the three probes studied here present their own spectrum of binding preferences to different PA species based on fatty acid chain length and saturation. Although the subcellular distribution of PA sensors might rely on additional parameters such as the luminal pH (32), it is noteworthy that the change of subcellular distribution observed here during frustrated phagocytosis was correlated with a change in PA level in the corresponding membrane compartments. Furthermore, the fact that point mutations that reduce charged clusters (Opi1p-PABD and PDE4A1-PABD) or the α-helical conformation (Spo20p-PABD) strongly reduce binding of PA-containing liposomes and induce membrane to cytosol relocation supports the notion that the intracellular distribution of these probes is highly sensitive to PA levels in membranes. These PABD probes might therefore represent useful tools to detect the PA level and composition in distinct subcellular membranes and the possible variations during cell activation.
Binding of Spo20p-PABD to PA is favored by high charges, cholesterol and calcium, and at a lesser extent by the length and saturation of the fatty acyl chains and packing defects (Fig. 9B). These characteristics are typical of endosomal and plasma membranes (25). In fact Spo20p is the yeast homologue of SNAP-25 necessary for spore formation. As shown here, when expressed in macrophages (summarized in Fig. 9C), GFP-Spo20p-PABD is recruited to the plasma membrane during phagocytosis similar to what is observed in stimulated PC12 cells undergoing neurosecretion (6, 15). Altogether, our findings suggest that GFP-Spo20p-PABD might represent a PA sensor particularly suitable to detect PA modifications in the plasma membrane and derived organelles. It is noteworthy to mention that a probe containing two Spo20p-PABDs fused to GFP or GST through two coiled-coil motifs displayed similar characteristics regarding binding to PA, although it also bound avidly to PI(4,5)P2 (33). Increased binding to PI(4,5)P2 of this double-Spo20p coiled-coil, potentially a consequence of the apposition of tandem Spo20p motifs, reduces the cellular interest of this tool as a specific PA sensor. This construct has, in consequence, not been used as widely as GFP-Spo20p-PABD for monitoring PA in cells (2, 6, 15).
The biophysical membrane parameters for optimal binding of Opi1p-PABD are high packing defects, short and unsaturated PA, low cholesterol levels, and little charge, which all are hallmarks of the ER membrane (25), where this sensor accumulates in macrophages (summarized in Fig. 9C). Of note, this is only in partial agreement with the findings of Hofbauer et al. (34), where the full-length Opi1p protein was found to preferentially bind to short but saturated PA. These differences may result from additional domains/interactions occurring in the full-length Opi1p but also from the limited number of PA species used in their liposome flotation assay (34), with the latter being clearly less quantitative than the fluorimetric assay presented here. In agreement with our findings, the lipidomic analysis revealed that saturated PA species are in extremely limited amounts in the ER fraction purified from cultured macrophages (data not shown), making it unlikely that these PA species played a role in recruiting GFP-Opi1p-PABD to the ER in macrophages. In yeast, Opi1p is a transcriptional repressor, which is normally localized on the ER via its interaction with PA. Under conditions where the biosynthetic PA pool is depleted, Opi1p-PABD translocates to the nucleus where it represses genes involved in inositol synthesis (13). Thus, the GFP-Opi1p-PABD sensor may be ideally suited to follow PA dynamics in the ER of most cellular models.
The PDE4A1-PABD appeared somehow intermediate in these requirements and was found to associate with the Golgi, which makes the transition between the lipid-packing defects and electrostatics territories (3). In agreement, the PABD of PDE4A1 has previously been shown to consist of two α-helices linked by a hinge; the two tryptophan residues of the second helix are important for lipid insertion, whereas the first helix is important for a calcium-sensitive association with the Golgi (35).
Finally, it is also worth mentioning that the PA-binding signals of Spo20p and Opi1p overlap with nuclear targeting signals, suggesting some functional coupling between nuclear traffic and PA recognition. On the one hand, specific protein-PA interactions may occur in the nucleus, but on the other hand regulating extra-nuclear PA levels may represent a physiological control mechanism for the localization of these proteins, as has been suggested for Opi1p (13). Moreover, PA binding near the PX domain of p47Phox has been reported to regulate its affinity for phosphatidylinositol 3,4-bisphosphate (36), indicating that PA binding can also indirectly affect membrane affinity by modulating additional membrane interaction domains. Thus, in some circumstances membrane anchorage may require more than one binding site or lipid modification to facilitate cytosolic translocation to membranes in living cells. The precise characterization of other PABDs described to date, will undoubtedly prove helpful in understanding the molecular mechanisms of protein-PA interactions and generate novel PA sensors that are critically needed to follow PA dynamics in the cytosolic leaflets of cellular membranes in real time and ultimately gain insight into the complex structural and signaling functions of the simplest glycerophospholipid.
The biosynthesis and consumption of PA are regulated in cells by several different enzymatic routes (2). Biosynthetic pools of PA are mainly formed in the ER by the assembly of glycerol 3-phosphate and fatty acyl-CoA and are an essential intermediate for the formation of other phospholipids or phosphoinositides. Signaling and more directly functional pools of PA are formed from PC via the action of PLD and by the phosphorylation of DAG following, for example, hydrolysis of PI(4,5)P2 on distinct subcellular membrane compartments. The present finding that PA levels are dramatically modified in the plasma membrane and in the ER during phagocytosis, as revealed by mass spectrometry analysis and the use of the GFP-PABD sensors, argues that signaling PA might be produced in both the plasma membrane and ER. It is worth mentioning that fluctuations in PA levels in both of these compartments have been observed following lipopolysaccharide activation of macrophages, although in this case the PA level decreased in the plasma membrane fraction and increased in the ER (29). During frustrated phagocytosis, the marked increase in PA levels in the plasma membrane fraction and the recruitment of the Spo20p-PABD and Opi1p-PABD probes at the plasma membrane is in line with previous observations showing that PA synthesis by PLD1 and PLD2 positively contributes to FcγR-mediated phagocytosis (21–24). In this case, the exaggerated phagocytic response provoked in the frustrated phagocytosis model probably requires a more extensive remodeling of the plasma membrane and a greater contribution from the intracellular membrane sources. This may explain why nearly half of PA has disappeared from the ER during frustrated phagocytosis. One possible explanation for this finding is that PA has been converted to other signaling lipids in the ER as a consequence of phospholipase A or PA-phosphatase activity. Alternatively, there may have been a direct transfer of PA to the plasma membrane at ER-plasma membrane contact sites (37). In line with this hypothesis, we found that the levels of most of the 44 different species detected in our MS analysis decreased proportionally after frustrated phagocytosis (data not shown). These data could suggest an en bloc transfer of PA from the ER to the plasma membrane during frustrated phagocytosis. Although appealing, this latter possibility needs to be directly investigated, and the molecular mechanisms of PA transfer remain to be identified. However, in support of this possibility, extended synaptotagmins, which are ER resident integral membrane proteins, have recently been reported to serve as calcium-regulated tethers between the ER and the plasma membrane, thereby providing molecular support for lipid transfer between the ER and the plasma membrane in receptor-stimulated cells (38). In macrophages, the contribution of the ER to phagocytosis has been largely debated and remains controversial (18, 19). Yet, ER proteins appeared enriched in phagosomes (19), and additional work has suggested that ER contributions to phagocytosis occurs preferentially upon ingestion of large particles that require important membrane addition to the plasma membrane (39). Thus, these results support the idea that the ER might contribute to the increased PA levels at the plasma membrane during phagocytosis.
Materials and Methods
Antibodies
Anti-histone H3, anti-giantin (Ab24586), anti-Na+/K+-ATPase (Ab58475), anti-HSP-60 (Ab46798), and anti-calnexin (Ab22595) were purchased from Abcam; anti-CD64 (MAB2074) was from R&D Systems; anti-GST (G1160) was from Sigma, and anti-GAPDH (2118S) from Ozyme.
Expression of Recombinant GST-PABD Proteins
Fragments containing amino acids 50–101 from Spo20p (GenBankTM DAA09915.1) (12), 102–191 from Opi1p (GenBankTM M57383.1) (13), and 1–40 from PDE4A1 (GenBankTM M26715) (14) were used as PABD. The Spo20p-PABD was amplified by PCR from the pEGFP-C1-PABD-Spo20p construct (6) using the forward primer 5′-CGGGATCCCTCGAGCGTCTAGAATGG-3′ and reverse primer 5′-GCGAATTCTTAACTAGTCTTAGTGGCGTC-3′, as described previously. The Opi1p-PABD was amplified by RT-PCR from yeast DNA (gift from Dr. S. Friant, Université de Strasbourg, France) using the forward primer 5′-AGTGGATCCGATGAGTTCTTCACCAAC-3′ and reverse primer 5′-AGTGAATTCCGATGTCTCGTCCTCGCC-3′. The PDE4A1-PABD corresponding to the N-terminal regulatory domain of a cAMP-specific phosphodiesterase (PDE) was amplified by RT-PCR from rat cDNA as described (14), using the forward primer 5′-AGCGGATCCATGCCTCTGGTTGACTTC-3′ and reverse primer 5′-AGCGAATTCTGACCTGCTCATTTCCGAC-3′. The PABDs were inserted in-frame into pGEX4T1 as described previously (40). Point mutations were created to abolish PA binding on Spo20p-PABD(L67P), Opi1p-PABD(K126M/R127G), and PDEA41-PABD(K25A/R26A) with a QuikChange site-directed mutagenesis kit from Stratagene (41). Mutations and sequences of the clones were verified by automated sequencing. Large scale production of chimeric GST-PABD proteins has been previously described (42). Briefly, expression was induced at 37 °C; fusion proteins were purified on glutathione (GSH)-Sepharose (43) and purity was estimated to be >95% by Coomassie Blue staining of SDS-polyacrylamide gels. The quantity of purified protein was determined from this dye binding assay using bovine serum albumin as a standard (44). Protein aliquots were stored at −80 °C.
Lipid Overlay Assay
Following the protocol indicated by Molecular Probes, nitrocellulose membrane strips containing various phospholipids were saturated with blocking solution (phosphate-buffered saline containing 3% bovine serum albumin and 0.1% Tween 20 (PBS/BSA/Tween)) for 4 h at 4 °C. Then the strips were incubated for 2 h at 4 °C with GST-PABD proteins (diluted to 0.01 μg/ml in PBS/BSA/Tween). GST alone was used as a control. Subsequently, the strips were analyzed by Western blotting using an anti-GST antibody (Molecular Probes) and revealed by chemiluminescence. Images were acquired with a Chemismart 5000 (Vilber Lourmat) and quantified using ImageJ software.
Liposome Flotation and Binding Assays
Liposome preparation was performed as described previously (45). Lipids solubilized in chloroform were purchased from Avanti Polar Lipids. Liposome mixtures were prepared in mass ratios composed of 85% PC, 5% PE-NBD, and 10% PA, PC, PE, PS, or PI(4,5)P2 or with other molar ratios as indicated. Lipids were dried in a stream of nitrogen gas and kept under vacuum for at least 2 h. Dried lipids were then suspended at a concentration of 1.65 mg/ml in liposome-binding buffer (LBB: 20 mm HEPES, pH 7.4, 150 mm NaCl, 1 mm MgCl2) by three freeze and thaw cycles and were extruded using a Mini-Extruder (Avanti) through polycarbonate track-etched membrane filters to produce liposomes usually 200 nm in diameter, unless otherwise indicated. The size distribution of liposomes was estimated by dynamic light scattering using a Zetasizer NanoS from Malvern Instruments equipped with a 4-milliwatt laser. Samples were diluted 1:100 in LBB and analyzed at 20 °C using 10 runs, each composed of 14 measurements.
To determine the association of the GST-PABD constructs with these liposomes, a liposome flotation assay was adapted from the protocol described by Bigay et al. (46). Briefly, 5 μg of each probe was incubated with 150 μl of NBD-labeled liposomes (1 mg/ml) or LBB at room temperature for 15 min. This suspension was mixed with 100 μl of LBB containing ice-cold 75% sucrose, resulting in a 30% sucrose layer, which was overlaid with 200 μl of 25% sucrose solution prepared in ice-cold LBB and 150 μl of ice-cold LBB. The step gradients were centrifuged at 200,000 × g for 1 h at 4 °C in a Beckman swinging rotor (SW-32 Ti). The top 150-μl, middle 200-μl, and bottom 250-μl layers were manually collected from the top and analyzed for fluorescence at excitation and emission wavelengths of 485 and 535 nm, respectively, with s Mithras (Berthold) fluorimeter, to quantify the percentage of liposomes present in each fraction. Equal volumes of fractions were run on SDS-PAGE and immunoblotted with an anti-GST antibody as described previously (47).
A second approach was carried out to quantify liposome binding to GST-PABDs linked to GSH-Sepharose beads. GST and GST-PABDs (330 pmol) bound to GSH beads were washed once with 1 ml of LBB medium before incubating for 20 min in the dark at room temperature and under agitation with liposomes containing a 10-fold molar excess of PA relative to the quantity of GST proteins in a final volume of 200 μl of LBB. Beads were washed three times with 1 ml of ice-cold LBB and collected by centrifugation at 3000 rpm for 5 min. Liposome binding to the PABDs was estimated by measuring the fluorescence at 535 nm with a Mithras (Berthold) fluorimeter. Triplicate measurements were performed for each condition. Fluorescence measured with GST linked to GSH-Sepharose beads alone was between 3 and 4 A.U. and was subtracted from sample measurements.
Membrane Binding Assay and Saturated Lipid Quantification
GST and GST-PABDs (330 pmol) bound to GSH beads were washed once with 1 ml of LBB medium before being incubated for 30 min at room temperature and under agitation in LBB with plasma and ER membranes (containing ∼400 μg of unsaturated lipids), purified as described below. Beads were washed once with 1 ml of ice-cold LBB and collected by centrifugation at 5000 rpm for 1 min. Lipid binding to the PABDs was estimated by measuring the amount of unsaturated lipids using a colorimetric lipid quantification kit (Clinisciences, France) as described by the manufacturer. Briefly standards and samples were incubated with 150 μl of sulfuric acid and heated at 90 °C for 10 min, before incubation with vanillin at 37 °C for 15 min. The absorbance at 540 nm was measured with a Mithras (Berthold) fluorimeter. Samples of membrane fractions containing ∼200 μg of protein were incubated without or with trypsin at 0.1 μg/μl or proteinase K at 0.2 μg/μl in 20 μl for 2 h at 37 °C. Samples were incubated for 1 h at 75 °C for protease heat inactivation before incubating samples with GST-PABDs bound to GSH beads.
GFP-PABD Probes
The binding domain was described previously (6). GFP-Opi1p-PABD and GFP-PDE4A1-PABD were generated by inserting the PABDs in BglII- and EcoRI-digested pEGFP-C1. Mouse macrophage RAW 264.7 cells were maintained in RPMI-GlutaMAX medium (Gibco and Thermo Fisher Scientific), supplemented with 10% heat-inactivated fetal calf serum, 10 mm HEPES, 1 mm sodium pyruvate, 50 μm β-mercaptoethanol, 100 units/ml penicillin, and 100 μg/ml streptomycin at 37 °C under 5% CO2. For frustrated phagocytosis studies, cells were plated on Upcell dishes (Nunc, Thermo Fisher Scientific) to facilitate the preparation of cell suspensions and grown in macrophage serum-free medium (Thermo Fisher Scientific). RAW 264.7 cells at 50% confluence on glass coverslips or in 6-well Upcell plates were transfected with GFP-PABD plasmids using Lipofectamine 2000 according to the manufacturer's protocol (Thermo Fisher Scientific).
Frustrated Phagocytosis
Frustrated phagocytosis reflected by cell spreading on immobilized immune complexes was carried out either on Petri dishes (Falcon, 10 cm) for cellular fractionation or on glass coverslips for imaging. Surfaces were pre-coated with BSA (3%) and either rabbit anti-BSA IgG (0.04 mg/ml, Invitrogen A11133, Thermo Fisher Scientific) or sheep anti-BSA (0.04 mg/ml, Euromedex GTX77113) adapted from the protocol of Bainton et al. (20). Suspensions of RAW 264.7 cells (2 × 10⁷/10-cm dish for fractionation; 1–2 × 10⁵/12-mm coverslip, or 1–2 × 10⁴/glass-bottom microwells (MatTek) for microscopy) in cold serum-free medium were then allowed to attach to pre-coated surfaces at 4 °C for 1 h. Cell spreading was initiated by warming to 37 °C for 30 min for fractionation and 10, 20, or 30 min for microscopy. As controls, macrophages were either plated on surfaces pre-coated with immune complexes or with BSA alone and maintained at 4 °C.
Immunolabeling and Confocal Microscopy
After washing in cold medium, adherent macrophages transfected with GFP-PABD constructs were fixed with 4% paraformaldehyde in serum-free medium for 10 min at room temperature. Then, transfected cells were either directly labeled with Hoechst and Isolectin B4 (IB4-A647 Molecular Probes, Thermo Fisher Scientific) or permeabilized in PBS containing 4% paraformaldehyde and 0.1% Triton X-100 for 10 min at room temperature. Calnexin (1:200 dilution) and giantin (1:500 dilution) antibodies were used as markers for the ER and the Golgi apparatus, respectively, and revealed with a goat anti-rabbit IgG-Alexa 647 (1:1000 dilution, Molecular Probes, Thermo Fisher Scientific). The cellular distributions of the PA probes and markers were examined with a Leica SP5 II confocal microscope equipped with an oil immersion ×63 objective (Plan Apochromat n.a. = 1.4). Digital images were acquired in the equatorial and basal planes. Mask images were generated as described previously (48).
Scanning Electron Microscopy
To verify frustrated phagocytosis, as measured by cell spreading on coated coverslips, macrophages were prepared for scanning electron microscopy. Phagocytosis was stopped by placing samples on ice and rinsing with cold macrophage serum-free medium. Cells were then fixed with 2% glutaraldehyde in serum-free medium for 30 min and a further 30 min with 2% glutaraldehyde in phosphate-buffered saline, before being dehydrated and embedded in Durcapan. After decapping samples with propylene oxide, they were carbon-coated and examined with a Hitachi S800 scanning electron microscope.
Subcellular Fractionation
1.5 × 10⁸ RAW 264.7 were harvested as described (29) by scraping in 40 ml of PBS, pelleted at 200 × g for 7 min, resuspended in 40 ml of isolation medium (250 mm sucrose, 10 mm HEPES, pH 7.4, 1 mm EGTA), and pelleted again to remove salts (see Fig. 7A). For effective homogenization, cells were subjected to mild osmotic shock in 40 ml of slightly hypotonic medium (isolation medium containing 100 mm sucrose) and thereafter pelleted. The supernatant was set aside; the cell pellet was carefully transferred to a glass Dounce homogenizer; 10 ml of the supernatant was added, and the mixture was homogenized by 40 strokes with a tight-fitting pestle. The resulting slurry was then combined with the remaining supernatant. The homogenate was brought to an isotonic state by the addition of 3.5 ml of the hypertonic medium (isolation medium containing 1.78 m sucrose) and then supplemented with 2 mm MgCl2 to preserve nuclei through subsequent steps. Differential centrifugation parameters were as follows: 200 × g for 10 min to pellet nuclei/unbroken cells (crude “nuclear” pellet), 5000 × g for 10 min to pellet mitochondria, and 100,000 × g for 1 h to pellet microsomes and plasmalemma fragments. Post-nuclear and post-mitochondrial supernatants were additionally purified by centrifugation at 300 and 5000 × g for 10 min, respectively, to remove residual nuclei and mitochondria. The crude nuclear and mitochondrial pellets were then washed and pelleted in Mg2+-containing and Mg2+-free media, respectively. The supernatant from the 100,000 × g spin was retained as the cytosolic fraction. The nuclear, mitochondrial, and microsomal pellets were subjected to centrifugation through OptiPrep step gradients in an SW-32 Ti rotor. Gradient media were prepared according to the manufacturer's instructions using the isolation medium described above; for nuclear preparation, the medium was supplemented with 5 mm MgCl2. To purify nuclei, the crude nuclear pellet was adjusted to 25% OptiPrep (final volume = 12 ml), and OptiPrep gradients were formed from the bottom up in three 12-ml tubes (4 m in 10%, 4 ml nuclei in 25%, 2.5 ml in 30%, and 1.5 ml in 35% of OptiPrep) and centrifuged at 10,000 × g for 20 min. Nuclei were recovered at the 30/35% OptiPrep interface. The mitochondrial and microsomal pellets were resuspended in isolation medium adjusted to 35% OptiPrep (final volume = 6 ml) and fractionated by flotation for 2 h at 50,000 × g in three 12-ml tubes through a gradient that was formed with 2 ml of 10% OptiPrep, 4 ml of 17.5% OptiPrep, 4 ml of 25% OptiPrep, and 2 ml of the respective pellets resuspended in 35% OptiPrep. Mitochondria were collected at the 17.5/25% interface and plasmalemma and ER at the 10/17.5% and 17.5/25% interfaces, respectively. A third fraction, originating from the microsomal pellet, at the dense 25/35% interface, was termed heavy microsomes. All samples were frozen and stored at −80 °C. Purity of fractions was verified by immunoblots using specific markers for the different fractions as described previously (48).
Lipidomic Analysis
Total lipids from cell samples were extracted by the method of Bligh and Dyer (49). Extracts were mixed with chloroform/methanol (4:1), vortexed for 10 s, and left under agitation for 1 h at 4 °C. After a 5-min centrifugation at 13,000 rpm, the organic phase (150 μl) was recovered and analyzed by mass spectrometry (UPLC/MS/MS) on an Acquity UPLC system (Waters) coupled to a Quattro Premier XE triple quadrupole MS system (Waters Micromass). The sample (3 μl) was injected into an Acquity UPLC BEH HILIC Amide pre-column (2.1 × 5 mm, 1.7-μm particle size), coupled to a Waters Acquity UPLC BEH Amide column (2.1 × 100 mm, 1.7-μm particle size) and maintained at 28 °C. The column was eluted with a mixture of 99.5% acetonitrile, 0.5% ammonium hydroxide (A) and 80% acetonitrile, 19.5% water, 0.5% ammonium hydroxide (B). The flow rate was 0.4 ml·min−1 using the following elution protocol: 93% A for 2 min, followed by the gradient, 93 to 60% A in 1 min, 60 to 50% A in 0.5 min, and 50 to 40% A in 1.5 min. The composition of the mobile phase was then returned to initial conditions as follows: 40–50% A in 2 min, 50–80% A in 2.5 min, 80–93% A in 0.5 min and maintained in 93% A for 2 min. UV spectra were recorded from 200 to 500 nm. The system was run by Mass-Lynx software (version 4.0). The ESI source was used in positive and negative mode with a capillary voltage of 3.4 kV; RF lens was at 0 V; resolution (LM1, HM1, LM2, and HM2) was 15; ion energy was 1 and 2:0.5. Source and desolvation temperatures were 135 and 400 °C. Flow rates of nitrogen for nebulizer and desolvation were 50 and 90 liters·h−1. Pressure of the argon collision gas was 3.0·10−3 mbar. Full scan, selected ion recording, and daughter scan mode were used for qualitative analyses. Quantitative PA analyses were made based on MS/MS multiple reaction monitoring (MRM) as described (50). Briefly, MRM transitions for individual PAs were determined using PA standards (Avanti Polar Lipids, Alabaster, AL). The PAs were identified as deprotonated parent ions [M − H−]; cone energy was optimized for each PA and set to 44 V. The predominant daughter fragment ions were then used for quantitative MRM analysis. After optimization, the collision energy was set to 44 V. MRM transitions and specific retention times were used to selectively monitor PA.
Statistical Analysis
Number of experiments and repeats are indicated in the figure legends. Normality of the data distribution was verified with analysis of variance test, and statistical analysis was performed with t tests relative to the indicated control.
Author Contributions
N. K., E. T., T. T., L. F., D. H., S. C. G., N. J. G., and N. V. performed and analyzed experiments. N. V. and N. J. G. designed the experiments. N. V., N. J. G., and M. F. B. wrote the manuscript. All authors revised the manuscript.
Acknowledgments
We thank Valérie Demais for scanning electron microscopy experiments and the microscopy facilities of Plateforme Imagerie In Vitro; Dr. Miles Houslay (King's College, London) for the original GFP-PDE4A1-PABD construct; Dr. S. Friant (CNRS and Université de Strasbourg, France) for yeast DNA; Dr. Bernard Lorber (CNRS and Université de Strasbourg, France) for help with the dynamic light scattering experiments; and Dr. Bruno Antonny for stimulating discussion (Institut de Pharmacologie Moléculaire et Cellulaire, Nice, France). The Metabolome Facility of Bordeaux was supported by Grant MetaboHUB-ANR-11-INBS-0010 from Agence National pour la Recherche.
This work was supported by grants from “La Ligue Contre le Cancer” and from “Fondation pour la Recherche Médicale” (to N. V.). The authors declare that they have no conflicts of interest with the contents of this article.
- PA
- phosphatidic acid
- DAG
- diacylglycerol
- DGK
- diacylglycerol kinase
- DOPC
- dioleoyl phosphatidylcholine
- ER
- endoplasmic reticulum
- LBB
- liposome-binding buffer
- LPAAT
- lyso-PA-acyltransferase
- NBD
- N-(7-nitrobenz-2-oxa-1,3-diazol-4-yl)
- PABD
- PA-binding domain
- PC
- phosphatidylcholine
- PE
- phosphatidylethanolamine
- PI(4,5)P2
- phosphatidylinositol 4,5-bisphosphate
- PLD
- phospholipase D
- POPC
- palmitoyl-oleolyl phosphatidylcholine
- PS
- phosphatidylserine
- MRM
- multiple reaction monitoring.
References
- 1. Liu Y., Su Y., and Wang X. (2013) Phosphatidic acid-mediated signaling. Adv. Exp. Med. Biol. 991, 159–176 [DOI] [PubMed] [Google Scholar]
- 2. Ammar M. R., Kassas N., Bader M. F., and Vitale N. (2014) Phosphatidic acid in neuronal development: a node for membrane and cytoskeleton rearrangements. Biochimie 107, 51–57 [DOI] [PubMed] [Google Scholar]
- 3. Wang X., Devaiah S. P., Zhang W., and Welti R. (2006) Signaling functions of phosphatidic acid. Prog. Lipid Res. 45, 250–278 [DOI] [PubMed] [Google Scholar]
- 4. Jang J. H., Lee C. S., Hwang D., and Ryu S. H. (2012) Understanding of the roles of phospholipase D and phosphatidic acid through their binding partners. Prog. Lipid Res. 51, 71–81 [DOI] [PubMed] [Google Scholar]
- 5. Ammar M. R., Kassas N., Chasserot-Golaz S., Bader M. F., and Vitale N. (2013) Lipids in regulated exocytosis: what are they doing? Front. Endocrinol. 4, 125. [DOI] [PMC free article] [PubMed] [Google Scholar]
- 6. Zeniou-Meyer M., Zabari N., Ashery U., Chasserot-Golaz S., Haeberlé A. M., Demais V., Bailly Y., Gottfried I., Nakanishi H., Neiman A. M., Du G., Frohman M. A., Bader M. F., and Vitale N. (2007) Phospholipase D1 production of phosphatidic acid at the plasma membrane promotes exocytosis of large dense-core granules at a late stage. J. Biol. Chem. 282, 21746–21757 [DOI] [PubMed] [Google Scholar]
- 7. Jenkins G. M., and Frohman M. A. (2005) Phospholipase D: a lipid centric review. Cell. Mol. Life Sci. 62, 2305–2316 [DOI] [PMC free article] [PubMed] [Google Scholar]
- 8. Dalton K. A., East J. M., Mall S., Oliver S., Starling A. P., and Lee A. G. (1998) Interaction of phosphatidic acid and phosphatidylserine with the Ca2+-ATPase of sarcoplasmic reticulum and the mechanism of inhibition. Biochem. J. 329, 637–646 [DOI] [PMC free article] [PubMed] [Google Scholar]
- 9. Fan Z., Gao L., and Wang W. (2003) Phosphatidic acid stimulates cardiac KATP channels like phosphatidylinositols, but with novel gating kinetics. Am. J. Physiol. Cell Physiol. 284, C94–C102 [DOI] [PubMed] [Google Scholar]
- 10. Comoglio Y., Levitz J., Kienzler M. A., Lesage F., Isacoff E. Y., and Sandoz G. (2014) Phospholipase D2 specifically regulates TREK potassium channels via direct interaction and local production of phosphatidic acid. Proc. Natl. Acad. Sci. U.S.A. 111, 13547–13552 [DOI] [PMC free article] [PubMed] [Google Scholar]
- 11. Zhang Y., and Du G. (2009) Phosphatidic acid signaling regulation of Ras superfamily of small guanosine triphosphatases. Biochim. Biophys. Acta 1791, 850–855 [DOI] [PMC free article] [PubMed] [Google Scholar]
- 12. Nakanishi H., de los Santos P., and Neiman A. M. (2004) Positive and negative regulation of a SNARE protein by control of intracellular localization. Mol. Biol. Cell 15, 1802–1815 [DOI] [PMC free article] [PubMed] [Google Scholar]
- 13. Loewen C. J., Gaspar M. L., Jesch S. A., Delon C., Ktistakis N. T., Henry S. A., and Levine T. P. (2004) Phospholipid metabolism regulated by a transcription factor sensing phosphatidic acid. Science 304, 1644–1647 [DOI] [PubMed] [Google Scholar]
- 14. Baillie G. S., Huston E., Scotland G., Hodgkin M., Gall I., Peden A. H., MacKenzie C., Houslay E. S., Currie R., Pettitt T. R., Walmsley A. R., Wakelam M. J., Warwicker J., and Houslay M. D. (2002) TAPAS-1, a novel microdomain within the unique N-terminal region of the PDE4A1 cAMP-specific phosphodiesterase that allows rapid, Ca2+-triggered membrane association with selectivity for interaction with phosphatidic acid. J. Biol. Chem. 277, 28298–28309 [DOI] [PubMed] [Google Scholar]
- 15. Kassas N., Tryoen-Tóth P., Corrotte M., Thahouly T., Bader M. F., Grant N. J., and Vitale N. (2012) Genetically encoded probes for phosphatidic acid. Methods Cell Biol. 108, 445–459 [DOI] [PubMed] [Google Scholar]
- 16. Braun V., Fraisier V., Raposo G., Hurbain I., Sibarita J. B., Chavrier P., Galli T., and Niedergang F. (2004) TI-VAMP/VAMP7 is required for optimal phagocytosis of opsonised particles in macrophages. EMBO J. 23, 4166–4176 [DOI] [PMC free article] [PubMed] [Google Scholar]
- 17. Czibener C., Sherer N. M., Becker S. M., Pypaert M., Hui E., Chapman E. R., Mothes W., and Andrews N. W. (2006) Ca2+ and synaptotagmin VII-dependent delivery of lysosomal membrane to nascent phagosomes. J. Cell Biol. 174, 997–1007 [DOI] [PMC free article] [PubMed] [Google Scholar]
- 18. Gagnon E., Duclos S., Rondeau C., Chevet E., Cameron P. H., Steele-Mortimer O., Paiement J., Bergeron J. J., and Desjardins M. (2002) Endoplasmic reticulum-mediated phagocytosis is a mechanism of entry into macrophages. Cell 110, 119–131 [DOI] [PubMed] [Google Scholar]
- 19. Touret N., Paroutis P., Terebiznik M., Harrison R. E., Trombetta S., Pypaert M., Chow A., Jiang A., Shaw J., Yip C., Moore H. P., van der Wel N., Houben D., Peters P. J., de Chastellier C., et al. (2005) Quantitative and dynamic assessment of the contribution of the ER to phagosome formation. Cell 123, 157–170 [DOI] [PubMed] [Google Scholar]
- 20. Bainton D. F., Takemura R., Stenberg P. E., and Werb Z. (1989) Rapid fragmentation and reorganization of Golgi membranes during frustrated phagocytosis of immobile immune complexes by macrophages. Am. J. Pathol. 134, 15–26 [PMC free article] [PubMed] [Google Scholar]
- 21. Iyer S. S., Barton J. A., Bourgoin S., and Kusner D. J. (2004) Phospholipases D1 and D2 coordinately regulate macrophage phagocytosis. J. Immunol. 173, 2615–2623 [DOI] [PubMed] [Google Scholar]
- 22. Corrotte M., Chasserot-Golaz S., Huang P., Du G., Ktistakis N. T., Frohman M. A., Vitale N., Bader M. F., and Grant N. J. (2006) Dynamics and function of phospholipase D and phosphatidic acid during phagocytosis. Traffic 7, 365–377 [DOI] [PubMed] [Google Scholar]
- 23. Corrotte M., Nyguyen A. P., Harlay M. L., Vitale N., Bader M. F., and Grant N. J. (2010) Ral isoforms are implicated in FcγR-mediated phagocytosis: activation of phospholipase D by RalA. J. Immunol. 185, 2942–2950 [DOI] [PubMed] [Google Scholar]
- 24. Ali W. H., Chen Q., Delgiorno K. E., Su W., Hall J. C., Hongu T., Tian H., Kanaho Y., Di Paolo G., Crawford H. C., and Frohman M. A. (2013) Deficiencies of the lipid-signaling enzymes phospholipase D1 and D2 alter cytoskeletal organization, macrophage phagocytosis, and cytokine-stimulated neutrophil recruitment. PLoS ONE 8, e55325. [DOI] [PMC free article] [PubMed] [Google Scholar]
- 25. Bigay J., and Antonny B. (2012) Curvature, lipid packing, and electrostatics of membrane organelles: defining cellular territories in determining specificity. Dev. Cell. 23, 886–895 [DOI] [PubMed] [Google Scholar]
- 26. Pranke I. M., Morello V., Bigay J., Gibson K., Verbavatz J. M., Antonny B., and Jackson C. L. (2011) α-Synuclein and ALPS motifs are membrane curvature sensors whose contrasting chemistry mediates selective vesicle binding. J. Cell Biol. 194, 89–103 [DOI] [PMC free article] [PubMed] [Google Scholar]
- 27. Kooijman E. E., Carter K. M., van Laar E. G., Chupin V., Burger K. N., and de Kruijff B. (2005) What makes the bioactive lipids phosphatidic acid and lysophosphatidic acid so special? Biochemistry 44, 17007–17015 [DOI] [PubMed] [Google Scholar]
- 28. Wang W., Anderson N. A., Travesset A., and Vaknin D. (2012) Regulation of the electric charge in phosphatidic acid domains. J. Phys. Chem. B. 116, 7213–7220 [DOI] [PubMed] [Google Scholar]
- 29. Andreyev A. Y., Fahy E., Guan Z., Kelly S., Li X., McDonald J. G., Milne S., Myers D., Park H., Ryan A., Thompson B. M., Wang E., Zhao Y., Brown H. A., Merrill A. H., et al. (2010) Subcellular organelle lipidomics in TLR-4-activated macrophages. J. Lipid Res. 51, 2785–2797 [DOI] [PMC free article] [PubMed] [Google Scholar]
- 30. Potocký M., Pleskot R., Pejchar P., Vitale N., Kost B., and Zárský V. (2014) Live-cell imaging of phosphatidic acid dynamics in pollen tubes visualized by Spo20p-derived biosensor. New. Phytol. 203, 483–494 [DOI] [PubMed] [Google Scholar]
- 31. Putta P., Rankenberg J., Korver R. A., van Wijk R., Munnik T., Testerink C., and Kooijman E. E. (2016) Phosphatidic acid binding proteins display differential binding as a function of membrane curvature stress and chemical properties. Biochim. Biophys. Acta 1858, 2709–2716 [DOI] [PubMed] [Google Scholar]
- 32. Young B. P., Shin J. J., Orij R., Chao J. T., Li S. C., Guan X. L., Khong A., Jan E., Wenk M. R., Prinz W. A., Smits G. J., and Loewen C. J. (2010) Phosphatidic acid is a pH biosensor that links membrane biogenesis to metabolism. Science 329, 1085–1088 [DOI] [PubMed] [Google Scholar]
- 33. Horchani H., de Saint-Jean M., Barelli H., and Antonny B. (2014) Interaction of the Spo20 membrane-sensor motif with phosphatidic acid and other anionic lipids, and influence of the membrane environment. PLoS ONE 9, e113484. [DOI] [PMC free article] [PubMed] [Google Scholar]
- 34. Hofbauer H. F., Schopf F. H., Schleifer H., Knittelfelder O. L., Pieber B., Rechberger G. N., Wolinski H., Gaspar M. L., Kappe C. O., Stadlmann J., Mechtler K., Zenz A., Lohner K., Tehlivets O., Henry S. A., and Kohlwein S. D. (2014) Regulation of gene expression through a transcriptional repressor that senses acyl-chain length in membrane phospholipids. Dev. Cell 29, 729–739 [DOI] [PMC free article] [PubMed] [Google Scholar]
- 35. Huston E., Gall I., Houslay T. M., and Houslay M. D. (2006) Helix-1 of the cAMP-specific phosphodiesterase PDE4A1 regulates its phospholipase-D-dependent redistribution in response to release of Ca2+. J. Cell Sci. 119, 3799–3810 [DOI] [PubMed] [Google Scholar]
- 36. Karathanassis D., Stahelin R. V., Bravo J., Perisic O., Pacold C. M., Cho W., and Williams R. L. (2002) Binding of the PX domain of p47(phox) to phosphatidylinositol 3,4-bisphosphate and phosphatidic acid is masked by an intramolecular interaction. EMBO J. 21, 5057–5068 [DOI] [PMC free article] [PubMed] [Google Scholar]
- 37. Phillips M. J., and Voeltz G. K. (2016) Structure and function of ER membrane contact sites with other organelles. Nat. Rev. Mol. Cell Biol. 17, 69–82 [DOI] [PMC free article] [PubMed] [Google Scholar]
- 38. Giordano F., Saheki Y., Idevall-Hagren O., Colombo S. F., Pirruccello M., Milosevic I., Gracheva E. O., Bagriantsev S. N., Borgese N., and De Camilli P. (2013) PI(4,5)P(2)-dependent and Ca2+-regulated ER-PM interactions mediated by the extended synaptotagmins. Cell 153, 1494–1509 [DOI] [PMC free article] [PubMed] [Google Scholar]
- 39. Becker T., Volchuk A., and Rothman J. E. (2005) Differential use of endoplasmic reticulum membrane for phagocytosis in J774 macrophages. Proc. Natl. Acad. Sci. U.S.A. 102, 4022–4026 [DOI] [PMC free article] [PubMed] [Google Scholar]
- 40. Vitale N., Patton W. A., Moss J., Vaughan M, Lefkowitz R. J., and Premont R. T. (2000) GIT proteins, a novel family of phosphatidylinositol 3,4,5-trisphosphate-stimulated GTPase-activating proteins for ARF6. J. Biol. Chem. 275, 13901–13906 [DOI] [PubMed] [Google Scholar]
- 41. Vitale N., Moss J., and Vaughan M. (1996) ARD1, a 64-kDa bifunctional protein containing an 18-kDa GTP-binding ADP-ribosylation factor domain and a 46-kDa GTPase-activating domain. Proc. Natl. Acad. Sci. U.S.A. 93, 1941–1944 [DOI] [PMC free article] [PubMed] [Google Scholar]
- 42. Vitale N., Caumont A. S., Chasserot-Golaz S., Du G., Wu S., Sciorra V. A., Morris A. J., Frohman M. A., and Bader M. F. (2001) Phospholipase D1: a key factor for the exocytotic machinery in neuroendocrine cells. EMBO J. 20, 2424–2434 [DOI] [PMC free article] [PubMed] [Google Scholar]
- 43. Vitale N., Moss J., and Vaughan M. (1998) Molecular characterization of the GTPase-activating domain of ADP-ribosylation factor domain protein 1 (ARD1). J. Biol. Chem. 273, 2553–2560 [DOI] [PubMed] [Google Scholar]
- 44. Vitale N., Pacheco-Rodriguez G., Ferrans V. J., Riemenschneider W., Moss J., and Vaughan M. (2000) Specific functional interaction of human cytohesin-1 and ADP-ribosylation factor domain protein (ARD1). J. Biol. Chem. 275, 21331–21339 [DOI] [PubMed] [Google Scholar]
- 45. Pant S., Sharma M., Patel K., Caplan S., Carr C. M., and Grant B. D. (2009) AMPH-1/Amphiphysin/Bin1 functions with RME-1/Ehd1 in endocytic recycling. Nat Cell Biol. 11, 1399–1410 [DOI] [PMC free article] [PubMed] [Google Scholar]
- 46. Bigay J., Casella J. F., Drin G., Mesmin B., and Antonny B. (2005) ArfGAP1 responds to membrane curvature through the folding of a lipid packing sensor motif. EMBO J. 24, 2244–2253 [DOI] [PMC free article] [PubMed] [Google Scholar]
- 47. Giridharan S. S., Cai B., Vitale N., Naslavsky N., and Caplan S. (2013) Cooperation of MICAL-L1, syndapin2, and phosphatidic acid in tubular recycling endosome biogenesis. Mol. Biol. Cell 24, 1776–1790 [DOI] [PMC free article] [PubMed] [Google Scholar]
- 48. Vitale N., Chasserot-Golaz S., Bailly Y., Morinaga N., Frohman M. A., and Bader M. F. (2002) Calcium-regulated exocytosis of dense-core vesicles requires the activation of ADP-ribosylation factor (ARF)6 by ARF nucleotide binding site opener at the plasma membrane. J. Cell Biol. 159, 79–89 [DOI] [PMC free article] [PubMed] [Google Scholar]
- 49. Bligh E. G., and Dyer W. J. (1959) A rapid method of total lipid extraction and purification. Can. J. Biochem. Physiol. 37, 911–917 [DOI] [PubMed] [Google Scholar]
- 50. Shui G., Guan X. L., Gopalakrishnan P., Xue Y., Goh J. S., Yang H., and Wenk M. R. (2010) Characterization of substrate preference for Slc1p and Cst26p in Saccharomyces cerevisiae using lipidomic approaches and an LPAAT activity assay. PLoS ONE 5, e11956. [DOI] [PMC free article] [PubMed] [Google Scholar]