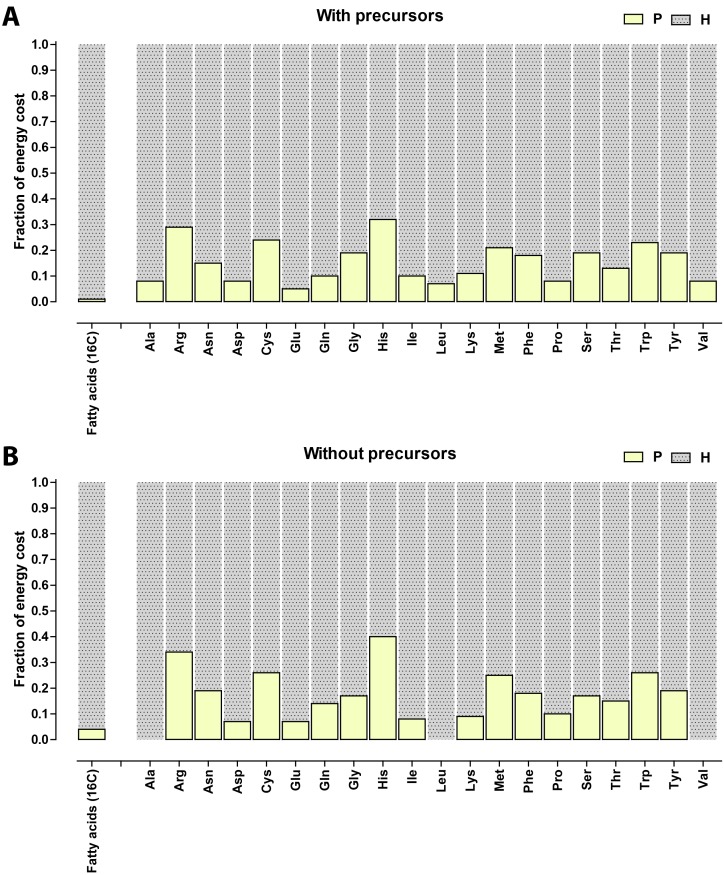
Appendix 1—figure 1. Relative contribution of ATP (P) and NADH/NADPH/FADH (H) to the biosynthetic costs of lipids and amino acids.
(A) Nonreduced costs including opportunity cost of precursors; (B) Reduced costs without precursors. Amino acid values are obtained from Akashi and Gojobori (2002), assuming growth on glucose.

