Abstract
Background:
Noise remains a nuisance which impacts negatively on the physical, social and psychological wellbeing of man. It aggravates chronic illnesses like hypertension and other cardiopulmonary diseases. Unfortunately, increased activities from industrialization and technological transfers/drifts have tumultuously led to increased noise pollution in most of our fast growing cities today and hence the need for concerted efforts in monitoring and regulating our environmental noise.
Objective:
To assess the equivalent noise level (Leq) in Abuja municipality and promote a simple method for regular assessment of Leq within our environment.
Method:
This is a cross-sectional community based study of the environmental Leq of Abuja municipality conducted between January 2014 and January 2016. The city was divided into 12 segments including residential, business and market areas via the Abuja Geographic Information System. The major markets were captured separately on a different scale. Measurements were taken with the mobile phone softwares having validated this with Extech 407730 digital sound level meter, serial no Z310135. Leq(A) were measured at different points and hours of the day and night. The average Leq(A) were classified according to localities and compared with WHO standard safety levels.
Results:
LeqD ranged 71-92dB(A); 42-79dB(A) and 69-90dB(A) in business/ parks, residential and market places respectively. The Night measurements were similar 18dB(A)-56dB(A) and the day-night Leq(A)=77.2dB(A) and 90.4dB(A) for residential and business zones.
Conclusion:
The night noise levels are satisfactory but the day and day-night levels are above the recommended tolerable values by WHO and therefore urgently call for awareness and legislative regulations.
Keywords: Noise, Environment, Noise equivalent level, Mobile phone, Android boy1 app
INTRODUCTION
Noise pollution contributes to environmental degradation and poses a threat to human and terrestrial lives. In most cosmopolitan cities, noise pollution (community and industrial) ranks third as the most hazardous form of pollution behind air and water pollution.1 Common sources of environmental (community) noise pollution include road, railway and air traffic, neighborhood activities, construction and public works. 2 On the other hand, noise from industrial work places constitutes industrial noise pollution. 2 It is generally agreed by many that the trend of noise pollution is on increase in magnitude and severity with more widespread reach, due to population growth, technological advancement and urbanization.3
In times past, environmental pollution was primarily considered within the purview of chemical and other noxious substances being extruded into the environment. Inadequate attention was paid to noise as a form of pollution with the earlier widespread cliché being that noise differs from other forms of pollution in that, once abated, noise leaves no residual accumulation in the environment or the human body.4 This erroneous mantra that "noise leaves no visible evidence" has been debunked by later research which revealed the widespread deleterious effect of noise in both its' course and post-occurrence periods. 5-9
Noise has adverse impact on the physical, social and psychological wellbeing of man and can lead to either permanent or temporary hearing loss.5-7 Acoustic trauma, tympanic membrane perforations and ossicular chain disarticulations can result from excessively loud noise/blasts. Noise induced hearing loss (type of sensorineural hearing loss) is ascribed to prolonged exposition to noise beyond the physiological recovery and reversible point of the hearing apparatus (i.e. beyond the temporary threshold shift). 10-14
Noise pollution has been proven to aggravate chronic illnesses like hypertension and other cardiopulmonary diseases.8, 9 Recent studies have established relationships between noise and cardiovascular disease (CVD) with the causal route ascribed to neuroendocrine alterations characterized by increased release of cortisol and catecholamine. Furthermore, chronic noise exposure has been associated with hyperlipidemia which is a corollary to hypertension.15-17 Sleep disturbance, annoyance and anxiety disorders are also well studied adverse effects of noise.18, 19 Consequently, some studies have summarily referred to noise pollution as a modern plague.3, 13
Many countries do not have regulations/legislation on noise pollution due to lack of the political will or the insight into the deleterious effect on environmental life and the ecosystem. On the other hand, the associated difficulty in defining, evaluating and devising control measures for environmental noise especially those of neighborhood origin has been highlighted as a strong militating factor towards an effective control.20
Commonly, the sound level meter or sound meter, an instrument that measures sound pressure level, is used in noise pollution studies for the quantification of different classes of noise including industrial, aircraft and other environmental forms.21-23 The unit of measurement is in decibel (dB) which is a logarithmic mode of quantifying sound loudness, intensity and pressure. The A-weighted variety of sound wave measurement is used for the quantification of the environmental noise in dB(A) units. An increase in 10dB is equivalent to doubling the loudness of sound, while increase by 6dB and 3dB doubles the Sound Pressure Level (SPL) and Intensity of the sound respectively.24
This study was basically to evaluate the noise dB(A) pattern (levels, places and time) in our environment. In addition was the aim of promoting a simple and person oriented method for regular assessment of the noise levels within our environment, with the added purpose of creating awareness.
METHODOLOGY
This is a cross-sectional community based study of the environmental equivalent noise levels within the Abuja municipal council conducted between January 2014 and January 2016. The study areas included residential, business districts and markets within the city mapped through the Abuja Geographic Information System (AGIS).25 The list is in Table 1.
Table 1:
List of the study areas classified as residential, business and market areas.
| Residential areas | Business areas | Markets |
|---|---|---|
|
| ||
| Apo | Area 1 Round about | Garki International Market |
| Aso drive | AYA junction | Jabi |
| Asokoro | Banex plaza area | Wuse |
| Garki (1 & 2) | Berger Junction | Utako |
| Gwarimpa | Central business district | |
| Jabi | Garki hospital | |
| Kubwa | UTC Junction | |
Abuja municipality (the study site) is a fast growing city located between latitude 8.25° and 9.25° North and longitude 6.45° and 7.39° East. Although the official population according to 2006 census stood at 776, 298, the rapid migration of internally displaced citizens as a result of insurgency and terrorism in the North-East, and daily migration of people into the city for business is believed to have doubled this figure.
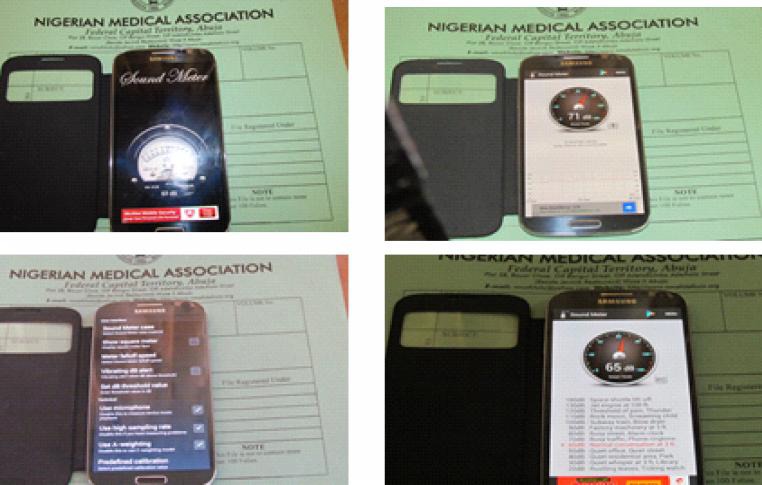
The mobile phone sound meter software system (Figure 1) 26, 27 was used in taking the measurements of the Equivalent sound levels (Leq) in decibels dB(A). The validity of the mobile phone sound meter software system was confirmed through synchronized series of measurements on three different phone models against the Extech 407730 digital sound level meter, serial number Z310135 (an A type integrated sound level meter). The use of mobile phones app (android boy1) have been shown to correlate with Sound Level Meter and validated for environmental sound level measurement.28
Fig. 1:

Shows the mobile phone sound meter Apps
The environmental equivalent noise levels [(Leq in dB (A)] were measured at different randomly selected spots and averages taken within the same locality in the day time (9 am - Noon) and at night hours (9pm - Midnight). Three different phone models used here was for comparison and to obtain synchronous values averaged at different locations. The phones were held 1.5 meters above ground levels around each spot/source for ¼ of an hour before readings were taken to ensure good area coverage, stability and uniformity in measurements. The measurements were performed on work days (Monday to Friday) only, excluding weekends; public holidays and festive days since human activities in the Federal Capital Territory, Abuja fluctuate within these periods and may not reflect the true picture. Only day time readings were obtained from the markets because the premises remained closed by 6pm with zero activities till next day.
The day-night average noise levels was calculated using the "Ldn, Lden, CNEL-Community Noise Calculator" (Noise Meter Incorporated).29 Results were evaluated by the Statistical Package for Social Sciences (SPSS) 16 and presented in simple descriptive format (figures and tables). The standard reference for analyzing the level of severity of the values obtained was based on the acceptable safety environmental noise levels of the WHO. 20, 30
RESULTS
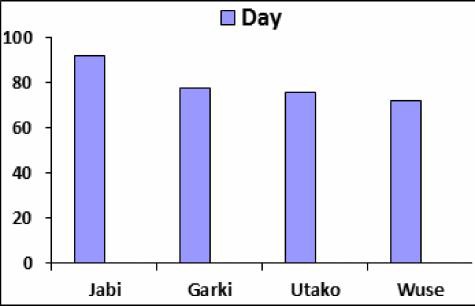
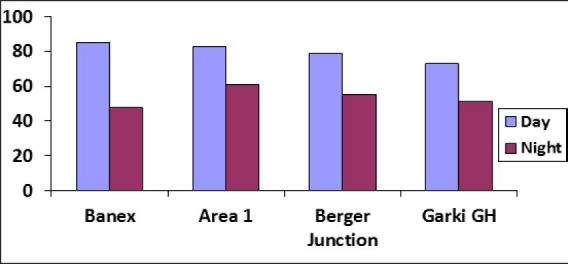
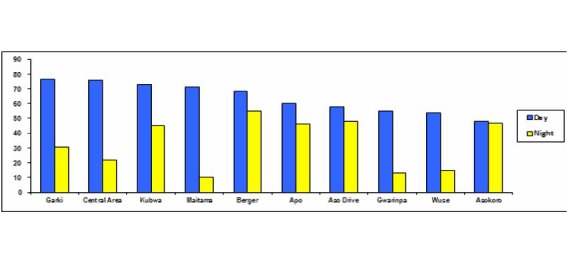
The charts and table illustrate the results (average noise equivalent values) obtained from each location within the district. They are classified according to the activities - Markets (Figure 2), Business areas (Figure 3) and Residential areas (Figure 4) respectively. The markets comprise of the four major official markets in Abuja municipality. The business areas include places engaged in activities like motor- and recreational-parks, hospital spots, office areas and institutions. These are zones associated with heavy human movements and activities especially during the day.
Fig. 2:

Shows the environmental noise levels within the major market/motor park areas of Abuja municipality. The Jabi market/park areas were found to be highly unsatisfactory.
Fig. 3:

Illustrates the day and night noise levels within the business districts of Abuja municipality. The night noise levels were satisfactory unlike the day.
Fig. 4:

represents the day and night environmental noise levels recorded in the 10 residential areas within the Abuja municipality. Essentially the day time values in most of the areas were unsatisfactory whereas the night values in all the districts were within acceptable values.
On the other hand, the residential areas were mapped for the living homes with minimal business activities. These areas are relatively quiet as shown in Figure 4.
The market place is a beehive of activity with antecedent persistent noise generated from human and goods movements within the designated hours of operation as seen in Figure 4.
DISCUSSION
The day time noise levels at market and motor park areas of the Abuja municipality (Table 1) were generally high and mostly unsatisfactory ranging from 73 to 92dB(A) (Figures 2 and 3). The Jabi Park/Market was the nosiest part of the municipality mainly due to the very high human and vehicular activities within this confine. Literally all inter-city and long distance vehicles including heavy-duty trucks and luxurious buses have their terminals at Jabi. In addition, a very busy market (the Jabi market) is domiciled there in. These factors are well-established sources of environmental pollution globally.31
In an earlier study21, Jabi park ranked third behind Central business district. The reversal in our study could be attributed to massive human traffic resulting from migration into the FCT since the onset of insurgency and terrorist activities within the northern part of Nigeria. Abuja being a fairly secure city has been a haven for casualties and internally displaced people within the last 3 years and these activities have been on the rise. From the current study, Central Business District's environmental noise (the highest from previous study21) came a distant 4th behind Garki Area 1, Berger Roundabout and Banex Plaza (Figure 2). The reason for the above is similar to the earlier one, given that the latter areas also function as major portals of entry and exit into the city.
Comparative analysis suggests a significant rise in noise pollution in Abuja. The current highest of 92 dB(A) compared with an earlier 83dB(A) recorded by Anomohanram in 201321 is worrisome since the difference of 9dB(A) basically translates to an approximate sequential doubling of the noise loudness and tripling of the sound pressure level. This also surpassed the 86dB(A) recorded in the heavy traffic laden areas of Abraka, Delta State, Nigeria22 and compares to the extreme levels [96dB(A)] recorded from heavy traffic areas in India.32 According to the OSHA and WHO permissible noise levels, workers within such environments [noise levels of 92dB(A)] must not expend over 5.2 working hours per day. On the contrary, the motor-park workers here in Abuja spend within the range of 10-12 hours daily with the antecedent deleterious consequences. It is worthy of note that some of the workers spent decades within this noxious environment without screening or hearing conservative programs in place.
The average of 75dB(A) recorded in the markets within the municipality does not appear overtly hazardous. This is because hearing impairment is not expected to occur at LA(eq), 8h 75dB(A) or below even in cases of prolonged occupational noise.33 However, this is still unsatisfactory since noise of such magnitude inhibits full intelligibility in listeners with normal hearing and could predispose to other psycho-physical anomalies according to individual susceptibilities and noise exposed years. The bad situation is further compounded by the siting of some residential areas and schools close to the Jabi motor park and the Garki market places within the city. The chronic noise emanating from these sources could constitute obvious health hazard of different classes and magnitude including cardiovascular disorders. Sorensens et al noted that a 10dB increase in chronic exposition of noise in humans increases the risk of cardiovascular accident (CVA) by 14% and systolic blood pressure appreciation by 0.26mmHg.16
Furthermore, Erikson et al postulated that a persistent noise level ≥50dB is associated with the risk of CVD.17 Some experimental studies also demonstrated interference with the brain cortical maturation following chronic exposition to noise hence the need for situating institutions of learning and residential homes in a serene environment.
The day time noise values recorded in most of the residential areas including Garki Areas 2-11; Central District Area; Kubwa and Maitama [range 68-81dB(A)], are beyond the recommended average 55dB(A) by WHO and deserve urgent attention. A close study of these settings revealed a progressive encroachment and unauthorized conversion of many residential areas into business outlets; even parts of Maitama district have experienced proliferation of financial institutions with the consequent increase in human and vehicular traffic. Some of the Consulates and foreign Embassies have refused to utilize the area mapped out for them within the central business district (cadastral zone) and are stuck to these residential homes, thus generating noise on a daily basis. However, Asokoro, Aso drive, Wuse II and Gwarimpa conform within the normal residential day time environmental levels. This is in agreement with the earlier report by Anomohanran.21 These areas though highbrow like Maitama, do not have its corresponding levels of day time sound levels due to less level of encroachment.
Noise levels measured in residential areas showed a mixed pattern for night time. Maitama, Central area, Wuse, Gwarinpa, and Garki had night time noise level ≤22db. The remaining residential areas where measurements were taken had values suggesting persisting noise level of ≥45 db at night as seen in Asokoro, Aso drive, Apo, Berger area, Kubwa and some areas of Garki. This suggests significant persistent noise generating human activities well into the night public sites offering services that encouraged human activities.30-36 Interestingly, both day and night noise levels were approximately equal in Asokoro which suggests that the level of human activities in this elitist-area of Abuja is constant at both day and night. This is likely a factor of the relatively low population and selected class of people inhabiting there. Generally, the night sound levels in Abuja are fairly good in contrast to the overall day time levels. This is encouraging and enhances good rest after prolonged exposure to the day time noise pollution. To this end, a strict adherence to the recommended maximum 8 hours exposure to fairly high noise in work place and good rest at homes shall offer protection to the inhabitants following the current findings.
Finally, the day night average of 77.1dB (A) recorded at the residential areas also calls for need on regulation and protection of these areas from illegal business premises and potential noise generating spots. This value represents the impact of traffic on road, air and general industry on the local population. The noise level around the business areas and motor-parks in Abuja municipality has reached an unsatisfactory threshold and needs urgent attention.
The successful utilization of the mobile phone in the execution of this study is a further demonstration of its validity in monitoring environmental noise.28, 37-39
In conclusion, the day noise levels in Abuja municipality are above the tolerable recommended values by WHO and therefore urgently calls for awareness, regulation via intense health campaign and legislation. The method of measurement and monitoring of the environmental noise level using mobile phones (app android boy1) is efficient and should be encouraged considering its people oriented and great awareness potential among the community members.
RECOMMENDATION
The environmental agencies and health authorities should regularly evaluate the environmental noise levels and its effects through the intensity, loudness and pressure levels in order to promptly protect the inhabitants.
Table 2:
Assessment of day-night average noise levels
| Locality | Day-Night dB (A) values | Assessment |
|---|---|---|
|
| ||
| Residential | 77.2 | Satisfactory |
| Business and Parks | 90.4 | Unsatisfactory |
| Market places | Only day values are available | Unsatisfactory |
The results of the day –night average noise levels were recorded for residential and business areas as shown in Table 2. However, no values for the market places were recorded since only the day noise levels were obtained as earlier explained.
ACKNOWLEDGEMENT
Our appreciation goes to Nigerian Medical Association Federal Capital Territory (FCT), the Market Women Association of Nigeria and the National Union of Road Transport Workers (NURTW) for their cooperation and encouragement during the period of the research.
REFERENCES
- 1.World Health Organization. United Nation road safety collaboration: a hand book of partner profiles. Geneva: World Health Organization; 2005. pp. 1–5. [Google Scholar]
- 2.Moudon AV. Real noise from the urban environment: How ambient community noise affects health and what can be done about it. Am J Prev Med. 2009;37:167–171. doi: 10.1016/j.amepre.2009.03.019. [DOI] [PubMed] [Google Scholar]
- 3.Goines L, Hagler L. Noise pollution: A modern plague. South Med J. 2007;100:287–294. doi: 10.1097/smj.0b013e3180318be5. [DOI] [PubMed] [Google Scholar]
- 4.Lai P. Noise Pollution. In: Theodore K Mary, Theodore Louis., editors. Major Environmental Issues Facing the 21st Century. NJ: Upper Saddle River; 1996. pp. 389–396. [Google Scholar]
- 5.Hessel PA. Hearing loss among construction workers in Edmonton, Alberta, Canada. J Occup Environ Med . 2000;42(1):57–63. doi: 10.1097/00043764-200001000-00014. [DOI] [PubMed] [Google Scholar]
- 6.Hessel PA, Sluis-Cremer G K. Hearing loss in white South African goldminers. S. Afr. Med. J. 1987;71:364–367. [PubMed] [Google Scholar]
- 7.Ahmed HO, Dennis JH, Badran O, et al. Occupational noise exposure and hearing loss of workers in two plants in eastern Saudi Arabia. Ann Occup Hyg . 2001;45(5):371–380. [PubMed] [Google Scholar]
- 8.Alam JB, Alam MJB, Rahman MM, et al. Study on traffic noise level of Sylhet by multiple regression analysis associated with health hazards. Iran Journal of Environ. Health Sci. Eng. 2006;3(2):71–78. [Google Scholar]
- 9.Sobotova L, Jurkovicova J, Stefanikova Z, et al. Community response to environmental noise and the impact on cardiovascular risk score. Sci Total Environ. 2010;408:1264–1270. doi: 10.1016/j.scitotenv.2009.12.033. [DOI] [PubMed] [Google Scholar]
- 10.Cave KM, Cornish EM, Chandler DW. Blast injury of the ear: Clinical update from the global war on terror. Military Medicine. 2007;172:726–730. doi: 10.7205/milmed.172.7.726. [DOI] [PubMed] [Google Scholar]
- 11.Talaska AE, Schacht J. Mechanisms of noise damage of the cochlea. Audiological Medicine. 2007;5:3–9. [Google Scholar]
- 12.Henderson D, Bielefeld EC, Harris KC, Hu BH. The role of oxidative stress in noise-induced hearing loss. Ear & Hearing. 2006;27(1):1–19. doi: 10.1097/01.aud.0000191942.36672.f3. [DOI] [PubMed] [Google Scholar]
- 13.Clark WW. Hearing: The effect of noise. Otolaryngol Head Neck Surg. 1992;106:669–764. doi: 10.1177/019459989210600610. [DOI] [PubMed] [Google Scholar]
- 14.Liberman MC, Dodds LW. Single-neuron labeling and chronic cochlear pathology. III. Stereocilia damage and alterations of threshold tuning curves. Hear Res. 1984;16:55–74. doi: 10.1016/0378-5955(84)90025-x. [DOI] [PubMed] [Google Scholar]
- 15.Mahmood R, Par veen N, Jilani G, et al. Cardiovascular effects of short term noise of a constant frequency and intensity. Pak J Physiol. 2008;4(2):20–23. [Google Scholar]
- 16.Sorensen M, Hvidberg M, Hoffmann B, Andersen Zorana J, et al. Exposure to road traffic and railway noise and associations with blood pressure and self-reported hypertension: a cohort study. Environ. Health. 2011;10 doi: 10.1186/1476-069X-10-92. [DOI] [PMC free article] [PubMed] [Google Scholar]
- 17.Eriksson C, Nilsson Mats E, Willers Saskia M, et al. Traffic noise and cardiovascular health in Sweden: The roadside study. Noise and Health. 2012;14(59):140–147. doi: 10.4103/1463-1741.99864. [DOI] [PubMed] [Google Scholar]
- 18.Agarwal S, Swami BL. Noise annoyance under interrupted traffic flow condition for Jaipur City. International Journal of Applied Science and Engineering. 2009;7(2):159–168. [Google Scholar]
- 19.Miedema H. Annoyance caused by environmental noise: Elements for evidence-based noise policies. J Soc Issues. 2007;63(1):41–57. [Google Scholar]
- 20.Guidelines for Community noise. WHO Expert Task Force. 1999. http://apps.who.int/iris/handle/10665/66217. [accessed on 27/121/2014]. http://apps.who.int/iris/handle/10665/66217
- 21.Anomohanran O. Evaluation of Environmental Noise Pollution In Abuja, The Capital City Of Nigeria. International Journal of Research and Reviews in Applied Sciences. 2013;14 (2):470–476. [Google Scholar]
- 22.Anomohanran O, Iwegbue CMA, Oghenerhoro O, Egbai OJC. Investigation of environmental noise pollution level of Abraka in Delta State, Nigeria. Trends Appl Sci Res. 2008;3(4):292–297. [Google Scholar]
- 23.Santini S, Ostermaier B, Vitaletti A. "First experiences using wireless sensor networks for noise pollution monitoring". in Proceedings of the 3rd ACM Workshop on Real-World Wireless Sensor Networks (REALWSN'08); April 2008; Glasgow, United Kingdom. [Google Scholar]
- 24.Tontechnik-Rechner S. Sound Studio and Audio Calculations Audio and Acoustics Conversions Assistance and explanations of special issues around the recording technology.www.sengpielaudio.com/calculator-levelchange.htm . [accessed 20/12/14].
- 25.AGIS. Map Showing Six Districts in Abuja Municipal Area Councils of FCT Nigeria. www.abujaagis.com/aboutagis.html . [accessed 15/1/2014].
- 26.Android boy. Sound Level Meter. (ver1.6) http://androidboy1.blogspot.com . [accessed 12/1/2014].
- 27.Professional sound level meter. Sound Meter V2.7 http://trajkovski.net . [accessed 12/1/2014].
- 28.Ibekwe TS, David FO, Dahilo EA , et al. Evaluation of Mobile smartphones App as a screening tool for Environmental Noise Monitoring. J Occup Environ Hyg. 2015;29:1–20. doi: 10.1080/15459624.2015.1093134. [DOI] [PubMed] [Google Scholar]
- 29.Noise Meter Inc. Ldn, Lden, CNEL - Community Noise Calculators. http://noisemeters.com/apps/ldn-calculator.asp . [accessed 15/1/2014].
- 30.World Health Organization. WHO Regional Office for Europe, Night noise guidelines for Europe, Copenhagen. 2009.
- 31.Bluhm G, Nordling E, Berglind N. Road traffic noise and annoyance - An increasing Environmental problem. Noise and Health. 2004;6:43–49. [PubMed] [Google Scholar]
- 32.Goswami S, Swain BK, Panda SK. Assessment, appraisal and analysis of road traffic noise pollution Rourkela city India. J Environ Biol. 2013;34:891–895. [PubMed] [Google Scholar]
- 33.Berglund B, Lindvall T, Dietrich S WHO. Guideline on community noise. WHO Geneva: 1999. [Google Scholar]
- 34.Olayinka OS, Abdullahi SA. A statistical analysis of the day-time and night-time noise levels in Ilorin Metropolis, Nigeria. Trends Appl Sci Res. 2008;3(3):253–266. [Google Scholar]
- 35.Yilmaz H, Ozer S. Evaluation and analysis of environmental noise pollution in the city of Erzurum, Turkey. Int J Environ Pollut. 2005;23(4):438–448. [Google Scholar]
- 36.Neitzel R, Gershon RR, Zeltser M, et al. Noise Levels Associated with New York City's Mass Transit Systems. Am J Public Health . 2009;99(8):1393–1399. doi: 10.2105/AJPH.2008.138297. [DOI] [PMC free article] [PubMed] [Google Scholar]
- 37.Maisonneuve N, Stevens M, Ochab B. Participatory noise pollution monitoring using mobile phones. Information Polity. 2010;15:51–71. [Google Scholar]
- 38.Maisonneuve N, Stevens M, Niessen M E, Steels L. NoiseTube: Measuring and mapping noise pollution with mobile phones. In: Athanasiadis I.N., Mitkas P.A., Rizzoli A.E., Gmez J.M., editors. ITEE 2009 Information Technologies in Environmental Engineering Proceedings of the 4th International ICSC Symposium in Thessaloniki; May 28 29, 2009; Greece. Berlin Heidelberg: Springer; 2009. May, pp. 215–228. [Google Scholar]
- 39.Leao S, Ong KL, Krezel A. 2 Loud?: Community mapping of exposure to traffic noise with mobile Phones. Environ Monit Assess. 2014;186(10):6193–6206. doi: 10.1007/s10661-014-3848-9. [DOI] [PubMed] [Google Scholar]


