

Abstract
The lithium air, or Li–O2, battery system is a promising electrochemical energy storage system because of its very high theoretical specific energy, as required by automotive applications. Fundamental research has resulted in much progress in mitigating detrimental (electro)chemical processes; however, the detailed structural evolution of the crystalline Li2O2 and LiOH discharge products, held at least partially responsible for the limited reversibility and poor rate performance, is hard to measure operando under realistic electrochemical conditions. This study uses Rietveld refinement of operando X-ray diffraction data during a complete discharge–charge cycle to reveal the detailed structural evolution of Li2O2 and LiOH crystallites in 1,2-dimethoxyethane (DME) and DME/LiI electrolytes, respectively. The anisotropic broadened reflections confirm and quantify the platelet crystallite shape of Li2O2 and LiOH and show how the average crystallite shape evolves during discharge and charge. Li2O2 is shown to form via a nucleation and growth mechanism, whereas the decomposition appears to start at the smallest Li2O2 crystallite sizes because of their larger exposed surface. In the presence of LiI, platelet LiOH crystallites are formed by a particle-by-particle nucleation and growth process, and at the end of discharge, H2O depletion is suggested to result in substoichiometric Li(OH)1–x, which appears to be preferentially decomposed during charging. Operando X-ray diffraction proves the cyclic formation and decomposition of the LiOH crystallites in the presence of LiI over multiple cycles, and the structural evolution provides key information for understanding and improving these highly relevant electrochemical systems.
Introduction
The rechargeable nonaqueous
Li–O2 battery has
been widely investigated because of its extremely high theoretical
energy density amounting to 3500 Wh/kg for the overall battery reaction  .1 In the past
10 years,2−4 significant progress has been realized in understanding
the complex chemistry that governs the functioning of this battery
system.5−12 This has resulted in several strategies for improving the performance
of Li–O2 batteries.3,4,13−15 One deals with the reactivity
of the porous carbon-based gas diffusion electrode with the electrolyte
and the Li2O2 discharge product. This was mitigated
by the use of non-carbon porous electrodes made of gold,3 titanium carbide,4 metallic Ti4O7,14 to name a few, or by the alternative strategy of coating the porous
carbon substrate with a non-carbon-based material.15 Another important step forward has been establishing the
relationship between the electrolyte solvent donor number (DN) and
the morphology of the peroxide that forms.7 The high solubility of the intermediate LiO2 product
in high-DN electrolytes leads to a solution-mediated Li2O2 growth mechanism, resulting in toroids of Li2O2 that are responsible for large discharge capacities.
In contrast, low-DN electrolytes lead to a surface growth mechanism
of Li2O2, resulting in thin Li2O2 films that restrict the capacity and reversibility.7 Johnson et al. have pointed out that for 1,2-dimethoxyethane
(DME), having an intermediate DN, both pathways for O2 reduction
occur simultaneously at a high voltage.7 Therefore, the performance of the Li–O2 battery
is mainly governed by the generation and decomposition mechanism of
Li2O2, which itself is a poor ionic and electronic
conductor.16 In addition, the oxygen species
involved in the oxygen reduction reaction (ORR) and in the inverse
oxygen evolution reaction (OER) are highly reactive with the organic
environment and traces of moisture, leading to the formation of parasitic
products like Li2CO3, LiOH, and CO2 having a negative impact on Li–O2 battery performance.16−20
.1 In the past
10 years,2−4 significant progress has been realized in understanding
the complex chemistry that governs the functioning of this battery
system.5−12 This has resulted in several strategies for improving the performance
of Li–O2 batteries.3,4,13−15 One deals with the reactivity
of the porous carbon-based gas diffusion electrode with the electrolyte
and the Li2O2 discharge product. This was mitigated
by the use of non-carbon porous electrodes made of gold,3 titanium carbide,4 metallic Ti4O7,14 to name a few, or by the alternative strategy of coating the porous
carbon substrate with a non-carbon-based material.15 Another important step forward has been establishing the
relationship between the electrolyte solvent donor number (DN) and
the morphology of the peroxide that forms.7 The high solubility of the intermediate LiO2 product
in high-DN electrolytes leads to a solution-mediated Li2O2 growth mechanism, resulting in toroids of Li2O2 that are responsible for large discharge capacities.
In contrast, low-DN electrolytes lead to a surface growth mechanism
of Li2O2, resulting in thin Li2O2 films that restrict the capacity and reversibility.7 Johnson et al. have pointed out that for 1,2-dimethoxyethane
(DME), having an intermediate DN, both pathways for O2 reduction
occur simultaneously at a high voltage.7 Therefore, the performance of the Li–O2 battery
is mainly governed by the generation and decomposition mechanism of
Li2O2, which itself is a poor ionic and electronic
conductor.16 In addition, the oxygen species
involved in the oxygen reduction reaction (ORR) and in the inverse
oxygen evolution reaction (OER) are highly reactive with the organic
environment and traces of moisture, leading to the formation of parasitic
products like Li2CO3, LiOH, and CO2 having a negative impact on Li–O2 battery performance.16−20
Recent studies have shown that trace amounts of H2O can enhance the formation of Li2O2 and thereby improve the performance of Li–O2 batteries.21−23 The water in the electrolytes catalyzes the reaction at the cathode, typically through the presence of ruthenium and manganese nanoparticles on carbon black, to form Li2O2 and LiOH during discharge.22 The formation of LiOH occurs via the reaction of Li2O2 with H2O,23 and decomposition appears possible below 3.2 V with ruthenium-based catalysts,22,23 making LiOH an interesting cyclic discharge product for Li–O2 batteries. Highly cyclic crystalline LiOH formation was achieved by adding lithium iodide (LiI) to a DME/Li+ electrolyte in combination with a graphene oxide electrode, in the absence and presence of H2O.24 The soluble LiI redox mediator was shown to reduce the overpotential of the charge process, suggesting an iodine-mediated decomposition mechanism.25 If this decomposition mechanism results in oxygen evolution, it would make a new reversible mechanism for the Li–O2 battery, which is currently under debate as it has been proposed to be thermodynamically unfavorable26 and it has been suggested that I– is oxidized rather than LiOH.27 Burke et al.28 have recently reported that the LiOH crystallite was formed by a four-electron reduction process with the addition of LiI and H2O in the DME electrolyte upon discharge; however, the decomposition of the LiOH crystallite was primarily attributed to iodo–oxygen electrochemistry rather than reversible oxygen evolution.
Evidently, the performance of aprotic Li–O2 batteries is directly determined by the reversible formation mechanism of the discharge products, being either Li2O2 or LiOH. Therefore, studying the nature and evolution of the discharge products, preferably under realistic operando conditions, is paramount for the future design of mechanisms and materials that aim to improve performance.
In a previous work,29operando X-ray diffraction (XRD) was used to study the decomposition of Li2O2 in a TEGDME electrolyte, showing that the decomposition mechanism via a substoichiometric Li2–xO2 proceeds during charging, in agreement with density functional theory (DFT) predictions,30 and that thinner platelet crystallites decompose preferentially. The decomposition of individual Li2O2 grains, by operando nanobeam synchrotron XRD, showed a slow concurrent Li2O2 decomposition via the more reactive (001) facets.31 More operando XRD studies have explored the time-dependent formation and decomposition of Li2O2 crystallites by comparing the changes in the Li2O2 peak area and the full width at half-maximum (fwhm), revealing the character of the Li2O2 crystallites during (dis)charge.32,33 However, no detailed insight exists for the formation of the Li2O2 crystallites during discharge. Moreover, little is known about the operando formation and decomposition of LiOH presently under debate25−27 and how the presence of the LiI redox mediator and water affects the structure of the formed species.
In this work, operando XRD is used to reveal the detailed structural evolution during a complete (dis)charge cycle of Li2O2 and LiOH in DME and DME/LiI electrolytes, respectively. Detailed Rietveld refinement of crystalline Li2O2 and LiOH formation and decomposition yields a model for the growth and decomposition process, providing novel insights into these relevant battery systems.
Materials and Methods
Cathode Preparation
The cathodes were prepared by coating a slurry of activated carbon (Kuraray Chemicals) and a lithiated Nafion binder on carbon paper (Spectracarb). The activated carbon was mixed with a Nafion binder [∼5% in a mixture of lower aliphatic alcohols and water (Aldrich)] with a mass ratio of ∼60:40 in a milling bowl, and subsequently, an amount of N-methyl-2-pyrrolidone (NMP) (Sigma-Aldrich, anhydrous, 99.5%) was added to adjust the viscosity of the slurry. The mixture was milled for 2 h at 100 rpm. The slurry was coated on a sheet of carbon paper, and the coated activated carbon sheets were dried at 100 °C for 24 h in a vacuum oven to remove surface-adsorbed water, after which Ø12.7 mm disks were punched out. The final carbon loading on the carbon paper was determined to be 3.0–4.0 mg.
Electrolytes
Two different electrolyte solutions were used, each consisting of a DME (Sigma-Aldrich, >99.5%) solvent that was further dried for several days over freshly activated molecular sieves (type 4 Å) (Sigma-Aldrich) and lithium bis(trifluoromethanesulfonyl)imide salt (LiTFSI, 99.95%, Aldrich), dried in a vacuum oven at 80 °C for 24 h. One electrolyte consisted of a solution of 0.5 M LiTFSI dissolved in DME, while the other consisted of a solution of 0.05 M LiI and 0.5 M LiTFSI dissolved in DME. These electrolytes will be termed the DME and DME/LiI electrolytes, respectively. All the electrolyte preparations were performed in an argon-filled glovebox (H2O and O2 content of <1 ppm). On the basis of the liquid chromatogram test, there is still a large amount of water (∼4000 ppm) in the electrolyte during the battery test.
Operando XRD Cell
A Li–O2 battery designed and constructed in house was used for the operando X-ray diffraction measurements as described in detail elsewhere.29
Electrochemistry
The Li–O2 battery, comprising the cathode, a glass microfiber separator (Whatman) soaked with the electrolyte, and a lithium metal anode, was assembled in the operando XRD battery in an argon-filled glovebox. The battery was subsequently connected to O2 (Linde, 99.9999%) under a pressure of 0.5 bar where it was allowed to equilibrate for 3 h before it was tested. Electrochemical cycling tests were performed with a MACCOR 4000 battery cycler.
X-ray Diffraction (XRD) Measurements
XRD measurements were taken using a PANalytical X’Pert Pro PW3040/60 diffractometer with Cu Kα radiation operating at 45 kV and 40 mA in a 2θ range of 31–65°. Scans (each ∼30 min in duration) were recorded for the batteries during a complete (dis)charge cycle with a current density of 0.3 mA/cm2. Refinement of the diffraction data was performed using the Rietveld method as implemented in the FullProf program. To more accurately fit the zero position (effectively positioned at a different height in the cathode) of the Li2O2 diffraction pattern, peaks arising from the current collector as well as carbon paper were excluded from the fits.
Scanning Electron Microscopy (SEM)
Electrodes were imaged at different stages of (dis)charge. Electrodes were rinsed with dry tetrahydrofuran (THF) prior to analysis, and samples were prepared in an argon-filled glovebox, using a stainless steel holder as the substrate and double-sided carbon tape as the contact point between the electrode and holder. Samples were transferred into the scanning electron microscope (JEOL JSM-6010LA) under anaerobic conditions, and images were taken using an accelerating voltage of 5 kV.
Results and Discussion
Electrochemical Properties and Discharge Product Morphology
Figure 1a depicts the (dis)charge curves obtained for the DME and DME/LiI electrolytes at a current density of 0.3 mA/cm2. For both electrolytes, a typical discharge plateau is observed around 2.7 V. The gradual decrease, resulting from an increasing overpotential, most likely reflects the increasing thickness of the insulating discharge products increasing the electrode’s resistance. For the DME and DME/LiI electrolytes, capacities of ∼2000 and ∼4000 mAh/g, respectively, can be obtained when discharging to the cutoff voltage of 2.2 V versus Li/Li+. During charging (OER), the voltage profile steadily increases toward a voltage plateau at 4.4 V for the DME electrolyte, whereas a continuously increasing voltage is observed for the DME/LiI electrolyte between 3.5 and 4.5 V, which has been attributed to the electrochemical oxidation of LiI.25
Figure 1.

(a) Galvanostatic (dis)charge profiles for the operando Li–O2 batteries with DME and DME/LiI electrolytes in a 2.2–4.5 V voltage window vs Li/Li+ at a current density of 0.3 mA/cm2. (b) XRD patterns of a pristine cathode and the cathodes at the end of discharge, with a 2.2 V cutoff voltage, in the DME and DME/LiI electrolytes, respectively. (c and d) SEM images for the cathodes measured after discharge in DME and DME/LiI electrolytes, respectively, at a current density of 0.3 mA/cm2.
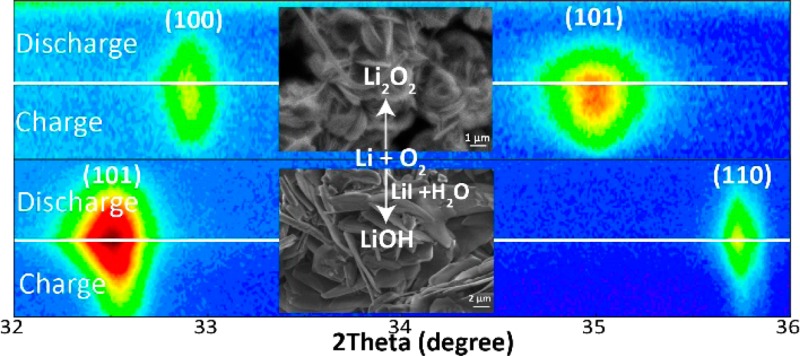
Ex situ XRD measurements were taken to identify the discharge products for the two different electrolytes. Figure 1b presents the XRD patterns of the cathodes discharged to a 2.2 V cutoff voltage at a current density of 0.3 mA/cm2 in the DME and DME/LiI electrolytes. Compared to the XRD pattern of the pristine electrode, new diffraction peaks appear at around 33°, 35°, 41°, 49°, and 59° for the cathode discharged in the DME electrolyte, which can be attributed to the crystalline Li2O2 phase. In the cathode discharged in the DME/LiI electrolyte, the diffraction peaks at 32.5°, 35.6°, 49°, 51.5°, 56°, and 62° can be indexed to crystalline LiOH, the formation of which is attributed to the presence of LiI and H2O in the electrolyte.
The morphology of the discharge products in the DME and DME/LiI electrolytes is shown in the SEM images in panels c and d of Figure 1. Figure 1c shows the two types of primary aggregates observed for Li2O2 in the DME electrolyte discharged down to 2.2 V. A fraction of the Li2O2 particles aggregate with several parallel plates, resulting in a loosely stacked layer-by-layer toroid-like structure, and others stack more tightly to assemble into toroids. In addition, many individual Li2O2 platelets are observed, distributed throughout the remaining space on the carbon cathode surface. The diameter of the platelet layers, stacked in toroids, is ∼2.0 μm, and the thickness is between 0.5 and 0.8 μm. Prior reports have described Li2O2 toroids as consisting of stacked platelets with a range of shapes and sizes in ether electrolytes.34−39 Experimental studies performed at different current densities in a DME electrolyte by Aetukuri et al.35 suggested that this was due to varying levels of water contamination in the cells and different discharge currents. Griffith et al.36 described a particle growth mechanism in which nucleation progresses via a ring-shaped primary structure, rather than via a linear or hemispherical primary structure. In our work, the trace water left in the DME electrolyte and in the O2 supplemental system may be responsible for the formation of toroidal Li2O2. Recently, a number of studies have explored the formation of toroidal Li2O2;34−37,40,41 however, there appears to be no clear consensus about the crystallite growth and aggregation mechanism.
Figure 1d shows the discharge product morphology of the cathode discharged in the DME/LiI electrolyte representing thick LiOH plates. The length of the LiOH plates reaches up to tens of micrometers, and the thickness is in the range of 100–200 nm. These LiOH plates, forming on the activated carbon surface, are distinctly different from the glassy film LiOH morphology42 on the carbon electrode during the ORR process and from the “flowerlike” agglomerated LiOH particles25 formed on the reduced graphene oxide cathode in Li–O2 batteries.
Operando XRD of Li2O2 Formation and Decomposition in the DME Electrolyte
Operando XRD patterns were collected for the DME electrolyte during a complete (dis)charge cycle at a current density of 0.3 mA/cm2. The two-dimensional contour XRD plot in the 2θ regions of 32.4–33.4°, 34.5–35.5°, and 58.2–59.2° in Figure 2 shows the evolution of the Li2O2 {100}, {101}, and {110} reflections demonstrating the gradual formation and decomposition of Li2O2. The {101} reflection is significantly broader than the {100} reflection, indicating anisotropic broadening of the Li2O2 reflections in the {00l} crystal plane direction. Although it is not possible to distinguish between size and strain broadening, given the limited range of the 2θ data, we assume the broadening to be a consequence of size broadening because electrochemically formed Li2O2 is known to form toroidal aggregates37 consisting of stacked Li2O2 crystalline platelets, with the plate normal in the {00l} direction.
Figure 2.
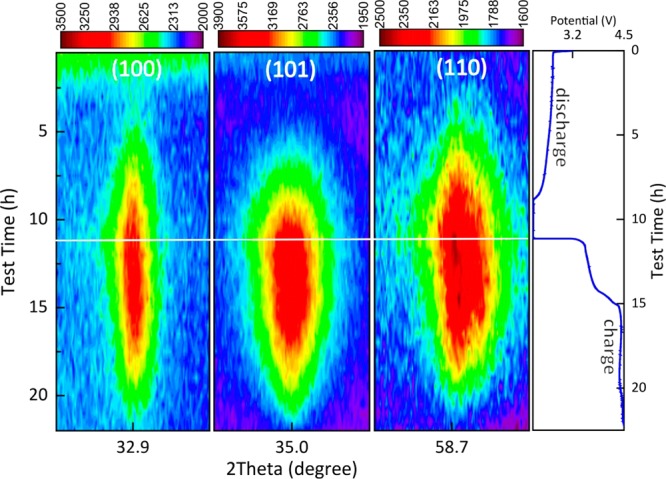
Two-dimensional contour plots (left) of the operando XRD patterns showing the 2θ region between 32.4° and 33.4°, 34.5° and 35.5°, and 58.2° and 59.2° during a complete (dis)charge cycle demonstrating Li2O2 formation (by the {100}, {101}, and {110} Li2O2 indexed reflections) and decomposition in the Li–O2 battery. (Dis)charge profile (right) of the electrochemical performance of the Li–O2 battery. The Li–O2 battery was tested by using the DME-based electrolyte at a current density of 0.3 mA/cm2.
The integrated and normalized areas as a function of discharge time for the {100} and {101} reflections of Li2O2 (Figure S2) show a linear increase in the peak area during discharge. However, during charging, it decreases via two different stages, as reported previously.29 During the initial stage of charging, the integrated area decays very slowly, indicating preferential oxidation of the surface species (LiO2* and O2–*) and/or an amorphous lithium component at the lower voltages (2.8–3.4 V),32 the latter possibly comprising an amorphous Li2O2 species, or both amorphous Li2O2 and side products arising from electrolyte degradation such as formate, that can be oxidized at relatively low potentials without a catalyst.43 In the second stage, the integrated Li2O2 peak areas decrease linearly, indicating the oxidation of the crystalline fraction of Li2O2.
Assuming that the observed anisotropic broadening of the XRD reflections is solely due to the crystallite size, the XRD patterns were refined with the FullProf program using a Thompson–Cox–Hastings pseudo-Voigt profile function based on spherical harmonics (SPH) to fit the anisotropic size broadening.44 The broadening of each reflection translates in an apparent crystallite size in the direction perpendicular to the planes specified by the Miller indices, shown for a number of reflections in Figure S3. The large apparent size in the {100} direction, coincident with the a lattice parameter, compared to the {004} reflection, coincident with the c lattice parameter, is in agreement with the reported platelet-shaped Li2O2 crystallites.37 When the crystallites are assumed to be platelets, cylinders with a large D/T (diameter/thickness) aspect ratio, the average apparent size of the Li2O2 plates in the {00l} direction represents the thickness of the plates, and the average apparent size in the {hk0} direction, multiplied by 3π/8, represents the average diameter of the cylinders.45 The evolution of the aspect ratio during the complete (dis)charge cycle is shown in Figure 3b. Finally, by taking into account the size broadening of all observed reflections, we can determine a detailed crystallite shape, images of which are shown in Figure 3a at different stages during the complete (dis)charge cycle.
Figure 3.

(a) Evolution of the Li2O2 crystallite shape. (b) Aspect ratio of the Li2O2 crystallite shape (diameter in the a–b plane/thickness in the c direction). (c) Li2O2 lattice parameters, resulting from Rietveld refinement during the full galvanostatic (dis)charge cycle in the DME electrolyte. In each panel, the blue line represents the voltage curve during the (dis)charge cycle at a current density of 0.3 mA/cm2.
During the discharge process, the D/T aspect ratio, shown in Figure 3b, decreases drastically, indicating that on average the platelets become more isotropic in shape. During charging, the aspect ratio increases slightly, whereas at the end of charging, it decreases again. The evolution of the average crystallite shape, shown in Figure 3a, demonstrates that the decrease in the D/T aspect ratio during discharge is caused by both an increase in average crystallite thickness and a decrease in average diameter. It should be realized that the crystallite dimensions, derived from the broadening of the XRD reflections, represent average values. Therefore, the observed decrease in platelet width during discharge most likely does not indicate that the crystallite diameter decreases during Li2O2 formation. It suggests that during discharge the Li2O2 platelets that form progressively are more isotropically shaped, having a smaller diameter, thereby decreasing the average diameter. Similarly, the increasing platelet thickness and diameter during charging, during decomposition of the Li2O2 crystallites, imply that thin and small platelets are decomposed first during charging, consistent with previous work.29
The evolution of the Li2O2 lattice parameters during the full (dis)charge cycle is shown in Figure 3c. The a lattice parameter is practically constant during Li2O2 formation and decomposition, whereas the c lattice parameter is 7.659 ± 0.020 Å at the beginning of discharge and then decreases to 7.634 ± 0.002 Å near the end of the discharge process. Because Li2O2 platelets with a thickness on the order of nanometers show an expansion in the average c lattice parameter due to surface relaxation,29,45 the decreasing c lattice parameter during discharge is consistent with the progressive formation of thicker, more isotropic platelets, consistent with the evolution of the crystallite shape in panels a and b of Figure 3. During charging, the c lattice parameter is initially constant at 7.643 ± 0.002 Å before it increases slightly to 7.651 ± 0.063 Å toward the end of charging. As suggested previously, the increase in c lattice parameters during charging may be caused by the decomposition of Li2O2 taking place via substoichiometric Li2–xO2 intermediates.29
Previously, detailed Rietveld refinement of operando XRD data performed during charging revealed the decomposition mechanism.29 At present, the formation of Li2O2 during discharge is additionally studied by operando XRD. Moreover, the better signal-to-noise ratio and better time resolution obtained allow a more detailed refinement of the anisotropic broadening of the XRD reflections during a full discharge–charge cycle, giving insight into the evolution of the crystallite shape. On the basis of the evolution of the apparent crystallite shape of Li2O2 and the aspect ratio D/T, the Li2O2 crystallites follow a distinct formation and decomposition mechanism. As is well-known, the toroidal Li2O2 particles consist of arrays of plateletlike Li2O2 crystallites.37 During discharge, the thinner Li2O2 crystallites, having a more anisotropic shape, form at the initial stages, whereas progressive discharging results in more isotropically shaped Li2O2 crystallites. Concurrently, several Li2O2 crystallites aggregate to form toroidal Li2O2 particles.42 In the meantime, small Li2O2 crystallites with a less anisotropic shape are also formed. During charging, the relatively thin Li2O2 anisotropic crystallites are oxidized first, followed by the thicker and more isotropic Li2O2 crystallites.
Operando XRD of LiOH Formation and Decomposition in the DME/LiI Electrolyte
Figure 4 presents the two-dimensional contour plots of the operando XRD patterns in the 2θ regions of 31.5–33.5°, 34.8–36.8°, 50.5–52.5°, 54.9–56.9°, and 61.2–63.2°, collected for the DME/LiI electrolyte during a complete (dis)charge cycle at a current density of 0.3 mA/cm2. The evolution of the {101}, {110}, {200}, {112}, and {211} reflections demonstrates the formation and decomposition of LiOH crystallites during discharge and charge, respectively, also supported by the linear increase (discharge) and decrease (charge) in the integrated area of the LiOH {101}, {110}, and {200} reflections shown in Figure S5.
Figure 4.

Two-dimensional contour plots (left) of the operando XRD patterns showing the 2θ regions between 31.5° and 33.5°, 34.8° and 36.8°, 50.5° and 52.5°, 54.9° and 56.9°, and 61.2° and 63.2°, during a complete (dis)charge cycle demonstrating LiOH formation ({101}, {110}, {200}, {112}, and {211} reflections) and decomposition. (Dis)charge profile (right) of the electrochemical performance of the Li–O2 battery. The Li–O2 battery was tested by using the DME/LiI electrolyte at a current density of 0.3 mA/cm2.
The XRD reflections from the crystalline LiOH show considerable anisotropic broadening as clearly observed in Figure 4, where the {101} reflection appears to be much broader than the {110} and {200} reflections. Analysis of the anisotropic broadening using FullProf as described in the previous section results in platelet-shaped LiOH crystallites with the platelet normal aligned with the c lattice parameter, very similar to the Li2O2 crystallites. SEM images of LiOH (Figure 1d) show large grains, suggesting layered stacks of thin crystalline LiOH plates.
The evolution of the crystallite shape during the complete (dis)charge cycle is shown Figure 5a, and the evolution of the resulting D/T (diameter/thickness) aspect ratio is shown in Figure 5b. Consistent with the constant width of the XRD reflections during discharge, the aspect ratio and crystallite shape remain constant during discharge. This indicates that the average crystallite shape and size do not evolve during discharge, indicating continuous nucleation and growth of LiOH crystallites with a constant crystallite size distribution. This suggests a particle-by-particle nucleation and growth process, rather than concurrent growth of LiOH crystallites, where the latter would lead to an increase in average crystallite size. In contrast, Figure 5a shows that during charging the average crystallite dimensions increase significantly (see also Figure S6). Therefore, crystallite size evolution is highly asymmetric with respect to charge and discharge, indicating at a very different growth and decomposition mechanism. Because LiOH decomposition should reduce the crystallite size, and with the realization that the XRD results represent average crystallite sizes, this may be explained by preferential decomposition of the smallest LiOH crystallites that will increase the average crystallite size.
Figure 5.

(a) Evolution of LiOH crystallite shape. (b) Aspect ratio of the LiOH crystallite shape (diameter in the a–b plane/thickness in the c direction). (c) LiOH lattice parameters, resulting from Rietveld refinement during the full galvanostatic (dis)charge cycle in the DME/LiI electrolyte. In each figure, the blue line represents the voltage curve during the full galvanostatic (dis)charge cycle in the DME/LiI electrolyte at a current density of 0.3 mA/cm2.
The evolution of the LiOH lattice parameters during discharge and charge is shown in Figure 5c. The a lattice parameter remains practically constant during the complete discharge–charge cycle. In contrast, the c parameter increases near the end of discharge and decreases at the early stages of charging, after which it remains relatively stable until the end of charging. The crystallite size in the c direction, parallel to the platelet normal, is on average approximately 20 nm during charge and discharge. For nanostructured metal oxides, crystallite dimensions in the nanorange typically result in expansion of the lattice parameters, attributed to an increase in the surface energy due to larger exposed surfaces. As a consequence, the c lattice parameter in the vicinity of the surface typically expands.45,46 Because the average crystallite size does not change significantly during discharge, the increase in the c lattice parameter must have an origin different from that of the crystallite size. One possibility is the presence of Li+ or OH– vacancies, where the latter appears to be more relevant as the effect of OH– vacancies has been studied in Mg(OH)2 and LiOH.47,48 In a LiOH crystal, the Li+ ions are located around the apexes of a square that slightly fold downward along a diagonal under the O atom of the OH– ion.49 It is therefore likely that the presence of vacancies will affect the lattice parameters anisotropically. To investigate the dependence of the lattice parameters on the presence of vacancies, DFT calculations were performed on a 2 × 2 × 2 supercell of LiOH by removing one hydrogen atom, lithium atom, and OH ion from the supercell, resulting in H, Li, and OH vacancies, respectively (Figure S7). Relaxation of the supercell with a single hydrogen vacancy in the OH layer results in an increase of the a lattice parameter and a decrease in the c lattice parameter (Table S1). Upon relaxation of the supercell with either a Li or a OH vacancy, both structures show an increase in the c lattice parameter [Li, ∼1.12%; OH, ∼2.60% (Table S1)]. However, the supercell shows a decrease in the a lattice parameter (∼0.79%) for a Li vacancy and an increase (∼1.05%) for a OH vacancy. Moreover, according to the DFT calculations,50,51 the formation energies of Li, H, and OH– vacancies are −1.399, −0.317, and −1.578 eV, respectively, suggesting that the OH– vacancies are relatively stable in LiOH (Theoretical Calculation and Table S1). Hence, the observed increase in the LiOH c lattice parameter and the slight increase in the a lattice parameter at the end of discharge seen in Figure 5c may be a consequence of the formation of OH vacancies in the LiOH lattice. This may be rationalized as follows; during the initial stages of discharge, H2O will be relatively abundant, resulting in the formation of LiOH crystallites with a small number of OH vacancies. At the later stage of discharge, most of the H2O can be anticipated to be consumed, most likely the origin of the formation of OH substoichiometric Li(OH)1–x crystallites, explaining the observed increase in the c lattice parameter. During the initial stages of charging, the c lattice parameter decreases, suggesting that the OH vacancy rich Li(OH)1–x material is preferentially decomposed.
To investigate the cyclic formation of LiOH over multiple cycles, operando XRD was performed for the battery based on the DME/LiI electrolyte during three (dis)charge cycles, restricted to a capacity of 1.5 mAh at a current density of 0.3 mA/cm2. The electrochemical curves for three cycles are shown in Figure 6a, and the two-dimensional contour plots of the operando XRD patterns in Figure 6b demonstrate the cyclic formation and decomposition of LiOH crystallites during three discharge–charge cycles. This gives direct evidence that LiOH is a cyclic discharge product in the presence of a LiI mediator over multiple cycles. Additionally, the linear increase (discharge) and decrease (charge) in the integrated area of the LiOH {101} and {110} reflections over three cycles as shown in Figure S8 also support the formation and decomposition of crystalline LiOH during (dis)charge.
Figure 6.

(a) Galvanostatic (dis)charge profiles. (b) Two-dimensional contour plots of the operando XRD patterns showing the 2θ region between 31.5° and 33.5° and between 34.8° and 36.8°, during three complete discharge–charge cycles demonstrating LiOH formation ({101} and {110} reflections) and decomposition using the DME/LiI electrolyte employing a capacity-restricted cycling capacity of 1.5 mAh at a current density of 0.3 mA/cm2.
To explore the influence of H2O on the formation of LiOH, the Li–O2 battery, combining an activated carbon electrode and the DME/LiI electrolyte, was (dis)charged while the cathode was being exposed to H2O-saturated O2. The (dis)charge curve obtained is shown in Figure S9, where it is compared to that obtained for the same system exposed to dry O2 (results shown in Figure 5). Because of the presence of H2O in the provided O2 gas, the discharge overpotential for the H2O-saturated O2 battery is lower than that of its dry O2 counterpart. Conversely, the charge overpotential for the H2O-saturated O2 battery is larger, possibly because of the higher discharge capacity and associated increased resistance of the insulating LiOH crystallites and/or blocking of the gas diffusion electrode. The resulting operando XRD contour plots and the results from the Rietveld refinement of the LiOH structure are shown in Figures S10 and S11, respectively. The evolution of the LiOH reflections in the presence of H2O-saturated O2 is similar to that observed for the dry O2 shown in Figure 4, indicating the formation and decomposition of crystalline LiOH. The main difference caused by the presence of H2O-saturated O2 is that the intensities of the LiOH reflections are larger and that the {101} reflection becomes sharper. These results indicate that larger LiOH crystallites are generated during the discharge process because of the presence of H2O-saturated O2. Both the apparent crystallite size and the lattice parameters evolve in a manner similar to that observed for dry O2, also indicating that small LiOH crystallites are decomposed first during the charging process.
In summary, from the detailed refinement of the cyclic appearance of the XRD LiOH reflections in the DME/LiI electrolyte, a formation and decomposition mechanism is shown in Figure 7a. On the basis of the evolution of the apparent crystallite shape and the D/T aspect ratio of LiOH, the LiOH crystallites follow a continuous nucleation and growth mechanism with a constant crystallite size distribution during discharge. This mechanism represents a particle-by-particle rather than concurrent nucleation and growth process, forming the platelike LiOH particles (Figure 7b, images A–C). On the basis of the simulation of defects, we expect that the low concentration of water in the electrolyte induces OH substoichiometric LiOH, explaining the observed increase in the c lattice parameter. During charging, the average LiOH crystallite dimensions increase significantly, whereas the aspect ratio and crystallite shape remain constant, suggesting that the smallest OH deficient LiOH crystallites oxidize first (Figure 7b, images D–F). This indicates that the crystallite size and presence of vacancies are important parameters to consider when aiming to increase the charge rate and to decrease the charge overpotential.
Figure 7.

(a) Voltage profile, including a schematic illustration of the formation and decomposition mechanism of the LiOH platelet-shaped crystallites during the discharge–charge process, as determined from refinement of the operando XRD patterns. (b) SEM images recorded at different capacity stages of LiOH formation and decomposition.
Conclusions
Operando X-ray diffraction is performed to investigate the structure evolution of Li2O2 and LiOH during discharging and charging in the Li–O2 battery employing a DME or DME/LiI electrolyte in combination with an activated carbon cathode. In the DME electrolyte, Li2O2 forms and decomposes reversibly as platelet crystallites with the normal of the platelet in the c lattice parameter direction. During discharge, the average Li2O2 crystallite shape becomes more isotropic because of the formation of more isotropic crystallites. The decomposition of Li2O2 crystallites during charging takes place in two distinct stages. First, amorphous species and small Li2O2 crystallites are oxidized, and second, the larger crystallites are decomposed. In the DME/LiI electrolyte, LiI appears to act as a redox mediator resulting in the cyclic formation of crystalline LiOH over multiple cycles. During discharge, platelet LiOH crystallites form, with the normal of the platelet in the c lattice parameter direction. As the average crystallite size and shape do not evolve during discharge, this indicates continuous, particle-by-particle nucleation and growth. The increase in the average c lattice parameter is, on the basis of DFT calculations, proposed to be a result of the formation of OH vacancies in LiOH, suggested to be a consequence of the depletion of water in the DME electrolyte during LiOH formation. During decomposition during charging, the smallest OH deficient LiOH crystallites decompose first, indicating that the decomposition of these particles is most facile. Providing H2O-saturated O2 does not change the crystallite growth mechanism significantly; however, the amount of crystalline LiOH increases, consistent with the larger electrochemical discharge capacity.
Acknowledgments
The authors thank Kees Goubitz, Michel Steenvoorden, and Frans Ooms for their assistance with experiments. We gratefully acknowledge financial support from the China Scholarship Council (CSC). The research leading to these results has received funding from the European Research Council under the European Union’s Seventh Framework Program (FP/2007-2013)/ERC Grant Agreement 307161 of M.W.
Supporting Information Available
The Supporting Information is available free of charge on the ACS Publications website at DOI: 10.1021/acs.chemmater.6b04370.
Fitting procedure microstructural parameters, methodology DFT calculations, evolution of the integrated XRD peak area, evolution of the average crystallite sizes, galvanostatic (dis)charge profiles during the operando XRD experiments, operando XRD patterns, and lattice parameters resulting from DFT calculations (PDF)
The authors declare no competing financial interest.
Supplementary Material
References
- Abraham K. M.; Jiang Z. A Polymer Electrolyte-Based Rechargeable Lithium/Oxygen Battery. J. Electrochem. Soc. 1996, 143, 1–5. 10.1149/1.1836378. [DOI] [Google Scholar]
- Bruce P. G.; Freunberger S. A.; Hardwick L. J.; Tarascon J. M. Li-O2 and Li-S Batteries with High Energy Storage. Nat. Mater. 2012, 11, 19–29. 10.1038/nmat3191. [DOI] [PubMed] [Google Scholar]
- Peng Z.; Freunberger S. A.; Chen Y.; Bruce P. G. A Reversible and Higher-Rate Li-O2 Battery. Science 2012, 337, 563–566. 10.1126/science.1223985. [DOI] [PubMed] [Google Scholar]
- Ottakam Thotiyl M. M.; Freunberger S. A.; Peng Z.; Chen Y.; Liu Z.; Bruce P. G. A Stable Cathode for the Aprotic Li-O2 Battery. Nat. Mater. 2013, 12, 1050–1056. 10.1038/nmat3737. [DOI] [PubMed] [Google Scholar]
- Freunberger S. A.; Chen Y.; Peng Z.; Griffin J. M.; Hardwick L. J.; Barde F.; Novak P.; Bruce P. G. Reactions in the Rechargeable Lithium-O2 Battery with Alkyl Carbonate Electrolytes. J. Am. Chem. Soc. 2011, 133, 8040–7. 10.1021/ja2021747. [DOI] [PubMed] [Google Scholar]
- Ottakam Thotiyl M. M.; Freunberger S. A.; Peng Z.; Bruce P. G. The Carbon Electrode in Nonaqueous Li-O2 Cells. J. Am. Chem. Soc. 2013, 135, 494–500. 10.1021/ja310258x. [DOI] [PubMed] [Google Scholar]
- Johnson L.; Li C.; Liu Z.; Chen Y.; Freunberger S. A.; Ashok P. C.; Praveen B. B.; Dholakia K.; Tarascon J.-M.; Bruce P. G. The Role of LiO2 Solubility in O2 Reduction in Aprotic Solvents and Its Consequences For Li-O2 Batteries. Nat. Chem. 2014, 6, 1091–1099. 10.1038/nchem.2101. [DOI] [PubMed] [Google Scholar]
- Aetukuri N. B.; McCloskey B. D.; García J. M.; Krupp L. E.; Viswanathan V.; Luntz A. C. Solvating Additives Drive Solution-Mediated Electrochemistry and Enhance Toroid Growth in Non-Aqueous Li-O2 Batteries. Nat. Chem. 2015, 7, 50–56. 10.1038/nchem.2132. [DOI] [PubMed] [Google Scholar]
- McCloskey B. D.; Bethune D. S.; Shelby R. M.; Girishkumar G.; Luntz A. C. Solvents Critical Role in Nonaqueous Lithium-Oxygen Battery Electrochemistry. J. Phys. Chem. Lett. 2011, 2, 1161–1166. 10.1021/jz200352v. [DOI] [PubMed] [Google Scholar]
- McCloskey B. D.; Scheffler R.; Speidel A.; Girishkumar G.; Luntz A. C. On the Mechanism of Nonaqueous Li-O2 Electrochemistry on C and Its Kinetic Overpotentials: Some Implications for Li-Air Batteries. J. Phys. Chem. C 2012, 116, 23897–23905. 10.1021/jp306680f. [DOI] [Google Scholar]
- McCloskey B. D.; Speidel A.; Scheffler R.; Miller D. C.; Viswanathan V.; Hummelshøj J. S.; Nørskov J. K.; Luntz A. C. Twin Problems of Interfacial Carbonate Formation in Nonaqueous Li-O2 Batteries. J. Phys. Chem. Lett. 2012, 3, 997–1001. 10.1021/jz300243r. [DOI] [PubMed] [Google Scholar]
- Gowda S. R.; Brunet A.; Wallraff G. M.; McCloskey B. D. Implications of CO2 Contamination in Rechargeable Nonaqueous Li-O2 Batteries. J. Phys. Chem. Lett. 2013, 4, 276–279. 10.1021/jz301902h. [DOI] [PubMed] [Google Scholar]
- Adams B. D.; Black R.; Radtke C.; Williams Z.; Mehdi B. L.; Browning N. D.; Nazar L. F. The Importance of Nanometric Passivating Films on Cathodes for Li-Air Batteries. ACS Nano 2014, 8, 12483–12493. 10.1021/nn505337p. [DOI] [PubMed] [Google Scholar]
- Kundu D.; Black R.; Berg E. J.; Nazar L. F. A Highly Active Nanostructured Metallic Oxide Cathode for Aprotic Li-O2 Batteries. Energy Environ. Sci. 2015, 8, 1292–1298. 10.1039/C4EE02587C. [DOI] [Google Scholar]
- Lu J.; Lei Y.; Lau K. C.; Luo X.; Du P.; Wen J.; Assary R. S.; Das U.; Miller D. J.; Elam J. W.; Albishri H. M.; El-Hady D. A.; Sun Y.-K.; Curtiss L. A.; Amine K. A Nanostructured Cathode Architecture for Low Charge Overpotential in Lithium-Oxygen Batteries. Nat. Commun. 2013, 4, 2383. 10.1038/ncomms3383. [DOI] [PubMed] [Google Scholar]
- Feng N.; He P.; Zhou H. Critical Challenges in Rechargeable Aprotic Li–O2 Batteries. Adv. Energy Mater. 2016, 6, 1502303. 10.1002/aenm.201502303. [DOI] [Google Scholar]
- McCloskey B. D.; Speidel A.; Scheffler R.; Miller D. C.; Viswanathan V.; Hummelshøj J. S.; Nørskov J. K.; Luntz A. C. Twin Problems of Interfacial Carbonate Formation in Nonaqueous Li-O2 Batteries. J. Phys. Chem. Lett. 2012, 3, 997–1001. 10.1021/jz300243r. [DOI] [PubMed] [Google Scholar]
- Itkis D. M.; Semenenko D. A.; Kataev E. Y.; Belova A. I.; Neudachina V. S.; Sirotina A. P.; Hävecker M.; Teschner D.; Knop-Gericke A.; Dudin P.; Barinov A.; Goodilin E. A.; Shao-Horn Y.; Yashina L. V. Reactivity of Carbon in Lithium–Oxygen Battery Positive Electrodes. Nano Lett. 2013, 13, 4697–4701. 10.1021/nl4021649. [DOI] [PubMed] [Google Scholar]
- Grande L.; Paillard E.; Hassoun J.; Park J. B.; Lee Y. J.; Sun Y. K.; Passerini S.; Scrosati B. The Lithium/Air Battery: Still an Emerging System or a Practical Reality?. Adv. Mater. 2015, 27, 784–800. 10.1002/adma.201403064. [DOI] [PubMed] [Google Scholar]
- Meini S.; Tsiouvaras N.; Schwenke K. U.; Piana M.; Beyer H.; Lange L.; Gasteiger H. A. Rechargeability of Li-Air Cathodes Pre-Filled with Discharge Products Using an Ether-Based Electrolyte Solution: Implications for Cycle-Life of Li-Air Cells. Phys. Chem. Chem. Phys. 2013, 15, 11478–11493. 10.1039/c3cp51112j. [DOI] [PubMed] [Google Scholar]
- Schwenke K. U.; Metzger M.; Restle T.; Piana M.; Gasteiger H. A. The Influence of Water and Protons on Li2O2 Crystal Growth in Aprotic Li-O2 Cells. J. Electrochem. Soc. 2015, 162, A573–A584. 10.1149/2.0201504jes. [DOI] [Google Scholar]
- Wu S.; Tang J.; Li F.; Liu X.; Zhou H. Low Charge Overpotentials in Lithium-Oxygen Batteries Based on Tetraglyme Electrolytes with a Limited Amount of Water. Chem. Commun. 2015, 51, 16860–16863. 10.1039/C5CC06370A. [DOI] [PubMed] [Google Scholar]
- Li F.; Wu S.; Li D.; Zhang T.; He P.; Yamada A.; Zhou H. The Water Catalysis at Oxygen Cathodes of Lithium-Oxygen Cells. Nat. Commun. 2015, 6, 7843. 10.1038/ncomms8843. [DOI] [PMC free article] [PubMed] [Google Scholar]
- Kwak W.-J.; Hirshberg D.; Sharon D.; Shin H.-J.; Afri M.; Park J.-B.; Garsuch A.; Chesneau F. F.; Frimer A. A.; Aurbach D.; Sun Y.-K. Understanding the Behavior of Li-Oxygen Cells Containing Lii. J. Mater. Chem. A 2015, 3, 8855–8864. 10.1039/C5TA01399B. [DOI] [Google Scholar]
- Liu T.; Leskes M.; Yu W.; Moore A. J.; Zhou L.; Bayley P. M.; Kim G.; Grey C. P. Cycling Li-O2 Batteries via LiOH Formation and Decomposition. Science 2015, 350, 530–533. 10.1126/science.aac7730. [DOI] [PubMed] [Google Scholar]
- Viswanathan V.; Pande V.; Abraham K. M.; Luntz A. C.; McCloskey B. D.; Addison D. Comment on “Cycling Li-O2 Batteries via LiOH Formation and Decomposition”. Science 2016, 352, 667–667. 10.1126/science.aad8689. [DOI] [PubMed] [Google Scholar]
- Shen Y.; Zhang W.; Chou S.-L.; Dou S.-X. Comment on “Cycling Li-O2 Batteries via LiOH Formation and Decomposition”. Science 2016, 352, 667–667. 10.1126/science.aaf1399. [DOI] [PubMed] [Google Scholar]
- Burke C. M.; Black R.; Kochetkov I. R.; Giordani V.; Addison D.; Nazar L. F.; McCloskey B. D. Implications of 4 e– Oxygen Reduction via Iodide Redox Mediation in Li–O2 Batteries. ACS Energy Lett. 2016, 1, 747–756. 10.1021/acsenergylett.6b00328. [DOI] [Google Scholar]
- Ganapathy S.; Adams B. D.; Stenou G.; Anastasaki M. S.; Goubitz K.; Miao X.-F.; Nazar L. F.; Wagemaker M. Nature of Li2O2 Oxidation in a Li–O2 Battery Revealed by Operando X-ray Diffraction. J. Am. Chem. Soc. 2014, 136, 16335–16344. 10.1021/ja508794r. [DOI] [PubMed] [Google Scholar]
- Kang S.; Mo Y.; Ong S. P.; Ceder G. A Facile Mechanism for Recharging Li2O2 In Li-O2 Batteries. Chem. Mater. 2013, 25, 3328–3336. 10.1021/cm401720n. [DOI] [Google Scholar]
- Ganapathy S.; Heringa J. R.; Anastasaki M. S.; Adams B. D.; van Hulzen M.; Basak S.; Li Z.; Wright J. P.; Nazar L. F.; van Dijk N. H.; Wagemaker M. Operando Nanobeam Diffraction to Follow the Decomposition of Individual Li2O2 Grains in a Nonaqueous Li-O2 Battery. J. Phys. Chem. Lett. 2016, 7, 3388–3394. 10.1021/acs.jpclett.6b01368. [DOI] [PubMed] [Google Scholar]
- Lim H.; Yilmaz E.; Byon H. R. Real-Time XRD Studies of Li–O2 Electrochemical Reaction in Nonaqueous Lithium–Oxygen Battery. J. Phys. Chem. Lett. 2012, 3, 3210–3215. 10.1021/jz301453t. [DOI] [PubMed] [Google Scholar]
- Storm M. M.; Johnsen R. E.; Younesi R.; Norby P. Capillary Based Li-Air Batteries for in situ Synchrotron X-Ray Powder Diffraction Studies. J. Mater. Chem. A 2015, 3, 3113–3119. 10.1039/C4TA04291C. [DOI] [Google Scholar]
- Xia C.; Waletzko M.; Chen L.; Peppler K.; Klar P. J.; Janek J. Evolution of Li2O2 Growth and Its Effect on Kinetics of Li-O2 Batteries. ACS Appl. Mater. Interfaces 2014, 6, 12083–12092. 10.1021/am5010943. [DOI] [PubMed] [Google Scholar]
- Aetukuri N. B.; McCloskey B. D.; García J. M.; Krupp L. E.; Viswanathan V.; Luntz A. C. Solvating Additives Drive Solution-Mediated Electrochemistry and Enhance Toroid Growth in Non-Aqueous Li-O2 Batteries. Nat. Chem. 2015, 7, 50–56. 10.1038/nchem.2132. [DOI] [PubMed] [Google Scholar]
- Griffith L. D.; Sleightholme A. E. S.; Mansfield J. F.; Siegel D. J.; Monroe C. W. Correlating Li/O2 Cell Capacity and Product Morphology with Discharge Current. ACS Appl. Mater. Interfaces 2015, 7, 7670–7678. 10.1021/acsami.5b00574. [DOI] [PubMed] [Google Scholar]
- Mitchell R. R.; Gallant B. M.; Shao-Horn Y.; Thompson C. V. Mechanisms of Morphological Evolution of Li2O2 Particles during Electrochemical Growth. J. Phys. Chem. Lett. 2013, 4, 1060–1064. 10.1021/jz4003586. [DOI] [PubMed] [Google Scholar]
- Black R.; Lee J.-H.; Adams B.; Mims C. A.; Nazar L. F. The Role of Catalysts and Peroxide Oxidation in Lithium-Oxygen Batteries. Angew. Chem., Int. Ed. 2013, 52, 392–396. 10.1002/anie.201205354. [DOI] [PubMed] [Google Scholar]
- Adams B. D.; Radtke C.; Black R.; Trudeau M. L.; Zaghib K.; Nazar L. F. Current Density Dependence of Peroxide Formation in The Li-O2 Battery and Its Effect on Charge. Energy Environ. Sci. 2013, 6, 1772–1778. 10.1039/c3ee40697k. [DOI] [Google Scholar]
- Olivares-Marín M.; Sorrentino A.; Lee R.-C.; Pereiro E.; Wu N.-L.; Tonti D. Spatial Distributions of Discharged Products of Lithium–Oxygen Batteries Revealed by Synchrotron X-ray Transmission Microscopy. Nano Lett. 2015, 15, 6932–6938. 10.1021/acs.nanolett.5b02862. [DOI] [PubMed] [Google Scholar]
- Lau S.; Archer L. A. Nucleation and Growth of Lithium Peroxide in the Li–O2 Battery. Nano Lett. 2015, 15, 5995–6002. 10.1021/acs.nanolett.5b02149. [DOI] [PubMed] [Google Scholar]
- Black R.; Oh S. H.; Lee J.-H.; Yim T.; Adams B.; Nazar L. F. Screening for Superoxide Reactivity in Li-O2 Batteries: Effect on Li2O2/LiOH Crystallization. J. Am. Chem. Soc. 2012, 134, 2902–2905. 10.1021/ja2111543. [DOI] [PubMed] [Google Scholar]
- Oh S. H.; Adams B. D.; Lee B.; Nazar L. F. Direct, Soft Chemical Route to Mesoporous Metallic Lead Ruthenium Pyrochlore and Investigation of its Electrochemical Properties. Chem. Mater. 2015, 27, 2322–2331. 10.1021/cm5034904. [DOI] [Google Scholar]
- Rodríguez-Carvajal J.Study of Microstructural Effects by Powder Diffraction using the Program FULLPROF; Laboratorie Léon Brillouin (CEA-CNRS): Gif-sur-Yvette, France, 2003 [Google Scholar]
- Casas-Cabanas M.; Rodriguez-Carvajal J.; Canales-Vazquez J.; Palacin M. R. New Insights on the Microstructural Characterisation of Nickel Hydroxides and Correlation with Electrochemical Properties. J. Mater. Chem. 2006, 16, 2925–2939. 10.1039/B602491B. [DOI] [Google Scholar]
- Leoni M. Grain Surface Relaxation and Grain Interaction in Powder Diffraction. Mater. Sci. Forum 2004, 443–444, 1–10. 10.4028/www.scientific.net/MSF.443-444.1. [DOI] [Google Scholar]
- Vaiss V. S.; Borges I. Jr; Wypych F.; Leitão A. A. Formation Reaction Mechanisms of Hydroxide Anions From Mg(OH)2 Layers. Chem. Phys. 2013, 418, 1–7. 10.1016/j.chemphys.2013.03.014. [DOI] [Google Scholar]
- Tanigawa H.; Tanaka S. Quantum Chemical Calculation of O-H Vibration in LiOH Ab-initio Analysis of Hydrogen Isotopes in Ceramic Breeder Materials. J. Nucl. Sci. Technol. 2001, 38, 1004–1006. 10.1080/18811248.2001.9715129. [DOI] [Google Scholar]
- Okazaki S.; Ohtori N.; Okada I. Molecular Dynamics Studies on Molten Alkali Hydroxides. I. Static Properties of Molten LiOH. J. Chem. Phys. 1990, 92, 7505–7514. 10.1063/1.458186. [DOI] [Google Scholar]
- Mérawa M.; Labeguerie P.; Ugliengo P.; Doll K.; Dovesi R. The Structural, Electronic and Vibrational Properties of LiOH and NaOH: An ab initio Study. Chem. Phys. Lett. 2004, 387, 453–459. 10.1016/j.cplett.2004.01.123. [DOI] [Google Scholar]
- Varley J. B.; Viswanathan V.; Nϕrskov J. K.; Luntz A. C. Lithium and Oxygen Vacancies and Their Role in Li2O2 Charge Transport in Li-O2 Batteries. Energy Environ. Sci. 2014, 7, 720–727. 10.1039/C3EE42446D. [DOI] [Google Scholar]
Associated Data
This section collects any data citations, data availability statements, or supplementary materials included in this article.