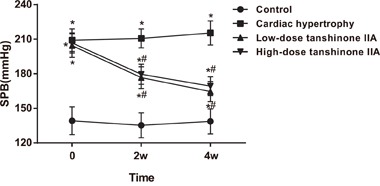
Figure 1. Comparison of SBP in the rats among the cardiac hypertrophy, low-dose tanshinone IIA, high-dose tanshinone IIA and control groups before the experiment, and at 2 and 4 weeks after the experiment.

Note: *, P < 0.05 compared with the control group; #, P < 0.05 compared with the cardiac hypertrophy group; SBP, systolic blood pressure.
