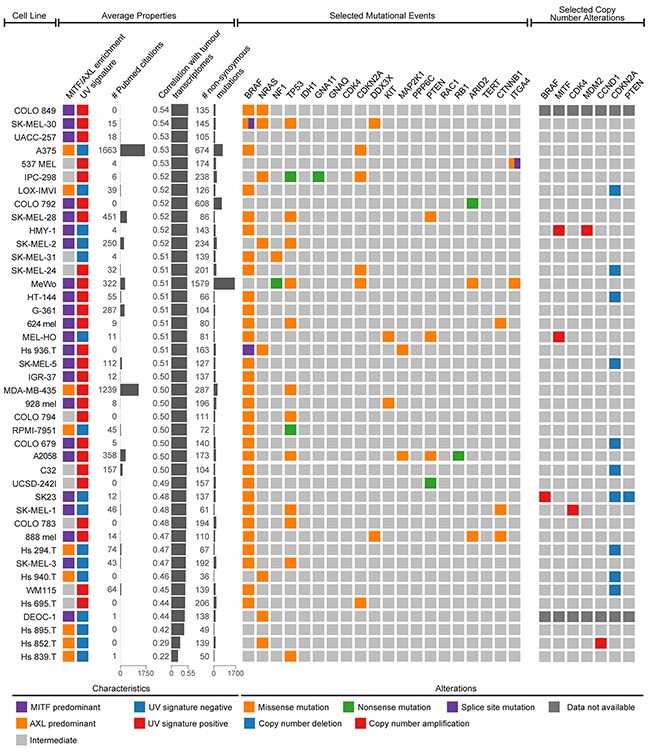
Figure 6. Genomic summary of melanoma cell lines.

Both average properties (left) and selected genetic events (right) can be used to choose the optimal cell model for specific occasions. Average properties include MITF/AXL/intermediate clustering, UV signature status, the citation frequency in the literature, the average transcriptional correlation with malignant melanoma cells, and the number of non-synonymous mutations. The selected genetic events include 20 possible somatic mutations (BRAF, NRAS, NF1, TP53, IDH1, GNA11, GNAQ, CDK4, CDKN2A, DDX3X, KIT, MAP2K1, PPP6C, PTEN, RAC1, RB1, ARID2, TERT, CTNNB1, and ITGA4) and 7 possible copy number alterations (BRAF, MITF, CDK4, MDM2, CCND1, CDKN2A, and PTEN) determined to be significantly altered in the landmark melanoma study by The Cancer Genome Atlas.
