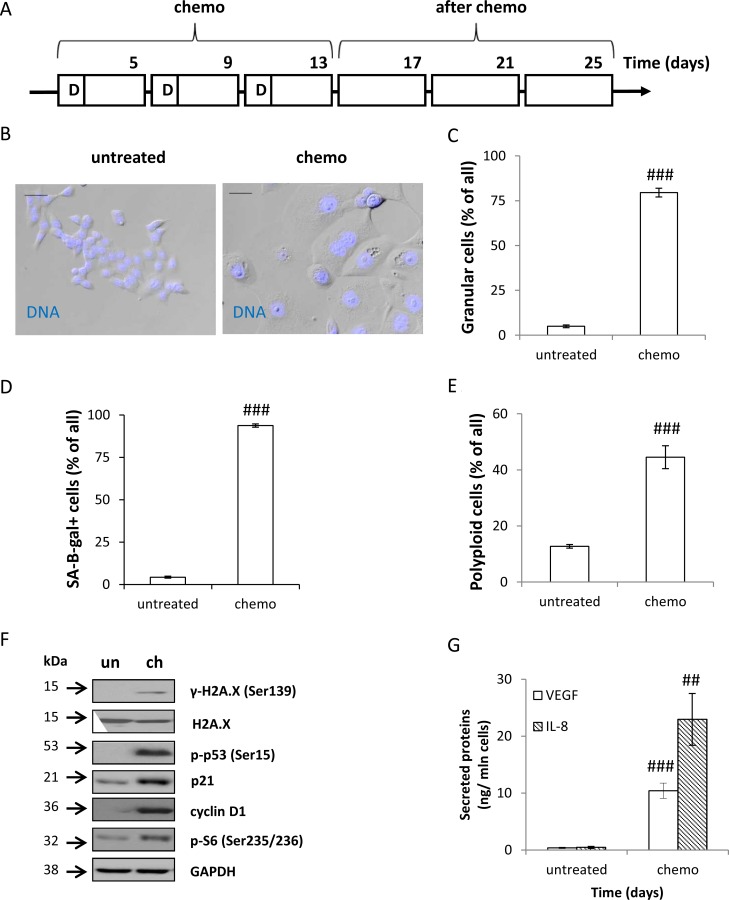
Figure 1. Colon cancer HCT116 cells treated with doxorubicin cycles show features of senescence.
(A) A scheme of the experiment. CHEMO protocol. Cells were subjected to three cycles of doxorubicin (D) as follows: cells were treated with 100 nM of doxorubicin for 24 hours, then the medium was removed and cells were cultured in a drug-free medium for the next 3 days. AFTER CHEMO protocol. After the 3rd doxorubicin cycle HCT116 cells were cultured in a drug-free medium for 14 days. Medium was changed every four days. Cells were examined for senescent markers on the 13th day (CHEMO). (B) Representative photos show morphological alterations in CHEMO-treated cells. Cell nuclei were stained with H33342 (blue). Original magnification 200×. Data were acquired with transmitted light and fluorescence microscopy. Scale bar–100 μm. (C) Percentages of granular cells as determined by FSC/SSC analysis using flow cytometry. (D) Quantification of SA-β-gal+ cells. Untreated or CHEMO-treated cells were cytospined and cytochemical staining for SA-β-gal activity was performed. (E) Percentages of polyploid cells. Cell cycle analysis was performed using PI staining and flow cytometry. (F) The expression of DDR and geroconversion proteins in untreated (un) or CHEMO-treated (ch) cells. Representative blots show levels of γ-H2A.X, H2A.X, p-p53, p21, cyclin D1 and p-S6 proteins. GAPDH was used as a loading control. (G) Secretion of VEGF and IL-8 in CHEMO-treated cultures. Cytokine levels were determined by colorimetric ELISA in supernatants harvested from untreated and treated cells. Results were normalized to total cell number counted in Bürker's chamber. Each bar represents mean ± SEM, n ≥ 3; #p < 0.05, ##p < 0.01, ###p < 0.001 -untreated vs. CHEMO.

