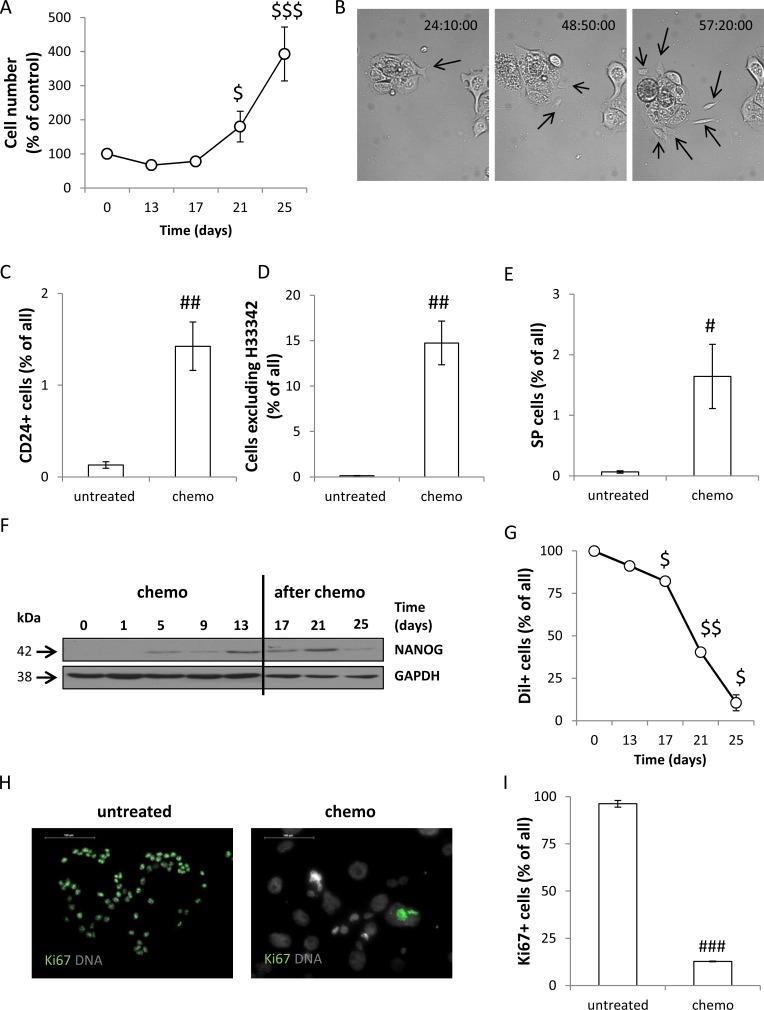
Figure 2. Senescent HCT116 cells exhibit certain features of cancer stem cells and re-populate in vitro culture after doxorubicin removal.
(A) Quantification of cell number at various time points of the AFTER CHEMO protocol. Cells were counted in Bürker's chamber. (B) Senescent cells produce progeny. HCT116 cells were seeded in 6-well plate and their behaviour was recorded starting from the 17th day of the AFTER CHEMO protocol. Representative photos were acquired by time-lapse imaging. Progeny originating from senescent, hypertrophic cells is indicated by black arrows. Original magnification 160×. (C) Evaluation of percentages of CD24+ cells on the 13th day (CHEMO). Cells were incubated with an anti-CD24-FITC antibody and percentages of positive cells were determined by flow cytometry. Cells labeled with an isotypic IgG were used as a negative control. (D) Quantification of H33342 excluding cells by flow cytometry. (E) Quantification of side population (SP) on the 13th day (CHEMO). Cells stained with H33342 were co-incubated with Verapamil and analyzed by flow cytometry. SP = a percentage of cells excluding H33342 in the absence of Verapamil minus a percentage of cells excluding H33342 when Verapamil is present. (F) Representative blot shows the expression of NANOG. GAPDH served as a loading control. (G) HCT116 cells persist in non-proliferating state during doxorubicin administration. Cells were stained with lipophilic, red-fluorescent dye Dil on the 1st day and the percentage of cells retaining Dil+ was determined with flow cytometry, at each time point. Unstained cells were used as a negative control. (H) Representative photos show Ki67 staining in untreated and treated cultures on the 13th day (CHEMO); immunofluorescence for Ki67-visualized as green (AlexaFluor 488), nuclei-as grey (H33342). Original magnification 400×. Data acquired by fluorescent confocal microscopy. (I) Automatic evaluation of a percentage of Ki67 positive cells. Each bar represents mean ± SEM, N ≥ 3; statistical significance #p < 0.05, ## p < 0.01, ###p < 0.001-untreated vs. CHEMO (day 13th); $p < 0.05, $$p < 0.01, $$$p < 0.001 – AFTER CHEMO vs. day 13th (CHEMO).

