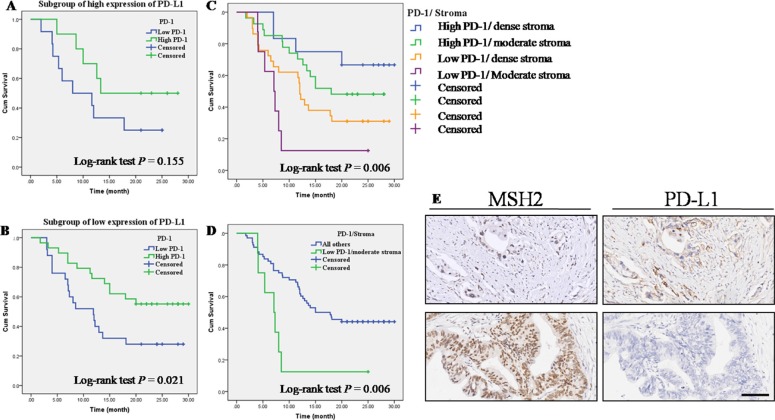
Figure 3. Correlations of MMR gene expression, stroma density and PD-1/PD-L1 expression in PC tissues.
(A) OS according to PD-1 expression in high PD-L1 expression subgroup. (B) OS according to PD-1 expression in low PD-L1 expression subgroup. (C) OS in four subgroups straitified by PD-1 expression and stroma density. (D) Low PD-1 expression and moderate stroma showed a worse outcome than the combination of other three group named “all others”. (E) Serial sections were used from the same PC tissue to depict an inverse correlation between MSH2 expression and PD-L1 expression. Top left and top right: low MSH2 expression vs. high PD-L1 expression; Lower left and lower right: high MSH2 expression vs. low PD-L1 expression.

