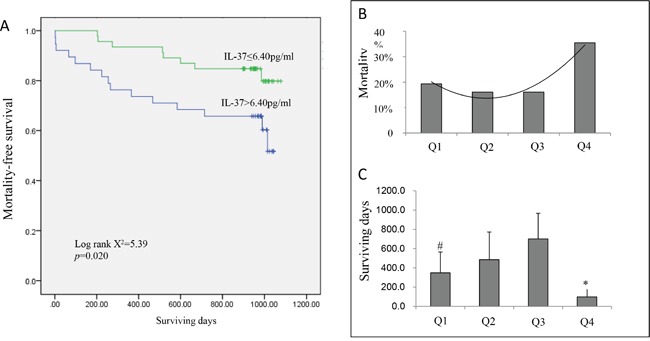
Figure 2.

A. The Kaplan–Meier curves for death-free survival within 3 years according to median of IL-37 (6.4 pg/ml). High IL-37 group has higher mortality risk to low IL-37 expression group (log rank X2 = 5.16, p = 0.023). B. Mortality and surviving days C. in ACS patients according to quartile of plasma IL-37 level. Q4 had a significantly higher mortality than Q1, Q2 and Q3 (p<0.05). However, Q1 had relative higher mortality and shorter surviving days than Q2 and Q3 (p<0.05). # p<0.05 vs Q2 and Q3, *p<0.05 vs Q1, Q2 and Q3.
