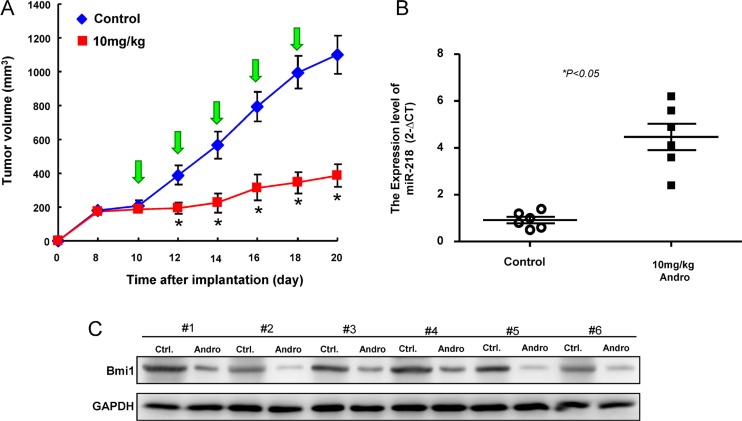
Figure 7. Inhibition of tumor growth by Andrographolide via miR-21/Bmi1 axis.
(A) Quantification of tumor volume changes following administration of Andrographolide; (B) relative miR-218 expression and (C) Bmi1 expression in the excised tumors. Experiments were performed in triplicate. Values are expressed as mean ± SD. *p < .05 compared to control.

