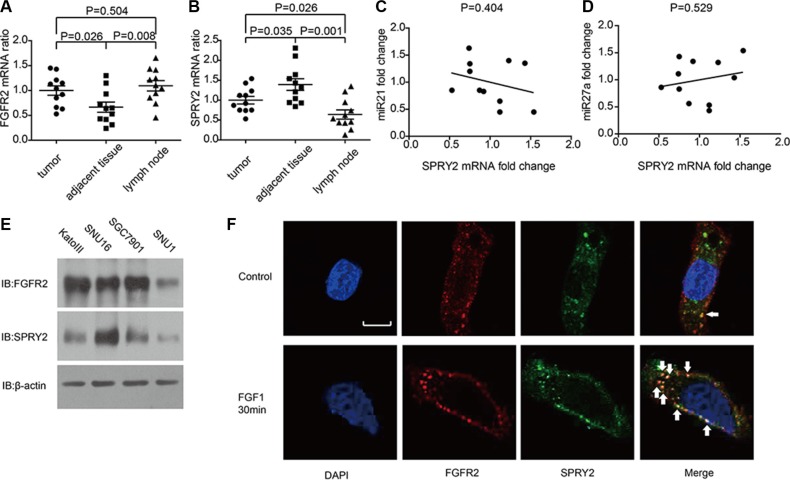
Figure 3. The mRNA level of FGFR2, SPRY2 and relative miRNAs in gastric adenocarcinoma tissues and cell lines.
(A and B)The mRNA levels of (A) FGFR2 and (B) SPRY2 in gastric adenocarcinoma tissues, adjacent tumor tissues and lymph nodes of 11 patients were detected by quantitative PCR with GAPDH as an internal control. The mRNA levels were standardized by ΔΔCt method. FGFR2 mRNA in adjacent tumor tissues was significantly lower than in tumor tissues (P = 0.026) and lymph nodes (P = 0.008), while SPRY2 mRNA in adjacent tumor tissues was significantly higher than in tumor tissues (P = 0.035) and invaded lymph node (P = 0.001). (C and D) The correlation between miR21, miR27a and SPRY2 mRNA. The quantification of miR21, miR27a and SPRY2 was realized by real-time PCR and standardized with the meanvalue set as 1. The correlation between miR21 and SPRY2 (C), between miR27a and SPRY2 (D) was analyzed by Pearson correlation coefficient. (E) FGFR2 and SPRY2 expression in gastric cell line KatoIII, SNU16, SGC7901 and SNU1 were detected by Western blotting. (F) The locations of FGFR2 and SPRY2 in SNU16 cells were indicated by immunofluorescence with/without FGF1 stimulation. Cell nucleus was stained by DAPI, while FGFR2 or SPRY2 was visualized after incubation with corresponding primary antibodies and secondary antibodies after starvation in serum-free medium overnight. Without FGF1 stimulation, FGFR2(red) was distributed around cell membrane and scattered in cytoplasm, and SPRY2 (green) expressed mostly in cytoplasm. After 10 ng/ml FGF1 stimulation for 30 minutes, FGFR2 and SPRY2 formed stimulation cluster in both membrane and cytoplasm. FGFR2 and SPRY2 had more co-localizations after FGF1 stimulation. Arrows pointed representative co-localizations. Scale bar: 5 μm.

