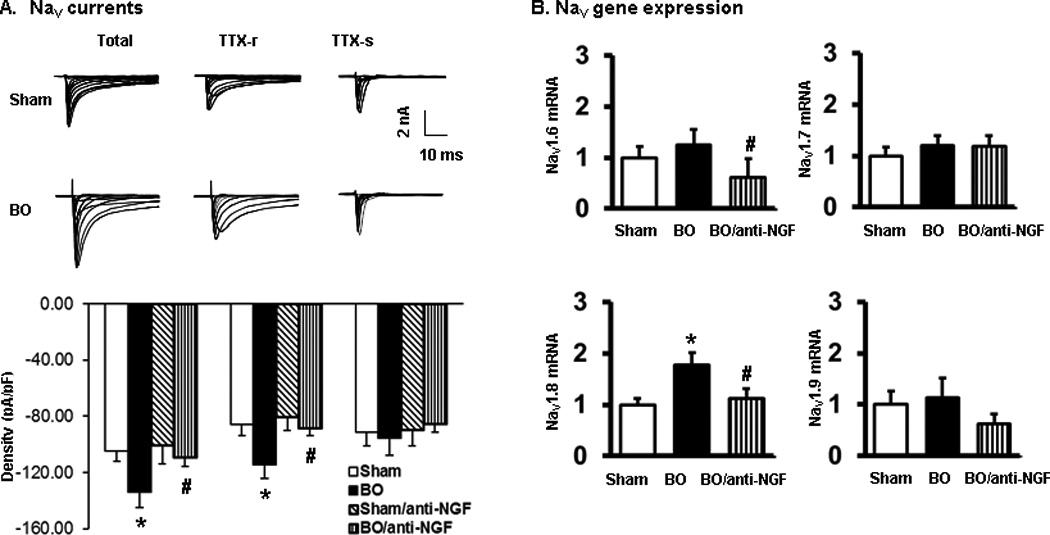
Fig. 7.

Nav currents and gene expression of colon projecting DRG neurons in BO (day 7). A, Nav currents. Top panel shows representative traces of Nav currents in sham and BO (day 7). Bottom panel shows the summarized peak Nav current density including total, TTX-resistant (TTX-r), and TTX-sensitive (TTX-s) currents in sham and BO rats without and with anti-NGF antibody administration. n = 6/30 sham, n = 6/30 BO, n = 4/10 in sham with anti-NGF, and n = 6/26 in BO treated with anti-NGF. *P < 0.05 vs. sham. #P < 0.05 vs. BO. B, Expression of Nav1.6, Nav1.7, Nav1.8 and Nav1.9 mRNAs in colon projecting DRG neurons isolated by laser capture microdissection followed by qPCR detection. n = 4 or 5. *P < 0.05 vs. sham. #P < 0.05 vs. BO.
