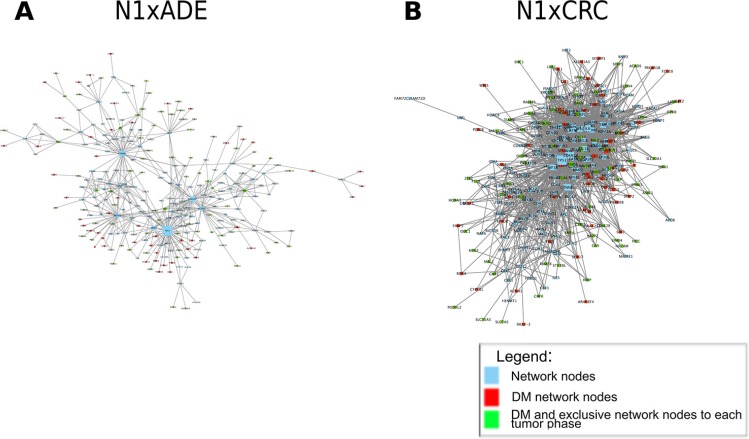
Figure 3. Network analysis.
Networks were derived with the IPA software by using differentially methylated genes in the comparisons of cancer-free patient normal tissues (N1) with ADE and CRC. Panels A and B represent networks characterized by {nodes, edges} as follows A: {257, 500}; B: {275, 1994}.

