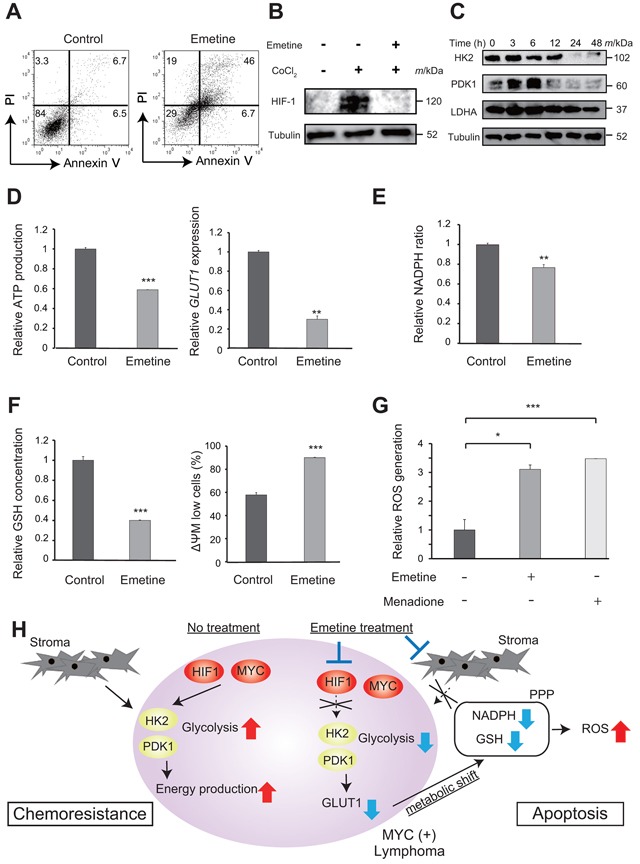
Figure 4. The mechanism of action of emetine on tumor cells.

A. Cell death of tumor cells (#2) co-cultured with CAF treated with emetine. Representative results of FACS analysis of the death of control cells and of cells treated with 0.5 μM emetine for 48 h are shown. B. Immunoblotting analysis of HIF-1α. Whole cell lysates of lymphoma cells (#1) were obtained 24 h after treatment with 100 μM CoCl2 with or without 0.5 μM emetine and were immunoblotted for HIF-1α. Tubulin was immunoblotted as a loading control. C. Immunoblotting analysis of key glycolytic enzymes in lymphoma cells (#2) in the presence of emetine. Whole cell lysates were obtained 0, 3, 6, 12, 24, and 48 h after treatment with 0.5 μM emetine and were immunoblotted for HK2, PDK1 and LDHA. Tubulin was immunoblotted as a loading control. D, E, F, G. Alteration of glucose metabolism of lymphoma cells (#2) in the presence of emetine. (D) (left) ATP production in lymphoma cells treated with emetine. Cell lysates were obtained 24 h after treatment of the co-culture of lymphoma cells with CAF with 0.5 μM emetine, and ATP production was then assessed relative to control. (right) Gene expression of the glucose transporter, GLUT1 in lymphoma cells treated with emetine. RNA was extracted 12 h after treatment of the co-culture of lymphoma cells with CAF with 0.5 μM emetine, following which GLUT1 mRNA expression relative to control was assessed using quantitative RT-PCR. E. The intracellular NADPH/NADP ratio in lymphoma cells treated with 0.5 μM emetine for 24 h is shown. (F) (left) The intracellular GSH concentration of lymphoma cells treated with 0.5 μM emetine for 24 h is shown. (right) The mitochondrial membrane potential (ΔΨM) of lymphoma cells treated with 0.5 μM emetine for 12 h is shown. Lymphoma cells were labeled with JC-1 reagents and were analyzed using a flow cytometer. The percentage of low ΔΨM cells was plotted on a bar graph. (G) ROS production of non-treated lymphoma cells (charcoal gray bars) or lymphoma cells treated with 0.5 μM emetine for 24 h (gray bars) or with 50 μM Menadione, which was used as a ROS inducer, for 3 h (pale gray bars) is shown. ROS production was measured using CellROX Green Oxidative Stress Reagents and is plotted on a bar chart. For D-G, each point represents the mean value taken from two (D) or three (E, F, G) independent experiments. Error bars indicate SEM. Asterisks indicate the P value as follows; *P < 0.05, **P < 0.01, ***P < 0.001. H. Scheme of the proposed mechanism of action of emetine. Emetine is proposed to induce apoptosis via alteration of glucose metabolism including glycolysis and the pentose phosphate pathway (PPP).
