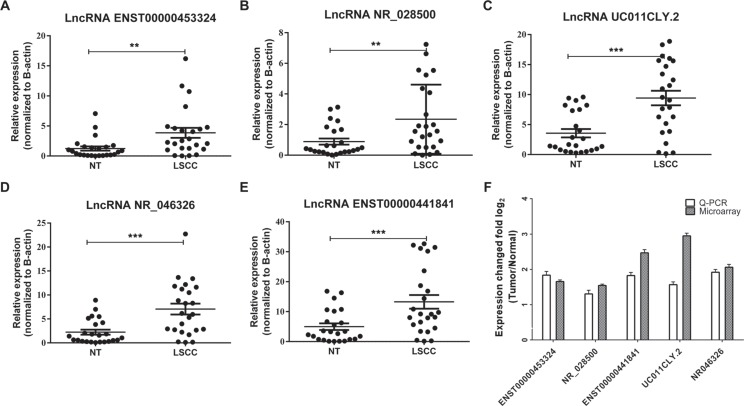
Figure 4. RT-qPCR validation reveals significant lncRNA expression differences in LSCC samples compare to the adjacent normal samples.
(A–E) The expression level of five selected lncRNAs in 24 LSCC samples against corresponding adjacent NT samples. All the differences of five lncRNAs between LSCC samples and NT samples were significant. (F) Comparison of the expression change fold of five candidate lncRNAs in three paired patients’ microarray results and 24 paired patients’ qPCR results. The heights of the columns in the chart represent the mean expression value of log2 fold changes (tumor/normal) for each of the five validated lncRNAs in the microarray and RT- qPCR data; the bars represent standard errors. ** statistically significant at: p < 0.01 (two-tailed t-test); *** statistically significant at: p < 0.001 (two-tailed t-test).

