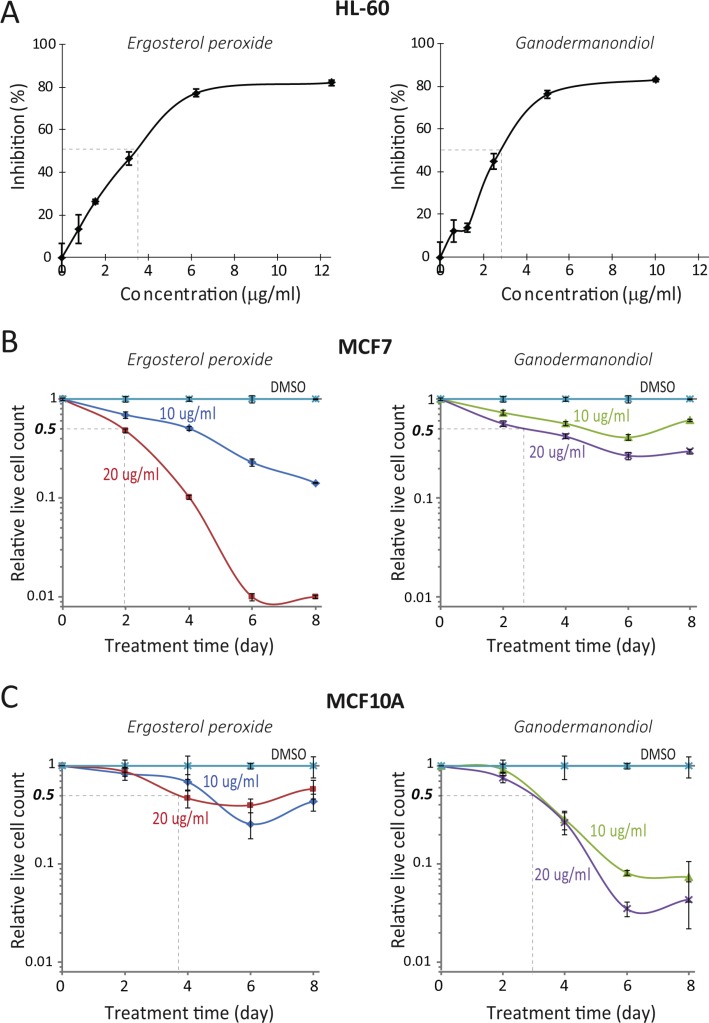
Figure 1. Compound cytotoxicity against proliferating cells.
(A) Compound inhibition effect on cycling HL-60 lymphoma cells. HL-60 cells were treated with ergosterol peroxide or ganodermanondiol at indicated concentrations (x-axis) for 48 hours. The inhibition rate (y-axis) of compound was determined as (Mc-Mt)/Mc*100%, where Mt and Mc corresponded to the average readings of treated samples and non-treated controls (triplicates) in the MTS assay, respectively. Error bar indicates the standard error of the mean. (B, C) Compound cytotoxicity time course in cycling MCF7 and MCF10A cells. MCF7 cells (B) and MCF10A cells (C) were treated with ergosterol peroxide or ganodermanondiol at indicated concentrations. The relative live cell count (y-axis) refers to the ratio of the median number of live cells in a compound-treated sample over that in the DMSO vehicle control (four replicates each). Live cell count was determined by the PI fluorescence assay (see Methods) at the indicated day (x-axis) during the course of treatment. Error bar indicates the standard error of the median (of four replicates).

