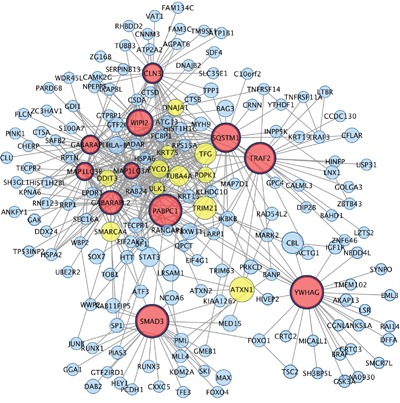
Figure 4. Hub genes and their first connected genes from network detected among down-regulated genes in co-cultured keratinocytes and melanocytes from individuals harbouring Red hair color MC1R variants (GSE44805 dataset).

Only the first connection of hub genes is indicated. Nodes represent genes and edges indicate direct interaction between proteins. Nodes are coloured based on number of degree in Red (degrees >μ+ 3σ; x>22.2), yellow ( μ+ 3σ < degree>μ+ 2σ; 22.2<degree>16.3), blue (degrees< μ+2σ, degree<16.3 Node size indicate Betweenness centrality values. Hub genes are those nodes with the widest border. The hub genes (N=11 nodes) connects 177 out of 411 nodes.
