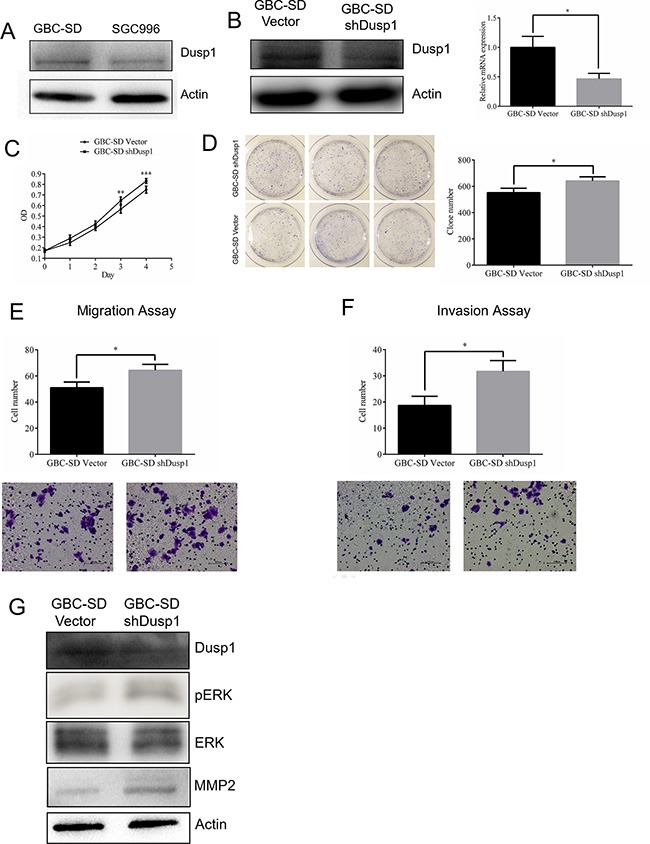
Figure 4. Knocking down DUSP1 in gallbladder cancer cell lines GBC-SD.

Expression level of DUSP1 was higher in GBC-SD cell (A). Knocking down Dusp1 in GBC-SD cell (western blot and Q-PCR) (B). Proliferation was evaluated by MTT assay (C), clone formation assay and relative efficiency of 3 experiments (D). Representative images and quantitatively analysis of migrated GBC-SD cells knocking down DUSP1 versus vector control (E). Representative images and quantitatively analysis of invaded GBC-SD cells knocking down DUSP1 or vector control (F). Western blot analysis results show lower expression of DUSP1 and higher expression of pERK and MMP2 in the GBC-SD DUSP1 knocking down cells (G). (*P < 0.05, **P < 0.01, ***P < 0.001, ****P < 0.0001).
