

Summary
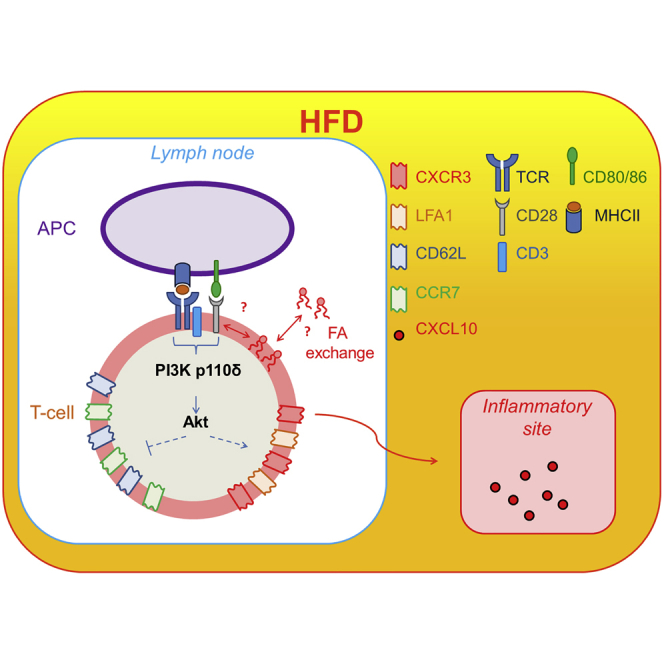
Low-grade systemic inflammation associated to obesity leads to cardiovascular complications, caused partly by infiltration of adipose and vascular tissue by effector T cells. The signals leading to T cell differentiation and tissue infiltration during obesity are poorly understood. We tested whether saturated fatty acid-induced metabolic stress affects differentiation and trafficking patterns of CD4+ T cells. Memory CD4+ T cells primed in high-fat diet-fed donors preferentially migrated to non-lymphoid, inflammatory sites, independent of the metabolic status of the hosts. This was due to biased CD4+ T cell differentiation into CD44hi-CCR7lo-CD62Llo-CXCR3+-LFA1+ effector memory-like T cells upon priming in high-fat diet-fed animals. Similar phenotype was observed in obese subjects in a cohort of free-living people. This developmental bias was independent of any crosstalk between CD4+ T cells and dendritic cells and was mediated via direct exposure of CD4+ T cells to palmitate, leading to increased activation of a PI3K p110δ-Akt-dependent pathway upon priming.
Keywords: CD4, T lymphocyte, effector memory, differentiation, obesity, high-fat diet, inflammation, palmitate, saturated fatty acid, Akt
Graphical Abstract
Highlights
-
•
High-fat diet causes development of inflammatory effector memory CD4+ T cells
-
•
A PI3K p110δ-Akt-dependent pathway is key to this CD4+ developmental bias
-
•
This pathway is induced by direct exposure of CD4+ T cells to palmitate
-
•
CD4+ developmental bias is corrected by inactivation of PI3K p110δ-Akt pathway
Lymphocyte infiltration of non-lymphoid tissues, including adipose and vascular tissues, is a prominent feature of chronic inflammation in diet obesity. Mauro et al. find that the saturated fatty-acid palmitate activates a PI3K p110δ-Akt pathway leading to CD4+ T cell differentiation into effector memory-like T cells upon priming in obese mice and humans.
Introduction
Obesity is a major and ever growing burden on public health worldwide. Individuals with obesity are at increased risk of several health conditions including type 2 diabetes, dyslipidaemia, liver steatosis, hypertension, cardiovascular disease, osteoarthritis, as well as various forms of cancer (Faulds and Dahlman-Wright, 2012, Mauro and Marelli-Berg, 2012, Norata et al., 2015). A strong link between obesity and the establishment of chronic systemic inflammation has recently emerged (Bjørndal et al., 2011) and is often related to increased expression of adipokines (i.e., leptin, chemerin, and resistin), myokines, and pro-inflammatory mediators (i.e., tumor necrosis factor [TNF]-α, interleukin [IL]-1, and IL-6), and decreased expression of the anti-inflammatory cytokine, adiponectin (Norata et al., 2015). In obesity, activated immune cells (including T cells, macrophages, and dendritic cells [DC]) infiltrate adipose tissue, promoting in turn the production of pro-inflammatory cytokines, such as TNF-α, IL-6, resistin, and monocyte chemotactic protein-1 (MCP-1/CCL2) (Mathis and Shoelson, 2011, Norata et al., 2015). This process is thought to underlay the activation of both the innate and adaptive arms of the immune system, which results in the chronic inflammatory response observed in obese subjects (Larbi et al., 2008, Shaw et al., 2010). While T cells, B cells, macrophages, neutrophils, and mast cells are increased in number in the visceral adipose tissue (AT) of obese individuals, specific subsets of T cells (helper T cell type [Th2], regulatory T cells, and invariant natural killer T [iNKT] cells), as well as eosinophils are reduced (Cildir et al., 2013). Obesity-related inflammation, caused by excessive and inappropriate activation of the immune system, is pivotal to disease progression and the development of complications, such as atherosclerosis and type 2 diabetes (Norata et al., 2015). T lymphocytes play a major role in the development of these inflammatory processes both via direct cytotoxic activities and secretion of cytokines that influence the severity and outcome of the inflammatory reaction (Hamann et al., 2000). Based on the observation that T cells in the adipose tissue display specific T cell receptor (TCR) rearrangements, it has been proposed that obesity might be associated with an autoimmune response (Gerriets and Rathmell, 2012).
The mechanisms of enhanced T cell activation and tissue infiltration during obesity, however, remain elusive.
Altered antigen presentation by DC has been proposed to underlie the activation of adaptive immunity observed in dyslipidaemia. Although AT-derived DC in obesity display an immature phenotype with lower expression of activation markers, such as CD40, CD80, and CD86 (Chen et al., 2014), they promote the differentiation of pro-inflammatory interferon (IFN)γ+ CD4+ T cells (Chen et al., 2014).
A recent report has implicated dietary long- and medium-chain fatty acids (FA) in T cell differentiation toward Th1 and Th17 subsets in autoimmune responses of the CNS (Haghikia et al., 2015); however, whether FA can directly affect T cell activation and differentiation toward specific cell subsets during metabolic overload remains to be established.
In this study, we investigated the phenotypic, functional, and migratory features of memory CD4+ T cells in experimental models of saturated FA-induced metabolic stress, as well as in human CD4+ T cells obtained from lean, overweight, and obese individuals in a large cohort of free-living people (Progressione della Lesione Intimale Carotidea [PLIC] study: n = 2,606). Mechanistic studies show that direct exposure of CD4+ T cells to saturated FA; i.e., palmitate, which is enriched in high-fat diet (HFD), induces CD4+ T cells to acquire a specific CD44hi-CCR7lo-CD62Llo-CXCR3+-LFA1+ pro-inflammatory functional phenotype via enhanced engagement of a PI3K p110δ-Akt-dependent pathway upon priming, but independent of the modality of antigen presentation by DC.
Results
Priming following HFD Induces Differentiation of a CD4+ T Cell Population that Readily Migrates to Inflamed, Non-lymphoid Tissues Independent of the Metabolic Status of the Host
Given that lymphocyte infiltration of non-lymphoid tissues is a prominent feature of chronic inflammation, we first assessed whether HFD-induced metabolic stress directly promotes the generation of T cell populations with specific migratory features. To this aim, memory CD4+ T cells were generated in Rag2-deficient TCR transgenic Marilyn female mice, which harbor monoclonal CD4+ T cells specific for the male antigen H-Y (Lantz et al., 2000), by intraperitoneal (i.p.) injection of male splenocytes (Robertson et al., 2007). CD4+ T cells were then isolated from the lymph nodes of donors fed 8-week chow (CD) or HFD and adoptively transferred in HFD- or CD-fed (i.e. fed chow or high-fat diet for 8 weeks, respectively) C57BL/6 male recipients that had been i.p. injected with zymosan and IFNγ 48 hr earlier to induce localized inflammation (Figures S1A–S1C) (Fu et al., 2014). In vivo-primed CD4+ T cells isolated from HFD donors exited from the blood circulation of CD recipients with a kinetic 24 hr faster than their CD counterpart (Figure 1A). CD4+ T cells that were primed in HFD donors also trafficked preferentially to the non-lymphoid, inflamed sites (peritoneal cavity) of both HFD and CD recipients (Figure 1B). In contrast, primed CD4+ T cells from CD donors preferentially localized to the mesenteric lymph nodes of both CD and HFD recipients (Figure 1C). No difference in CD4+ T cell localization to the spleen was observed when comparing equal numbers of adoptively transferred CD and HFD donors (Figure 1D). These results indicate that memory T cell populations induced in CD- or HFD-fed animals are characterized by different trafficking patterns.
Figure 1.

Priming following HFD Induces Differentiation of a CD4+ T Cell Population that Readily Migrates to Inflamed, Non-lymphoid Tissues Independent of the Metabolic Status of the Host
In vivo-primed CD4+ T cells isolated from pooled lymph nodes of HFD or CD Marilyn female donor mice, fluorescently labeled with CFSE or PKH26, respectively, in different tissue compartments (as described) of HFD or CD C57BL/6 male recipient mice 48 hr post-i.v. injection of donor cells. The male recipients were previously i.p. injected with zymosan (1 mg/mouse) and IFNγ (600 U/mouse).
(A) Dot plots and quantification of donor cells in the blood circulation of CD recipient mice; 2 hr, 24 hr, and 48 hr post-i.v. injection of donor cells.
(B–D) Dot plots and quantification of the localization of donor cells, fluorescently labeled with CFSE (HFD) or PKH26 (CD) in the peritoneal cavity (B), mesenteric lymph nodes (C), and spleen (D) of HFD or CD recipient mice.
(E) Survival curve of C57BL/6 male skin grafts on HFD or CD Marilyn female recipient mice up to 28 days post-transplantation.
(A–D) n = 4–6 independent recipients.
(E) n = 7 HFD, n = 9 CD independent recipients. (A–D) The values denote mean ± SEM. ∗p < 0.05; ∗∗p < 0.01; and ∗∗∗p < 0.001. Mantel-Cox test, ∗p < 0.05.
To establish the pathophysiological relevance of these differential trafficking patterns, we performed HY-mismatched skin grafts, whereby male skin was implanted on the upper right back of CD- or HFD-fed Marilyn female recipients. We found that rejection of HY-mismatched skin was significantly accelerated in HFD as compared to CD female recipients (Figure 1E) (Molinero et al., 2016). Activation of CD4+ T cells and their localization to the graft are known to be instrumental to rejection in this system (Chen et al., 2003). Indeed, we observed that HY-mismatched skin graft rejection was completely abrogated in Rag2KO mice (that are deficient for mature T and B cells) independent of the diet they received (Figure S1D). Reconstitution of HFD Rag2KO mice with CD4+ T cells isolated from Marilyn mice resulted in a rapid rejection of the transplanted male-derived skin (Figure S1D), showing the crucial role these cells play in such system. These findings support the conclusion that biased differentiation of CD4+ T cells toward a pro-inflammatory effector memory phenotype takes place during HFD-induced metabolic stress.
HFD-Induced Metabolic Stress Promotes the Differentiation of Primed CD4+ T Cells to a CXCR3+-LFA1+ Effector Memory-like Phenotype in Mice
Based on the distinct homing preferences of memory T cells generated in HFD- or CD-fed animals and the stronger immune response elicited in HFD animals, we asked whether a biased differentiation of activated CD4+ T cells toward a pro-inflammatory phenotype—and associated homing receptors—takes place upon priming following HFD-induced metabolic stress.
Using the same immunization procedure as that used for the experiments presented in Figures 1A–1D, we found that HFD-fed hosts displayed an increase in the size of the CD44hi-CCR7lo-CD62Llo-CXCR3+-LFA1+ effector memory-like CD4+ T cell population and no difference in the CD44hi-CCR7hi-CD62Lhi central memory CD4+ T cells as compared to CD4+ T cells primed in CD-fed mice (Figures 2A–2D and S2A–S2D). In contrast, the size of naive T cells was reduced in HFD (Figures 2A, 2B, S2A, and S2B). These data suggest a preferential CD4+ T cell differentiation toward an effector memory phenotype under HFD regimen in concomitance with a reciprocal reduction of the naive cell population without affecting the size of the central memory pool. No difference was observed in the expression of the activation markers CD25 and CD44 (Figures 2E, 2F, S2E, and S2F) by memory CD4+ T cells activated in CD or HFD hosts, indicative of similar priming efficiency in either metabolic background. In agreement with the observed phenotypes, a significantly larger fraction of in vivo-primed CD4+ T cells isolated from the lymph nodes of HFD mice migrated in response to the pro-inflammatory chemokine CXCL10 (a CXCR3 ligand) in ex vivo chemotaxis assays, while most in vivo-primed CD4+ T cells isolated from the lymph nodes of CD mice migrated to the homeostatic lymphoid tissue chemokines CCL19 and CCL21 (ligands of CCR7) (Figure 2G). To investigate the cellular sources of CXCL10 in vivo, mice received an i.p. injection of IFNγ. At 48 hr later, intracellular staining of CXCL10 in a number of immune cell populations retrieved from the peritoneal cavity was performed. We chose this system because of its relevance to the peritoneal recruitment system shown in Figures 1A–1D. Data indicate that resident (peritoneal) and to a less extent infiltrating (monocyte-derived) macrophages are main sources of CXCL10 in this model (Figures S2G and S2H). Furthermore, we observed an increase in the IFNγ+ and IL4+ populations upon priming following HFD (Figures 2H and 2I).
Figure 2.

HFD-Induced Metabolic Stress Promotes the Differentiation of Primed CD4+ T Cells to a CXCR3+-LFA1+ Effector Memory-like Phenotype in Mice
(A–F) Cell surface staining of CCR7 (A), CD62L (B), CXCR3 (C), LFA1 (D), CD25 (E), and CD44 (F) in in vivo-primed CD4+ T cells isolated from pooled lymph nodes of the HFD or CD Marilyn female donor mice used in Figures 1A–1D (absolute numbers).
(G) Ex vivo chemotaxis (3 hr, 6 hr, and 24 hr time points) of in vivo-primed CD4+ T cells isolated from pooled lymph nodes of the HFD or CD Marilyn female donor mice used in Figures 1A–1D in response to CXCL10 (300 ng/mL), CCL19/21 (200 ng/mL of each chemokine), or media only.
(H and I) Intracellular staining of IFNγ (H) and IL4 (I) in in vivo-primed CD4+ T cells isolated from mesenteric lymph nodes of HFD or CD mice.
(A–F) n = 3–6 independent donors.
(G) n = 3 independent donors (each donor was tested in duplicate).
(H and I) n = 5 independent mice. The values denote mean ± SEM. ∗p < 0.05; ∗∗p < 0.01; and ∗∗∗p < 0.001.
Our findings are in line with previous work showing that increased expression of CXCR3 in inflammatory conditions, such as obesity and atherosclerosis, drives accumulation of inflammatory T cells in fat sites. Indeed, CXCR3- or CXCL10-deficient mice are protected from obesity- and atherosclerosis-induced inflammation in association with reduced accumulation of effector T cells and macrophages in AT and atherosclerotic plaques (Gupta et al., 1997, Rocha et al., 2014, Veillard et al., 2005).
Obesity Is Associated with Increased Numbers of Circulating CXCR3+ Effector Memory T Cells in Humans
A cohort of 1,172 subjects was selected by probability sampling from a large survey of free-living people (PLIC study: n = 2,606; average age 66 years). The selected cohort was representative of the entire PLIC cohort in terms of age, gender, and clinical parameters according to the Kolmogorov-Smirnov test; individuals were stratified in three groups (i.e. lean, overweight, and obese), based on BMI, and a number of biochemical and cellular markers of their peripheral blood were analyzed (Table S1). In particular, this analysis revealed increased total lymphocyte counts in the blood of overweight and obese as compared to lean individuals (Figure 3A; Table S1). From this cohort, a detailed immunophenotype was performed in a group of n = 187 subjects. Again, these individuals were selected by probability sampling and were representative of the entire cohort according to the Kolmogorov-Smirnov test. Specific subsets of circulating CD4+ T cells were assessed by 10-parameter/8-color polychromatic flow cytometry with CD3, CD4, CD45RO, CD45RA, CCR7, CCR5, CXCR3, and HLA-DR as markers. The main CD4+ T cell subsets present in the blood were identified by flow cytometry based on a well-defined gating strategy (Figures S3A and S3B). The percentage of total T-helper lymphocytes was equal in the three groups (Figure 3B); however, we found a strong association of the obese condition with reduced naive T cells and increased effector memory T cells (Figures 3C and 3D).
Figure 3.

Obesity and Body Fat Distribution in Humans Positively Associates with an Increase in CXCR3+ Effector Memory T Cells
(A–D) Number of total lymphocytes (A) and % of helper, naïve, and effector memory T cells (B–D) purified from the peripheral blood of lean, overweight, and obese subjects stratified according to BMI.
(E) % of effector memory T cells purified from the peripheral blood of obese subjects stratified according to BMI either <35 or ≥35.
(F–H) Correlation of naïve (F), effector memory (G), and CXCR3+ (H) T cells with android/gynoid ratio.
(A) n = 1,172.
(B–D and F–H) n = 187.
(E) n = 21 BMI < 35, n = 5 BMI ≥ 35. ANCOVA, ∗p < 0.05.
To gain further insights into the relationship in humans between obesity and the effector memory phenotype of CD4+ T cells, we focused on the few very obese patients in our cohort (BMI > 35 kg/m2, n = 5) and observed that the percentage of effector memory T cells was raised to 18.2% (11.2–21.3) as compared to 13.4% (8.8–18.25) of the entire obese population (Figures 3D and 3E) and to 10.2% (8.4–12.5) of the lean population (see Figure 3D). To address the potential link of this phenotype with obesity-related chronic inflammation, we also analyzed the blood levels of C reactive protein (CRP) in the lean, overweight, and obese subjects. As expected, CRP levels rose progressively with increasing BMI (Figure S4A), corroborating the correlation between obesity and inflammation. However, no significant correlation was observed between CRP levels and effector memory T cells (Figure S4B). Furthermore, no correlation between fasting glucose levels and effector memory T cells was observed (p = 0.117). Also, effector memory T cells were not significantly increased in type 2 diabetes subjects (n = 13) as compared to the rest of the subjects in the cohort (p = 0.069).
The body mass fat distribution of each individual was also analyzed by dual-energy X-ray absorptiometry (Figure S4C), and the resulting android/gynoid ratio was correlated with the percent of various T cell subsets. The android/gynoid ratio correlated negatively with the naive T cell subset (Figure 3F) and positively with the CXCR3+ effector memory T cell subset (Figures 3G and 3H). No significant correlation between the android/gynoid ratio and HLADR+ or CCR5+ effector memory T cell subsets was observed instead (Figures S4D and S4E).
Antigen Presentation by DC from Metabolically Stressed Donors Does Not Affect T Cell Differentiation to a Pro-inflammatory Effector Memory-like Phenotype
Prompted by previous suggestions that altered antigen presentation by DC might affect T cell activation during metabolic stress (Chen et al., 2014, Shamshiev et al., 2007), we assessed the effect of splenic DC purified from HFD or CD animals on T cell activation and differentiation. We found that in vitro co-cultures of DC isolated from the spleen of CD-fed C57BL/6 male mice with CD4+ T cells obtained from the lymph nodes of CD-fed Marilyn mice induced a strong proliferative response of Marilyn CD4+ T cells, which was reduced when CD4+ T cells were isolated from donors fed HFD (Figures 4A and S5A). In contrast, DC purified from the spleen of C57BL/6 male mice fed HFD were significantly less effective in promoting CD4+ T cell proliferation compared to their “CD-fed” counterpart, irrespective of the T cell metabolic status (i.e., CD or HFD CD4+ T cell donors [Figures 4A and S5A], in line with previous reports; Shamshiev et al., 2007). These data suggest that the metabolic status of DC plays a role in determining their ability to promote CD4+ T cell proliferation. However, it did not affect the differentiation of CD4+ T cells to central versus effector memory phenotype. Indeed, HFD CD4+ T cells showed a higher percent of CD44hi-CCR7lo-CD62lo-CXCR3+ cells as compared to CD CD4+ T cells (consistent with Figures 2A–2C), independent of whether they were co-cultured with DC from HFD- or CD-fed donors (Figure 4B). Similar results were obtained in vivo when CD4+ T cells isolated from female Marilyn mice were co-injected with DC from HFD or CD C57BL/6 male donors in C57BL/6 female recipients (i.e., reduced CD4+ T cell proliferation in the presence of DC from HFD-fed mice and no effect on central memory versus effector memory differentiation; Figures S5B and S5C).
Figure 4.

Antigen Presentation by DC from Metabolically Stressed Donors Does Not Affect T Cell Differentiation to a Pro-inflammatory Effector Memory-like Phenotype
(A) Dot plots and quantification of in vitro proliferation of CFSE-labeled CD4+ T cells isolated from pooled lymph nodes of HFD or CD Marilyn female mice incubated for 3 days with CD11c+ DC isolated from the spleen of HFD or CD C57BL/6 male mice. The undivided and fourth division populations are quantified by dilution of the CFSE-label.
(B) Cell surface staining of CD44, CCR7, CD62L, and CXCR3 in the undivided population of CFSE-labeled CD4+ T cells shown in (A).
(C) Cell surface staining of CD40, CD80, and CD86 in CD11c+ DC used in (A).
(A and B) n = 3 independent mice (each mouse was tested in triplicate).
(C) n = 3 independent mice. The values denote mean ± SEM. ∗∗p < 0.01 and ∗∗∗p < 0.001.
In line with previous reports (Shamshiev et al., 2007), DC isolated from HFD-fed mice showed impaired activation as indicated by reduced expression of the activation markers CD80 and CD86 as compared to lean DC (Figure 4C).
CD4+ T Cell Exposure to Saturated FA Causes Enhanced Activation of a PI3K p110δ-Akt-Dependent Pathway upon Priming
Having ruled out a possible role for altered antigen presentation by DC in biasing CD4+ T cell differentiation to the CXCR3+ effector memory phenotype observed during HFD-induced metabolic stress, we sought to establish whether CD4+ T cell intrinsic alterations were responsible for this event by interrogating pathways controlling nutrient responses in T cells. PI3K/Akt and mammalian target of rapamycin complexes (mTORC1 and mTORC2) are known to be rapidly activated upon T cell priming and control transcriptional and metabolic programs that sustain cell activation (Finlay et al., 2012, Macintyre et al., 2011). We found a substantial increase in the levels of Akt activation (phosphorylation at serine 473, a target of mTORC2) in in vivo-primed CD4+ T cells isolated from the lymph nodes of HFD- as compared to CD-fed mice (Figure 5A, compare lanes 6–8 versus 1–2). Similar results were obtained with CD4+ T cells isolated from the peripheral blood of obese versus lean individuals selected from the PLIC cohort (Figure 5B). In contrast, threonine 308 on Akt and the mTORC1 target S6 did not undergo any significant modulation when comparing in vivo-primed CD4+ T cells isolated from the lymph nodes of HFD or CD mice (Figures 5A and S6A). In line with recent literature (Finlay et al., 2012, Macintyre et al., 2011), our data suggest that CD4+ T cell priming following HFD regimen triggers a PI3K/Akt pathway via mTORC2, but does not result in downstream mTORC1 activation.
Figure 5.

Direct Exposure of CD4+ T Cells to Saturated FA Causes Enhanced Activation of a PI3K p110δ-Akt-Dependent Pathway upon Priming
(A) Levels and densitometric quantification of p-Akt (S473), Akt, p-S6 (S235/236), and β-actin protein expression in in vivo-primed CD4+ T cells isolated from mesenteric lymph nodes of CD and HFD mice i.p. injected with the PI3K inhibitor IC87114 or left untreated.
(B) Levels and densitometric quantification of p-Akt (S473) and Akt protein expression in CD4+ T cells purified from the peripheral blood of lean and obese human subjects.
(C) Membrane fluidity index in in vivo-primed CD4+ T cells isolated from mesenteric lymph nodes of CD and HFD mice, calculated as the ratio of oleic acid (C18:1) to linoleic acid (C18:2).
(D) Cell surface staining of CTxB in in vitro activated (Act) CD4+ T cells isolated from the lymph nodes of CD and HFD mice. The quantification of aggregation of CTxB is measured by bright detail intensity of the signal.
(E–H) Cell surface staining of CD44 with CCR7 (E), CD62L (F), CXCR3 (G), and LFA1 (H) in in vivo-primed CD4+ T cells isolated from mesenteric lymph nodes of PED and PCD mice.
(I and J) Protein levels and densitometric quantification of p-Akt (S473), Akt, p-S6 (S235/236), and S6 protein expression (I), and gene expression of CCR7 and CD62L (J) in CD4+ T cells isolated from pooled lymph nodes of mice and cultured overnight with IL-7 (1 ng/mL) in the presence or absence of palmitic, linoleic, or stearic acid (200 μM), followed by activation with plate bound anti-CD3 (0.5 μg/mL) and anti-CD28 (2.5 μg/mL) for the indicated time points.
(K and L) Levels of CCR7 and CD62L gene expression (K) and CCR7 protein (L) in CD4+ T cells isolated from pooled lymph nodes of mice, then activated with plate bound anti-CD3 (0.5 μg/mL) and anti-CD28 (2.5 μg/mL) for the indicated time points in the presence or absence of the Akt activator SC79 (500 nM).
(A and B) Each lane shows data from independent mouse/human samples.
(C–H) n = 3–6 independent mice.
(I) Representative data of n = 3 independent mice.
(J–L) 3–6 pooled mice. The values denote mean ± SEM. ∗p < 0.05; ∗∗p < 0.01; and ∗∗∗p < 0.001.
A recent report has implicated direct signaling induced by dietary FA in T cell differentiation in the gut, with middle- and long-chain FA supporting Th1 and Th17 cell differentiation and short-chain FA promoting Treg cell development (Haghikia et al., 2015). In line with previous evidence, using lipidomic analysis, we found that HFD alters the fatty acid and phospholipid profile of T cells (Figure S6B), resulting in increased membrane fluidity (Figure 5C). This might underlay a reduced threshold for TCR clustering and activation in HFD (Swamy et al., 2016). Indeed, ImageStream analysis enabled us to observe that in vitro activation of T cells isolated from HFD as compared to CD mice results in increased aggregation of Cholera enterotoxin (CTx) B staining (Figures 5D and S6C), indicative of enhanced formation of lipid rafts, a key signaling event downstream of TCR engagement (Viola et al., 1999). The saturated FA palmitate has been shown to directly promote the activation of the inflammasome via NLRP3 and ASC (Wen et al., 2011) and of the Toll-like receptor (TLR) 4/MyD88 pathway (Eguchi et al., 2012). We therefore reasoned that the observed effector memory phenotype and enhanced activation of the PI3K/Akt pathway during CD4+ T cell “HFD priming” could be due to a direct effect of the saturated FA palmitate, whose levels increase during HFD. Mirroring the results shown in Figures 2A–2D, we found that palmitate enriched diet (PED)-fed animals displayed an increase in the size of the CD44hi- CCR7lo-CD62Llo-CXCR3+-LFA1+ effector memory-like CD4+ T cell population and no difference in the CD44hi-CCR7hi-CD62Lhi central memory CD4+ T cells as compared to CD4+ T cells primed in the corresponding palmitate control diet (PCD) fed-mice (Figures 5E–5H). In contrast, the size of the naive T cell subset was reduced upon PED (Figures 5E–5H). Further, CD4+ T cells were cultured overnight with IL-7 in the presence or absence of either palmitic or linoleic acid at a concentration which mirrors plasma levels in obese individuals (200 μM), followed by activation with anti-CD3 and anti-CD28 for the indicated time points. As shown in Figure 5I, CD4+ T cell activation in the presence of palmitic acid for 2 hr showed a trend of enhanced Akt activation compared to linoleic acid or untreated control without any modulation of S6. In similar experimental settings, only CD4+ T cell activation in the presence of palmitic, but not stearic, acid for 48 hr led to reduced levels of CCR7 and CD62L mRNA (Figure 5J). In line with previous reports (Eguchi et al., 2012, Wen et al., 2011), these data suggest the existence of specific sensing mechanisms for palmitate.
To further link the activation of the PI3K/Akt pathway to the observed specific CD4+ T cell differentiation during HFD priming, we activated CD4+ T cells via CD3/CD28 antibody ligation in the presence or absence of the Akt activator SC79. As expected, such treatment led to marked Akt phosphorylation (Figure S6D). Importantly, enhanced Akt activation led to reduced levels of CCR7 and CD62L mRNA, as well as CCR7 protein (Figures 5K and 5L), indicating that increased Akt activation during CD4+ T cell priming directly promotes the pathway leading to the differentiation of effector memory-like T cells.
The PI3K, Akt Pathway Is Key for the Differentiation of CXCR3+ Effector Memory T Cells
We addressed the question as to whether enhanced PI3K/Akt activation as we observed during HFD priming in CD4+ T cells was instrumental to the biased T cell differentiation to the observed CXCR3+ effector memory phenotype. The p110δ subunit of PI3K is crucial for correct TCR signaling and T cell activation (Okkenhaug et al., 2002). Furthermore, p110δ engagement during T cell priming is instrumental for Akt activation and differentiation toward an effector memory phenotype, at least in CD8+ T cells (Finlay et al., 2012, Macintyre et al., 2011). We therefore took genetic and pharmacologic approaches to selectively target p110δ and Akt activities in vivo. First, allogeneic CD4+ T cells were primed in vivo in HFD-fed p110δD910A (expressing kinase-dead p110δ) or wild-type (WT) mice. Genetic inhibition of p110δ activity completely reversed CD4+ effector memory differentiation in HFD-fed animals (Figures 6A–6D). This was accompanied by a reduction of both Akt activation on serine 473 (Figure 6E) and migration in response to the chemokine CXCL10 (Figure 6F). Similarly, administration of the selective p110δ inhibitor IC87114 during priming prevented biased differentiation of allogeneic CD4+ T cells toward an effector memory phenotype upon priming (Figures 6G–6J). Of note, administration of IC87114 completely blocked Akt activation in HFD CD4+ T cells, but only partially in CD mice (Figure 5A, lanes 9–11 versus 3–5). Finally, to further causally link PI3K and Akt, we also treated CD WT mice with the Akt-selective activator SC79. Similar to what we had observed in vitro (Figures 5K and 5L), this treatment led to increased effector memory differentiation to levels similar to those observed in HFD-fed animals (Figures 6G–6J and S6E).
Figure 6.

The PI3K, Akt Pathway Is Key for the Differentiation of CXCR3+ Effector Memory T Cells
(A–D) Cell surface staining of CD44 with CCR7 (A), CD62L (B), CXCR3 (C), and LFA1 (D) in in vivo-primed CD4+ T cells isolated from mesenteric lymph nodes of HFD P110δD910A or WT C57BL/6 mice.
(E) Levels and densitometric quantification of p-Akt (S473), Akt, p-S6 (S235/236), and S6 protein expression in in vivo-primed CD4+ T cells from (A)–(D).
(F) Ex vivo chemotaxis (3 hr, 6 hr, and 24 hr time points) of in vivo-primed CD4+ T cells isolated from mesenteric lymph nodes of HFD or CD OT-II P110δD910A mice in response to CXCL10 (300 ng/mL), CCL19/21 (200 ng/mL of each chemokine), or media only.
(G–J) Cell surface staining of CD44 with CCR7 (G), CD62L (H), CXCR3 (I), and LFA1 (J) in in vivo-primed CD4+ T cells isolated from mesenteric lymph nodes of CD and HFD mice i.p. injected with the PI3K inhibitor IC87114, the Akt activator SC79, or left untreated.
(A–E and G–J) n = 5 independent mice.
(F) n = 4 independent mice (each mouse was tested in duplicate). The values denote mean ± SEM. ∗p < 0.05; ∗∗p < 0.01; and ∗∗∗p < 0.001.
Inhibition of Fatty Acid Oxidation Prevents Enhanced Effector Memory Differentiation in Saturated Fatty Acid-Enriched Diet
Given the important role of FA oxidation (FAO) in the generation of memory T cells (O’Sullivan et al., 2014), we assessed whether this metabolic pathway contributes to enhanced effector memory differentiation upon priming following saturated fatty acid-enriched diet (PED). As shown in Figures 5E–5H, enrichment of dietary palmitate led to enhanced differentiation of primed CD4+ T cells toward an effector memory phenotype. In vitro, naive T cells increased their rate of oxidative phosphorylation (OCR: oxygen consumption rate) only in response to palmitic, but not stearic, acid (Figure 7A). Etomoxir is an irreversible inhibitor of carnitine palmitoyltransferase-1 (CPT-1), an upstream enzyme in the FAO cascade. We injected mice i.p. with etomoxir during priming in PED-fed mice and found that this treatment completely prevented biased differentiation of effector memory CD4+ T cells we observed upon priming following PED (Figures 7B–7E).
Figure 7.

Inhibition of FAO Prevents Enhanced Effector Memory Differentiation in Saturated Fatty Acid-Enriched Diet
(A) OCR of naive CD4+ T cells isolated from pooled lymph nodes of mice and cultured overnight with IL-7 (1 ng/mL) in the presence or absence of palmitic or stearic acid (200 μM).
(B–E) Cell surface staining of CD44 with CCR7 (B), CD62L (C), CXCR3 (D), and LFA1 (E) in in vivo-primed CD4+ T cells isolated from mesenteric lymph nodes of PED or PCD mice i.p. injected with etomoxir or left untreated.
(A) Six pooled mice tested in 6–10 replicates per treatment.
(B–E) n = 5 independent mice. The values denote mean ± SEM. ∗p < 0.05 and ∗∗p < 0.01.
Discussion
Chronic systemic inflammation in obesity is characterized by the secretion of Th1 cytokines, as well as aberrant T cell infiltration of non-lymphoid tissue, including adipose tissue and arterial wall. Obese AT contains more Th1 lymphocytes and higher levels of IFNγ than its lean counterpart (Rocha et al., 2008). In this study, we have tested the hypothesis that excess dietary saturated FA directly affects the differentiation and trafficking of CD4+ T cells to non-lymphoid tissues. We report that differentiation of memory CD4+ T cells primed in HFD-fed mice is biased toward a CD44hi-CCR7lo-CD62Llo-CXCR3+-LFA1+ effector memory-like phenotype without major changes in the size of the central memory pool. These T cells display preferential trafficking to non-lymphoid, inflammatory sites, as well as increased effector function following adoptive transfer. Although metabolically imbalanced DC from obese/dyslipidaemic hosts tend to support Th1/Th17 responses (Chen et al., 2014, Eguchi et al., 2012, Reynolds et al., 2012, Shamshiev et al., 2007), our data show that they play no role in determining CD4+ T cell commitment to effector memory-like phenotype nor homing. The CD4+ T cell developmental bias is instead mediated by direct exposure of T cells to saturated FA; i.e., palmitate, leading to enhanced activation of a PI3K p110δ-Akt-dependent pathway upon priming. Our data suggest that this pathway might involve mTORC2 leading to Akt activation, but does not result in the downstream activation of mTORC1. The key role of the PI3K p110δ/Akt axis is further confirmed by our observation that selective inactivation of p110δ in HFD can reestablish homeostatic CD4+ T cell responses.
A similar signaling cascade has previously been shown to direct the differentiation of CD8+ effector T cells (Finlay et al., 2012, Macintyre et al., 2011), whereby high levels of Akt activation led to the downregulation of CD62L and CCR7 expression and redirected the trafficking of effector CD8+ T cells away from the secondary lymphoid tissues into the sites of inflammation. Specifically, it has been shown that downstream of TCR engagement, Akt controls transcriptional programs directing cytotoxic T cell fate, but is dispensable for T cell metabolism (Macintyre et al., 2011), while PDK1 directly regulates mTOR and hypoxia-inducible factor 1, leading to an integrated control of metabolism and migration of CD8+ T cells (Finlay et al., 2012). In addition to showing that similar signaling events underlay the differentiation of CD4+ T cells, our data expand the reach of these studies from the basic mechanisms of T cell activation and effector functions control to the biased establishment of unwanted T cell responses; i.e., specific pro-inflammatory effector and migratory phenotypes, in a pathophysiologic context such as obesity. This is in line with a recent study showing the link between obesity and metabolic diseases via increased Th17 T cell differentiation (Endo et al., 2015). It has also been reported that obesity could cause impairment in the T cell memory response to secondary influenza infection, thereby affecting vaccine efficacy (Karlsson et al., 2010). As we did not observe major differences in the size of the central memory population upon priming following HFD or CD, it is possible that central memory cells are functionally impaired in obesity. In line with the above study, we observed an altered DC function following HFD.
Interestingly, our data shown in Figure 5A suggest that in physiologic conditions (CD), different upstream kinases might control the activation of Akt induced upon T cell priming, as the p110δ inhibitor IC87114 did not completely block Akt phosphorylation. By contrast, in HFD mice, Akt phosphorylation was completely abrogated by IC87114, indicating that the enhancement of Akt activation by dietary lipids is particularly dependent on p110δ. The molecular mechanisms of lipid exchange on the T cell membrane in physiology and during HFD remain to be fully established, as well as the question as to whether FA act by altering the cell membrane lipid balance or by binding to specific receptors, as recently suggested (Eguchi et al., 2012, Haghikia et al., 2015, Wen et al., 2011). Our data showing increased membrane fluidity, as well as enhanced formation of lipid rafts upon TCR engagement, might provide some clues as to how excess dietary saturated FA impact on T cell responses. Similarly, our data suggest that specific mechanisms exist for palmitate sensing, which remain to be defined. In this context, we have observed that T cell exposure to FA at the time of TCR triggering in vitro is not sufficient to induce the biased effector memory differentiation we observed in vivo, suggesting that palmitate sensing and alteration of the T cell membrane must occur prior to antigen recognition. Hence, the need to maintain naive T cell viability over prolonged culture with or without FA and in the absence of antigen stimulation has been a major challenge in setting up in vitro models to study T cell differentiation following prolonged exposure to fat overload. We have partially overcome this issue by adding IL-7 to the culture of naive T cells during incubation with or without FA prior to TCR stimulation, and this led to the results we showed in Figures 5I and 5J. Defining in vitro systems of immunization following prolonged exposure to certain nutrients would be extremely useful to test pathways involved with T cell differentiation, such as palmitate sensing.
The observation that etomoxir prevents biased differentiation of effector memory CD4+ T cells upon priming following saturated fatty acid-enriched diet supports the concept that preferential utilization of FAO during T cell activation promotes effector memory CD4+ T cell differentiation following HFD. AMPK-induced FAO has been shown to play an important role in the generation of memory T cells (O’Sullivan et al., 2014). Increased FAO is also a feature of HFD (Cole et al., 2011, Schrauwen et al., 2000). However, reduced AMPK activity is also observed in HFD (Lindholm et al., 2013, Liu et al., 2006), and its reactivation by metformin is known to ameliorate glucose tolerance in obesity/type 2 diabetes. Thus, during HFD, AMPK-induced FAO is unlikely to play a role in the biased effector memory CD4+ T cell differentiation we observe. Whether and how an enhanced PI3K/Akt pathway leads to enhanced FAO remain open questions.
The biased development of pro-inflammatory effector memory CD4+ T cells occurred in mice within 4–8 weeks from exposure to HFD, a time that precedes overt obesity and associated complications. This might imply a causative role of altered T cell differentiation in the pathology accompanying metabolic stress, and that immune challenges occurring naturally in individuals before the establishment of overt obesity could drive cardiovascular disease later in life.
Finally, our observation that selective PI3K p110δ and FAO inhibition can correct CD4+ biased differentiation might provide targets for the therapeutic control of inflammation during metabolic stress. Likewise, our study supports the notion that by modulating metabolism, we can affect immune responses, a relatively novel concept with substantial translational implications. In this regard, hints and hopes come from few recent studies, such as the report that CD4+ T cells from systemic lupus erythematosus (SLE) patients exhibited enhanced glycolysis and mitochondrial metabolism that correlated with their activation status and their excessive IFNγ production was significantly reduced upon in vitro treatment with metformin. The same study also showed that in a number of murine lupus models the combination of metformin and 2-deoxy-glucose led to normalization of CD4+ T cell metabolism and overall reversed disease biomarkers (Mehta and Chandel, 2015, Yin et al., 2015). Such studies pave the way to further research efforts in similar directions.
Experimental Procedures
Ethical Statement
Human blood was obtained from healthy donors according to ethics approval obtained from the Università degli Studi di Milano (Cholesterol and Health: Education, Control and Knowledge - Studio CHECK [SEFAP/Pr.0003] - reference number Fa-04-Feb-01). All in vivo experiments were conducted under the UK Home Office regulation (PPL 70/7443).
Study Population
The PLIC study (a substudy of the CHECK study) is a large survey of the general population living in the northern area of Milan (n = 2,606; average age 66 years) (Baragetti et al., 2013, Norata et al., 2006, Norata et al., 2007), followed at the Center for the Study of Atherosclerosis, Bassini Hospital (Cinisello Balsamo, Milan, Italy). An informed consent was obtained from subjects in accordance to the Declaration of Helsinki. For all participants, information on medical histories and therapies was obtained, and BMI (Kg/m2) and waist/hip ratio (W/H) were calculated. After an overnight fast, blood samples were collected from the antecubital vein for determination of lipid profile and glucose levels, as previously described (Ammirati et al., 2012, Baragetti et al., 2013, Norata et al., 2007). Information on total leukocytes and subfraction counts was available for n = 1,172 subjects, representatives of the entire population in terms of age, gender distribution, and clinical parameters according to the Kolmogorov-Smirnov test. This cohort was divided by BMI in accordance to the World Health Organization definition (lean for BMI < 25 Kg/m2; overweight for 25 Kg/m2 ≤ BMI < 30 Kg/m2; and obese for BMI ≥ 30 Kg/m2; http://www.who.int/en).
Polychromatic Flow Cytometry, Human Studies
Polychromatic flow cytometry (10-parameter/8-color) was performed (as previously described; Ammirati et al., 2012) to obtain a detailed characterization of a total of n = 57 subsets of circulating CD4+ T cells from n = 187 subjects of the PLIC study, representative of the entire population in terms of age, gender distribution, and clinical parameters according to the Kolmogorov-Smirnov test. Whole blood from each subject was collected in EDTA anticoagulated tubes (BD Vacutainer). Samples were stained and fixed on the day of collection. We previously verified that there was no significant difference in the investigated marker levels in samples stained immediately after collection in comparison to samples stained up to a maximum 24 hr time interval post-sampling and stored at room temperature. In order to reduce cellular loss and analysis sampling bias in the specimen, the no wash, whole blood lyses technique was used. Briefly, for each specimen, 50 μL of a mixture of eight antibodies (CD3/CD4/CD45RO/CD45RA/CCR7/CCR5/CXCR3/HLA-DR) was added to 100 μL of whole blood, followed by 20 min incubation in the dark at room temperature. In particular, the panel used consisted of the subsequent cellular surface markers: CD3 (Pacific Blue-labeled, clone HIT3a, BD Pharmingen), CD4 (APC-Cy7, SK3, BD Biosciences), CCR5/CD195 (PE, 2D7, BD Pharmingen), CXCR3/CD183 (FITC, 49801, R&D Systems), CCR7/CD197 (PE-Cy7, 3D12, BD Pharmingen), HLA-DR (Quantum Red, HK14, Sigma-Aldrich), CD45RO (APC, UCHL1, Caltag), and CD45RA (ECD, 2H4, IOTest, Beckman Coulter). After staining, the red blood cells were lysed and fixed with the Immune-Prep System (Beckman Coulter). White cells, diluted in 1 mL total volume, were analyzed on a LSR II Flow Cytometer (BD Biosciences) equipped with four lasers and standard optics. The antibodies were selected to minimize spectral overlap. Furthermore, to reduce the non-specific fluorescence background and optimize the fluorescence signal, we used appropriately titrated directly conjugated monoclonal antibodies. To appropriately identify positively stained cells and differentiate them from background autofluorescence for gate inclusion, we used the Fluorescence Minus One strategy. Fluorescence intensity for each signal measured was standardized using multiple peak Rainbow Calibration Particles (Code RCP-30-5A, Spherotech) to allow reproducible and comparable median fluorescence intensity throughout the study period, as previously described (Ammirati et al., 2010). We identified seven principal T cell subsets and 50 T cell subpopulations derived by principal subsets by means of the combination of the surface markers. All data were acquired in FCS format using FACSDiva software 5.0 (BD Biosciences). Lymphocytes were identified and electronically gated on forward and orthogonal light scatter signals. The fluorescent signals for phenotype analyses were accumulated for the gated lymphocytes. The raw data were stored electronically to a server for archiving and data processing. Data were processed and analyzed using FCS Express V3 Research edition (De Novo Software; http://www.denovosoftware.com). Cell viability was >99%, as assessed using the Molecular Probes Patented LIVE/DEAD Viability (Invitrogen), according to the manufacturer instructions.
T Cell Activation
In vitro: murine CD4+ T cells were isolated with commercially available isolation kits (negative selection; EasySep, Invitrogen) according to manufacturer’s instructions from pooled lymph nodes (inguinal, mesenteric, axillary, brachial, superficial and deep cervical, lumbar, and sacral) of C57BL/6 mice and activated with plate bound anti-CD3 (1 μg/mL, eBioscience), anti-CD28 (5 μg/mL, eBioscience), and IL-2 (10 ng/mL, Roche) in the presence or absence of the Akt activator SC79 (500 nM, Tocris). In alternative, isolated CD4+ T cells were cultured over night with IL-7 (1 ng/mL, PeproTech) in the presence or absence of palmitic, linoleic, or stearic acid (200 μM, Sigma), followed by activation with plate bound anti-CD3 (0.5 μg/mL, eBioscience) and anti-CD28 (2.5 μg/mL, eBioscience).
In vivo: in Rag2KO Marilyn C57BL/6 female mice fed CD or HFD (test diet; Table S2) for 8 weeks memory antigen-specific (HY-specific) CD4+ T cells were generated by i.p. immunization with WT C57BL/6 male splenocytes (1.5 × 10⁶) for 14 days. T cells were then isolated from pooled lymph nodes of these mice (Figures 1A–1D, 2A–2G, and S2A–S2F) and injected i.v. in recipients (see Experimental Procedures, In Vivo Peritoneal Recruitment, below) or used for chemotaxis or flow cytometry.
In p110δD910A or WT C57BL/6 mice fed HFD (or CD as control) or PED (or PCD as control; test diet; Table S2) for 8 weeks, memory CD4+ T cells were generated by intraperitoneal immunization with CBA/BALBc splenocytes (1.5 × 10⁶; allogeneic immunization) for 7 days. T cells were then isolated from mesenteric lymph nodes of these mice and analyzed by FACS or western blot (Figures 2H and 2I, 5A, 5E–5H, 6A–6E, 6G–6J, and 7). In this system, the PI3K p110δ inhibitor IC87114 (Tocris) was administered i.p. at a dose of 50 mg/kg daily during the 7-day immunization (Ying et al., 2012). The Akt activator SC79 (Tocris) was administered i.p. at a dose of 7 mg/kg daily during the 7-day immunization (Moreira et al., 2015). Etomoxir (Sigma) was administered i.p. at a dose of 15 mg/kg daily during the 7-day immunization (Shriver and Manchester, 2011).
In OT-II p110δD910A mice fed CD or HFD for 8 weeks, memory antigen-specific (OVA-specific) CD4+ T cells were generated by intraperitoneal immunization with ovalbumin peptide (10 μg, Cambridge Research Biochemicals) and Poly IC (1:1, Sigma) for 7 days. T cells were then isolated from mesenteric lymph nodes of these mice (Figure 6F) and analyzed for chemotaxis.
In Vivo Peritoneal Recruitment
In vivo activated T cells from Rag2KO Marilyn female mice were isolated from pooled lymph nodes of HFD- or CD-fed donors, labeled with CFSE (HFD; 3.3 μM, Invitrogen) or PKH26 (CD; 2 μM, Sigma), pooled together, and intravenously injected in HFD or CD recipient male mice (5 × 10⁶ cells/mouse) that had received an intraperitoneal injection with zymosan (1 mg/mouse, Sigma) and IFNγ (600 U/mouse, PeproTech) 48 hr earlier. At 48 hr after injection, blood, peritoneal lavage, peritoneal membrane, mesenteric lymph nodes, and spleen were collected and analyzed by FACS for presence of CFSE- and PKH26-labeled T cells.
Membrane and Intracellular FACS Staining, Murine Studies
Spleen and blood samples were lysed of their RBCs before staining. Dead cells were excluded from analysis by staining with fixable Aqua Dead Cell Stain (Invitrogen). Isolated lymphocytes or DC were stained for surface markers: CD3, CD4, CD8, CD25, CD44, CCR7, CD62L, CXCR3, LFA1, Vβ6, CD40, CD80, CD86, MHCII, CD11c, CD19, CD14, and F4/80 with fluorescently conjugated primary antibodies (1:200, eBioscience/BioLegend) at 4°C for 30 min (37°C for CCR7) in FACS buffer (PBS + 2% FCS + 0.1% sodium azide) and fixed at 4°C for 30 min with 1% PFA in FACS buffer. For intracellular staining, isolated lymphocytes were incubated in permeabilization/fixation buffer (eBioscience) at 4°C for 1 hr. Samples were washed in permeabilization buffer and stained for the cytokines/chemokine IFNγ, IL4 (1:200, eBioscience/BioLegend) and CXCL10 (1:200, Stratech) with fluorescently conjugated primary antibodies at 4°C for 30 min in permeabilization buffer. All samples were then assessed by flow cytometry using a LSRFortessa (BD Biosciences) and FlowJo version 10 software. Dot plots were concatenated to be representative of the independent biological replicates used in each experiment.
Chemotaxis
Chemotaxis assays were performed in 5 μm transwell inlays (Corning). In vivo primed lymphocytes were isolated from mice fed CD or HFD for 8 weeks, suspended in migration medium (RPMI 2% FCS), and seeded in the upper transwell chamber (3 × 10⁵ cells/transwell). Chemokines (PeproTech) were added to the lower chamber, CXCL10 (300 ng/mL), or CCL19/21 (200 ng/mL of each chemokine). Migrated T cells were counted with a haemocytometer 3, 6, and 24 hr after seeding, then the percent of migrated cells were calculated.
Western Blot
Protein lysates were prepared from: (1) mesenteric lymph nodes isolated from in vivo primed mice fed CD or HFD for 8 weeks, (2) CD4+ T lymphocytes isolated by magnetic beads (Mylteni) from lean subjects (median BMI 22.43 Kg/m2, minimum 17.67 Kg/m2, and maximum 24.54 Kg/m2) and obese subjects (median BMI 31.64 Kg/m2, minimum 30.48 Kg/m2, and maximum 41.79 Kg/m2), and (3) CD4+ T lymphocytes isolated from pooled lymph nodes and activated as described above for the indicated time points. Samples were lysed in Nonidet P-40 lysis buffer (50 mM HEPES pH 8.0, 350 mM NaCl, 1% Nonidet P-40, 1 mM EDTA, 1 mM Na3VO4, 1 mM NaF, 20 mM glycerol-2-phosphate, 1 mM PMSF, 1 mM DTT, 10 μg/mL aprotinin, 10 μg/mL leupeptin, and a protease inhibitor mixture; Roche). Equivalent amounts of protein as determined by standard Bradford assay (Bio-Rad) were separated by SDS/PAGE and transferred to a Nylon membrane (GE Healthcare). Membranes were blocked for 2 hr at room temperature in 5% Milk/TBS-T (5% BSA/TBS-T for phosphorylation antibodies), incubated overnight at 4°C with primary antibodies (1:1,000), and subsequently with HRP-conjugated secondary antibody (Amersham Bioscience) (1:5,000). Antibodies against p-Akt (S473 and T308), Akt, p-S6 (S235/236), S6 and β-actin were purchased from Cell Signaling. Antibody against CCR7 was purchased from R&D. Density of bands was calculated relative to Akt, S6, or β-actin as shown in figures via the use of ImageJ software.
RNA Isolation and Reverse Transcription
RNA was isolated using commercially available kits (QIAGEN) according to the manufacturer’s instructions and assessed for quality and quantity using absorption measurements. Reverse transcription to cDNA was performed according to the manufacturer’s instruction (Applied Biosystems).
qRT-PCR
Gene expression analysis was done using SYBR Green Supermix (Bio-Rad) in CFX connect light cycler (Bio-Rad), according to the manufacturer’s instructions. Gene-relative expression was calculated using the ΔΔct method and normalized to a reference control (GAPDH): F 5′-GGCTCATGACCACAGTCCA-3′; R 5′-CACATTGGGGGTAGGAACAC-3′. CCR7 and CD62L primers sequences were the same as published in Finlay et al. (2012).
Mixed Leukocyte Reaction
In vitro: T cells were isolated from pooled lymph nodes of Rag2KO Marilyn female mice fed CD or HFD for 8 weeks and were labeled with CFSE (3.3 μM) in PBS for 10 min at room temperature. T cells (2 × 10⁵/well) were then stimulated with CD11c+ DC (7 × 10⁴/well) isolated from the spleen of C57BL/6 male mice fed CD or HFD for 8 weeks. CD11c+ DC were treated with mitomycin C to prevent proliferation prior to incubation with T cells. T cells were harvested 3 days later and CFSE dilution was assessed by flow cytometry (Figures 4A, 4B, and S5A).
In vivo: T cells were isolated from pooled lymph nodes of Rag2KO Marilyn female mice, labeled with CFSE (3.3 μM) in PBS for 10 min at room temperature, and intravenously injected in C57BL/6 recipient female mice (5 × 10⁶ cells/mouse). Concurrently, CD11c+ DC were isolated from the spleen of C57BL/6 male mice fed CD or HFD for 8 weeks and intraperitoneally injected in the C57BL/6 recipient female mice (1/4 spleen derived DC/mouse). Cells were harvested from the peritoneal lavage, spleen, and draining lymph nodes 5 days later and CFSE dilution was assessed by flow cytometry (Figures S5B and S5C).
Skin Grafts
Rag2KO and Marilyn female mice fed CD or HFD for 8 weeks received a C57BL/6 male-derived skin graft on the upper right back. Bandages were removed 7 days post-transplantation. Some Rag2KO mice were i.v. injected with 1 × 10⁶ CD4+ T cells isolated from Marilyn females 9 days post-transplantation. Mice were observed for rejection for a further 3 weeks. Mice were culled 4 weeks post-transplantation.
Lipid Raft Staining
T cells isolated from pooled lymph nodes of C57BL/6 mice fed CD or HFD for 8 weeks were activated as described above for 4 hr or left inactivated. Cells were stained with CTxB-FITC (8 μg/mL, Sigma) and CD4-PECy7 (1:200, eBioscience) at 4°C for 30 min in FACS buffer (PBS + 2%FCS + 0.1% sodium azide) and fixed at 4°C for 30 min with 1% PFA in FACS buffer. Samples were assessed using ImageStream flow cytometer (Amnis) and IDEAS software. For quantitative image analysis of lipid raft aggregation, bright field and fluorescent cell images were acquired. Bright detail intensity of CTxB staining was used to quantify lipid raft aggregation. The bright detail intensity feature calculates the sum of intensity values from the brightest areas within a cell that are morphologically defined as the peak fluorescence distributions of 3 pixel radius or less. There were 5,000 CD4+ T cells that were analyzed per condition.
Seahorse Flux Analysis
Oxidative metabolism was measured with a Seahorse XF96 Extracellular Flux Analyzer. As described before, isolated naive CD4+ T cells were cultured over night with IL-7 in the presence or absence of palmitic or stearic acid. 2 × 10⁵ CD4+ T cells were then seeded in a 96-well microplate in XF Assay Modified DMEM and incubated in a non-CO2 incubator for 1 hr prior to the assay. OCR was then measured according to the manufacturer’s instructions (Seahorse Bioscience).
Statistical Analysis
Statistical analysis of human data was performed using the SPSS v.21.0 for Windows (IBM Corporation) program. A Kolmogorov-Smirnov test was performed to test whether the studied cohort was representative of the entire PLIC population in terms of age, gender distribution, and clinical parameters. A Shapiro-Wilk test was performed to verify the normal distribution of linear variables; median and inter-quartile range (IQR) was reported and Mann-Whitney U non-parametric test was performed. Outliers detection (above and below 1.5 × IQR) was performed by use of Grubb’s test. Spearman correlation coefficients (ρ) were reported for univariate correlations between linear variables. ANOVA test was performed to compare clinical parameters and leukocyte subfraction among subjects divided by BMI and then adjusted for age, gender, and therapies by using analysis of covariances (ANCOVA). For all analysis, statistically relevant differences were considered for p values < 0.05.
For murine studies, data are expressed as mean ± SEM. Two-tailed Student’s t test was used to compare two groups with parametric data distribution. For multiple comparison analysis, 1-, 2-, or 3-way ANOVA was used, unless otherwise specified (Figure 1E). In all cases, a p value of less than 5% was considered to be significant.
Author Contributions
Conceived and designed the experiments: C.M., J.S., G.D.N., and F.M.M.-B. Performed the experiments: C.M., J.S., D. Cucchi, D. Coe, F.B., A.B., G.C., D. Caruso, and N.M. Analyzed the data: C.M., J.S., D. Cucchi, D. Coe, H.F., F.B., A.B., G.C., D. Caruso, N.M., E.A., and G.D.N. Contributed reagents/materials/analysis tools: M.P.L., K.O., A.L.C., and E.A. Wrote the paper: C.M., J.S., G.D.N., and F.M.M.-B.
Acknowledgments
This work was supported by the British Heart Foundation (fellowship FS/12/38/29640 and project grant PG/15/105/31906 to C.M.) and the Fondazione Cariplo (a project grant 2015-0552 to C.M. and G.D.N.) and forms part of the research themes contributing to the translational research portfolio of Barts and the London Cardiovascular Biomedical Research Unit, which is supported and funded by the National Institutes of Health Research. D.Cucchi was supported in part by a fellowship from the Istituto Pasteur, Fondazione Cenci-Bolognetti. G.D.N. was supported by the Telethon Foundation (GGP13002) and the Italian Ministero della Salute (WFR GR-2011-02346974). F.M.M.-B. is a recipient of the British Heart Foundation Chair of Cardiovascular Immunology (CH/15/2/32064).
Published: February 9, 2017
Footnotes
Supplemental Information includes Supplemental Experimental Procedures, six figures, and two tables and can be found with this article online at http://dx.doi.org/10.1016/j.cmet.2017.01.008.
Contributor Information
Claudio Mauro, Email: c.mauro@qmul.ac.uk.
Federica M. Marelli-Berg, Email: f.marelli-berg@qmul.ac.uk.
Supplemental Information
References
- Ammirati E., Cianflone D., Banfi M., Vecchio V., Palini A., De Metrio M., Marenzi G., Panciroli C., Tumminello G., Anzuini A. Circulating CD4+CD25hiCD127lo regulatory T-Cell levels do not reflect the extent or severity of carotid and coronary atherosclerosis. Arterioscler. Thromb. Vasc. Biol. 2010;30:1832–1841. doi: 10.1161/ATVBAHA.110.206813. [DOI] [PubMed] [Google Scholar]
- Ammirati E., Cianflone D., Vecchio V., Banfi M., Vermi A.C., De Metrio M., Grigore L., Pellegatta F., Pirillo A., Garlaschelli K. Effector memory T cells are associated with atherosclerosis in humans and animal models. J. Am. Heart Assoc. 2012;1:27–41. doi: 10.1161/JAHA.111.000125. [DOI] [PMC free article] [PubMed] [Google Scholar]
- Baragetti A., Norata G.D., Sarcina C., Rastelli F., Grigore L., Garlaschelli K., Uboldi P., Baragetti I., Pozzi C., Catapano A.L. High density lipoprotein cholesterol levels are an independent predictor of the progression of chronic kidney disease. J. Intern. Med. 2013;274:252–262. doi: 10.1111/joim.12081. [DOI] [PubMed] [Google Scholar]
- Bjørndal B., Burri L., Staalesen V., Skorve J., Berge R.K. Different adipose depots: their role in the development of metabolic syndrome and mitochondrial response to hypolipidemic agents. J. Obes. 2011;2011:490650. doi: 10.1155/2011/490650. [DOI] [PMC free article] [PubMed] [Google Scholar]
- Chen Y., Demir Y., Valujskikh A., Heeger P.S. The male minor transplantation antigen preferentially activates recipient CD4+ T cells through the indirect presentation pathway in vivo. J. Immunol. 2003;171:6510–6518. doi: 10.4049/jimmunol.171.12.6510. [DOI] [PubMed] [Google Scholar]
- Chen Y., Tian J., Tian X., Tang X., Rui K., Tong J., Lu L., Xu H., Wang S. Adipose tissue dendritic cells enhances inflammation by prompting the generation of Th17 cells. PLoS ONE. 2014;9:e92450. doi: 10.1371/journal.pone.0092450. [DOI] [PMC free article] [PubMed] [Google Scholar]
- Cildir G., Akıncılar S.C., Tergaonkar V. Chronic adipose tissue inflammation: all immune cells on the stage. Trends Mol. Med. 2013;19:487–500. doi: 10.1016/j.molmed.2013.05.001. [DOI] [PubMed] [Google Scholar]
- Cole M.A., Murray A.J., Cochlin L.E., Heather L.C., McAleese S., Knight N.S., Sutton E., Jamil A.A., Parassol N., Clarke K. A high fat diet increases mitochondrial fatty acid oxidation and uncoupling to decrease efficiency in rat heart. Basic Res. Cardiol. 2011;106:447–457. doi: 10.1007/s00395-011-0156-1. [DOI] [PMC free article] [PubMed] [Google Scholar]
- Eguchi K., Manabe I., Oishi-Tanaka Y., Ohsugi M., Kono N., Ogata F., Yagi N., Ohto U., Kimoto M., Miyake K. Saturated fatty acid and TLR signaling link β cell dysfunction and islet inflammation. Cell Metab. 2012;15:518–533. doi: 10.1016/j.cmet.2012.01.023. [DOI] [PubMed] [Google Scholar]
- Endo Y., Asou H.K., Matsugae N., Hirahara K., Shinoda K., Tumes D.J., Tokuyama H., Yokote K., Nakayama T. Obesity drives Th17 cell differentiation by inducing the lipid metabolic kinase, ACC1. Cell Rep. 2015;12:1042–1055. doi: 10.1016/j.celrep.2015.07.014. [DOI] [PubMed] [Google Scholar]
- Faulds M.H., Dahlman-Wright K. Metabolic diseases and cancer risk. Curr. Opin. Oncol. 2012;24:58–61. doi: 10.1097/CCO.0b013e32834e0582. [DOI] [PubMed] [Google Scholar]
- Finlay D.K., Rosenzweig E., Sinclair L.V., Feijoo-Carnero C., Hukelmann J.L., Rolf J., Panteleyev A.A., Okkenhaug K., Cantrell D.A. PDK1 regulation of mTOR and hypoxia-inducible factor 1 integrate metabolism and migration of CD8+ T cells. J. Exp. Med. 2012;209:2441–2453. doi: 10.1084/jem.20112607. [DOI] [PMC free article] [PubMed] [Google Scholar]
- Fu H., Kishore M., Gittens B., Wang G., Coe D., Komarowska I., Infante E., Ridley A.J., Cooper D., Perretti M., Marelli-Berg F.M. Self-recognition of the endothelium enables regulatory T-cell trafficking and defines the kinetics of immune regulation. Nat. Commun. 2014;5:3436. doi: 10.1038/ncomms4436. [DOI] [PMC free article] [PubMed] [Google Scholar]
- Gerriets V.A., Rathmell J.C. Metabolic pathways in T cell fate and function. Trends Immunol. 2012;33:168–173. doi: 10.1016/j.it.2012.01.010. [DOI] [PMC free article] [PubMed] [Google Scholar]
- Gupta S., Pablo A.M., Jiang Xc., Wang N., Tall A.R., Schindler C. IFN-gamma potentiates atherosclerosis in ApoE knock-out mice. J. Clin. Invest. 1997;99:2752–2761. doi: 10.1172/JCI119465. [DOI] [PMC free article] [PubMed] [Google Scholar]
- Haghikia A., Jörg S., Duscha A., Berg J., Manzel A., Waschbisch A., Hammer A., Lee D.H., May C., Wilck N. Dietary fatty acids directly impact central nervous system autoimmunity via the small intestine. Immunity. 2015;43:817–829. doi: 10.1016/j.immuni.2015.09.007. [DOI] [PubMed] [Google Scholar]
- Hamann A., Klugewitz K., Austrup F., Jablonski-Westrich D. Activation induces rapid and profound alterations in the trafficking of T cells. Eur. J. Immunol. 2000;30:3207–3218. doi: 10.1002/1521-4141(200011)30:11<3207::AID-IMMU3207>3.0.CO;2-L. [DOI] [PubMed] [Google Scholar]
- Karlsson E.A., Sheridan P.A., Beck M.A. Diet-induced obesity impairs the T cell memory response to influenza virus infection. J. Immunol. 2010;184:3127–3133. doi: 10.4049/jimmunol.0903220. [DOI] [PubMed] [Google Scholar]
- Lantz O., Grandjean I., Matzinger P., Di Santo J.P. Gamma chain required for naïve CD4+ T cell survival but not for antigen proliferation. Nat. Immunol. 2000;1:54–58. doi: 10.1038/76917. [DOI] [PubMed] [Google Scholar]
- Larbi A., Franceschi C., Mazzatti D., Solana R., Wikby A., Pawelec G. Aging of the immune system as a prognostic factor for human longevity. Physiology (Bethesda) 2008;23:64–74. doi: 10.1152/physiol.00040.2007. [DOI] [PubMed] [Google Scholar]
- Lindholm C.R., Ertel R.L., Bauwens J.D., Schmuck E.G., Mulligan J.D., Saupe K.W. A high-fat diet decreases AMPK activity in multiple tissues in the absence of hyperglycemia or systemic inflammation in rats. J. Physiol. Biochem. 2013;69:165–175. doi: 10.1007/s13105-012-0199-2. [DOI] [PMC free article] [PubMed] [Google Scholar]
- Liu Y., Wan Q., Guan Q., Gao L., Zhao J. High-fat diet feeding impairs both the expression and activity of AMPKa in rats’ skeletal muscle. Biochem. Biophys. Res. Commun. 2006;339:701–707. doi: 10.1016/j.bbrc.2005.11.068. [DOI] [PubMed] [Google Scholar]
- Macintyre A.N., Finlay D., Preston G., Sinclair L.V., Waugh C.M., Tamas P., Feijoo C., Okkenhaug K., Cantrell D.A. Protein kinase B controls transcriptional programs that direct cytotoxic T cell fate but is dispensable for T cell metabolism. Immunity. 2011;34:224–236. doi: 10.1016/j.immuni.2011.01.012. [DOI] [PMC free article] [PubMed] [Google Scholar]
- Mathis D., Shoelson S.E. Immunometabolism: an emerging frontier. Nat. Rev. Immunol. 2011;11:81. doi: 10.1038/nri2922. [DOI] [PMC free article] [PubMed] [Google Scholar]
- Mauro C., Marelli-Berg F.M. T cell immunity and cardiovascular metabolic disorders: does metabolism fuel inflammation? Front. Immunol. 2012;3:173. doi: 10.3389/fimmu.2012.00173. [DOI] [PMC free article] [PubMed] [Google Scholar]
- Mehta M.M., Chandel N.S. Targeting metabolism for lupus therapy. Sci. Transl. Med. 2015;7:274fs5. doi: 10.1126/scitranslmed.aaa6731. [DOI] [PubMed] [Google Scholar]
- Molinero L.L., Yin D., Lei Y.M., Chen L., Wang Y., Chong A.S., Alegre M.L. High-fat diet-induced obesity enhances allograft rejection. Transplantation. 2016;100:1015–1021. doi: 10.1097/TP.0000000000001141. [DOI] [PMC free article] [PubMed] [Google Scholar]
- Moreira J.B., Wohlwend M., Alves M.N., Wisløff U., Bye A. A small molecule activator of AKT does not reduce ischemic injury of the rat heart. J. Transl. Med. 2015;13:76. doi: 10.1186/s12967-015-0444-x. [DOI] [PMC free article] [PubMed] [Google Scholar]
- Norata G.D., Garlaschelli K., Ongari M., Raselli S., Grigore L., Catapano A.L. Effects of fractalkine receptor variants on common carotid artery intima-media thickness. Stroke. 2006;37:1558–1561. doi: 10.1161/01.STR.0000221803.16897.22. [DOI] [PubMed] [Google Scholar]
- Norata G.D., Raselli S., Grigore L., Garlaschelli K., Dozio E., Magni P., Catapano A.L. Leptin:adiponectin ratio is an independent predictor of intima media thickness of the common carotid artery. Stroke. 2007;38:2844–2846. doi: 10.1161/STROKEAHA.107.485540. [DOI] [PubMed] [Google Scholar]
- Norata G.D., Caligiuri G., Chavakis T., Matarese G., Netea M.G., Nicoletti A., O’Neill L.A., Marelli-Berg F.M. The cellular and molecular basis of translational immunometabolism. Immunity. 2015;43:421–434. doi: 10.1016/j.immuni.2015.08.023. [DOI] [PubMed] [Google Scholar]
- O’Sullivan D., van der Windt G.J., Huang S.C., Curtis J.D., Chang C.H., Buck M.D., Qiu J., Smith A.M., Lam W.Y., DiPlato L.M. Memory CD8(+) T cells use cell-intrinsic lipolysis to support the metabolic programming necessary for development. Immunity. 2014;41:75–88. doi: 10.1016/j.immuni.2014.06.005. [DOI] [PMC free article] [PubMed] [Google Scholar]
- Okkenhaug K., Bilancio A., Farjot G., Priddle H., Sancho S., Peskett E., Pearce W., Meek S.E., Salpekar A., Waterfield M.D. Impaired B and T cell antigen receptor signaling in p110delta PI 3-kinase mutant mice. Science. 2002;297:1031–1034. doi: 10.1126/science.1073560. [DOI] [PubMed] [Google Scholar]
- Reynolds C.M., McGillicuddy F.C., Harford K.A., Finucane O.M., Mills K.H., Roche H.M. Dietary saturated fatty acids prime the NLRP3 inflammasome via TLR4 in dendritic cells-implications for diet-induced insulin resistance. Mol. Nutr. Food Res. 2012;56:1212–1222. doi: 10.1002/mnfr.201200058. [DOI] [PubMed] [Google Scholar]
- Robertson N.J., Chai J.G., Millrain M., Scott D., Hashim F., Manktelow E., Lemonnier F., Simpson E., Dyson J. Natural regulation of immunity to minor histocompatibility antigens. J. Immunol. 2007;178:3558–3565. doi: 10.4049/jimmunol.178.6.3558. [DOI] [PubMed] [Google Scholar]
- Rocha V.Z., Folco E.J., Sukhova G., Shimizu K., Gotsman I., Vernon A.H., Libby P. Interferon-gamma, a Th1 cytokine, regulates fat inflammation: a role for adaptive immunity in obesity. Circ. Res. 2008;103:467–476. doi: 10.1161/CIRCRESAHA.108.177105. [DOI] [PMC free article] [PubMed] [Google Scholar]
- Rocha V.Z., Folco E.J., Ozdemir C., Sheikine Y., Christen T., Sukhova G.K., Tang E.H., Bittencourt M.S., Santos R.D., Luster A.D. CXCR3 controls T-cell accumulation in fat inflammation. Arterioscler. Thromb. Vasc. Biol. 2014;34:1374–1381. doi: 10.1161/ATVBAHA.113.303133. [DOI] [PMC free article] [PubMed] [Google Scholar]
- Schrauwen P., Wagenmakers A.J., van Marken Lichtenbelt W.D., Saris W.H., Westerterp K.R. Increase in fat oxidation on a high-fat diet is accompanied by an increase in triglyceride-derived fatty acid oxidation. Diabetes. 2000;49:640–646. doi: 10.2337/diabetes.49.4.640. [DOI] [PubMed] [Google Scholar]
- Shamshiev A.T., Ampenberger F., Ernst B., Rohrer L., Marsland B.J., Kopf M. Dyslipidemia inhibits Toll-like receptor-induced activation of CD8alpha-negative dendritic cells and protective Th1 type immunity. J. Exp. Med. 2007;204:441–452. doi: 10.1084/jem.20061737. [DOI] [PMC free article] [PubMed] [Google Scholar]
- Shaw A.C., Joshi S., Greenwood H., Panda A., Lord J.M. Aging of the innate immune system. Curr. Opin. Immunol. 2010;22:507–513. doi: 10.1016/j.coi.2010.05.003. [DOI] [PMC free article] [PubMed] [Google Scholar]
- Shriver L.P., Manchester M. Inhibition of fatty acid metabolism ameliorates disease activity in an animal model of multiple sclerosis. Sci. Rep. 2011;1:79. doi: 10.1038/srep00079. [DOI] [PMC free article] [PubMed] [Google Scholar]
- Swamy M., Beck-Garcia K., Beck-Garcia E., Hartl F.A., Morath A., Yousefi O.S., Dopfer E.P., Molnár E., Schulze A.K., Blanco R. A cholesterol-based allostery model of T cell receptor phosphorylation. Immunity. 2016;44:1091–1101. doi: 10.1016/j.immuni.2016.04.011. [DOI] [PubMed] [Google Scholar]
- Veillard N.R., Steffens S., Pelli G., Lu B., Kwak B.R., Gerard C., Charo I.F., Mach F. Differential influence of chemokine receptors CCR2 and CXCR3 in development of atherosclerosis in vivo. Circulation. 2005;112:870–878. doi: 10.1161/CIRCULATIONAHA.104.520718. [DOI] [PubMed] [Google Scholar]
- Viola A., Schroeder S., Sakakibara Y., Lanzavecchia A. T lymphocyte costimulation mediated by reorganization of membrane microdomains. Science. 1999;283:680–682. doi: 10.1126/science.283.5402.680. [DOI] [PubMed] [Google Scholar]
- Wen H., Gris D., Lei Y., Jha S., Zhang L., Huang M.T., Brickey W.J., Ting J.P. Fatty acid-induced NLRP3-ASC inflammasome activation interferes with insulin signaling. Nat. Immunol. 2011;12:408–415. doi: 10.1038/ni.2022. [DOI] [PMC free article] [PubMed] [Google Scholar]
- Yin Y., Choi S.C., Xu Z., Perry D.J., Seay H., Croker B.P., Sobel E.S., Brusko T.M., Morel L. Normalization of CD4+ T cell metabolism reverses lupus. Sci. Transl. Med. 2015;7:274ra18. doi: 10.1126/scitranslmed.aaa0835. [DOI] [PMC free article] [PubMed] [Google Scholar]
- Ying H., Fu H., Rose M.L., McCormack A.M., Sarathchandra P., Okkenhaug K., Marelli-Berg F.M. Genetic or pharmaceutical blockade of phosphoinositide 3-kinase p110δ prevents chronic rejection of heart allografts. PLoS ONE. 2012;7:e32892. doi: 10.1371/journal.pone.0032892. [DOI] [PMC free article] [PubMed] [Google Scholar]
Associated Data
This section collects any data citations, data availability statements, or supplementary materials included in this article.